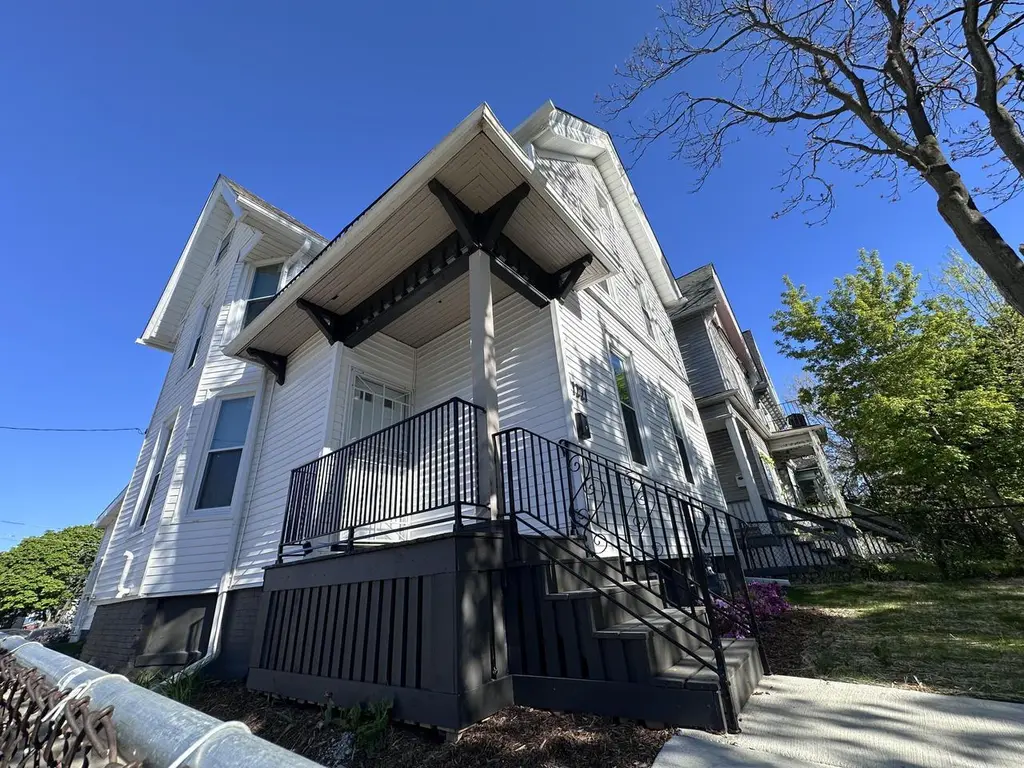
1221 N 24th St · Milwaukee, WI
Flood risk 1/10 · Minimal
- FEMA flood zone
- X (unshaded)
- Chance of flooding over 30 yrs
- 0.0%
- Est. flood insurance / yr
- $473 – $860
Fire risk 1/10 · Minimal
- Est. fire insurance / yr
- $636 – $1,182
Heat risk 2/10 · Minimal
- Hot days now (above 98°F)
- 7 days/yr
- Hot days in 30 yrs
- 13 days/yr
Wind risk 2/10 · Minimal
- Chance of severe wind over 30 yrs
- —
Air-quality risk 3/10 · Minor
- Unhealthy air days now
- 3 days/yr
- Unhealthy air days in 30 yrs
- 3 days/yr
Risk factors via First Street. Map © Google.
Why this score? — see what drove the C grade
The composite is a weighted blend of 9 inputs, each scored 0–100. Each bar is that input's sub-score; the figure is the points it added to the 100-point composite (weight × sub-score).
- Cash flow +15.7/30.0
- ARV discount +11.7/15.0
- Appreciation +6.5/10.0
- DSCR +4.8/10.0
- Condition / age +4.8/5.0
- 1% rule +4.3/10.0
- Livability +4.0/5.0
- Rent growth +2.5/5.0
- Schools +1.2/10.0
$239,900
🖨 Deal sheet 📄 Offer letter ✓ Due diligence
Listing remarks
Completely renovated 5 bed, 2 bath home with 2 car parking slab nearby Milwaukee High School of the Arts. Completely remodeled kitchen, new luxury vinyl plank floors and restored and refinished original hardwood floors. Both bathrooms feature tiled tub surrounds. New 200 amp electric service, new wiring, and electric fixtures. All new interior and exterior plumbing pipes and drains/sewers to the street. All new furnace and ductwork throughout. New insulation, roof, and siding. Many more updates, like a new construction home. Note: Broker does not verify room sizes. * MKE Homes program: Must be owner occupied for 5 years, no LLC's. Buyer must complete HUD certified home-buying counseling pri
Key facts
- New electric service
- Renovated home
- New wiring
Tags
Property features AI
Finance
- Other: Environmentally friendly features: low-energy windows and reclaimed/recycled content; other notes in remarks; Blinds included; Seller's personal property excluded
Exterior
- Parking: One parking space
- Utilities: Municipal water; Municipal sewer
- Home design: Two-story single-family home; Estimated 2,001–2,500 total living area; Less than 1/2 acre lot (approximately 0.09 acre); Zoned RT3
- Construction: Information source lists year built from assessor/public record
- Exterior features: Aluminum trim; Vinyl siding; Sidewalks
Interior
- Kitchen: Kitchen island; 13 x 15 kitchen; Oven; Range; New stove/range included
- Bedrooms: Main-level primary bedroom (15 x 10); Upper-level bedroom (10 x 13); Upper-level bedroom (15 x 11); Upper-level bedroom (14 x 8); Upper-level bedroom (9 x 8)
- Flooring: Wood floors; Ceramic tile in bathrooms
- Bathrooms: Two full bathrooms; Ceramic tile; Tub-only and shower-over-tub options; Shower stall
- Heating & cooling: Forced-air heating; Natural gas heat
- Interior features: Pantry; Walk-in closets; Wood floors; Block full basement with sump pump
- Laundry & utility: Mud room (6 x 9)
Neighborhood map
What this means for you Summary
Snapshot
- This is a 5-bed/2.0-bath single-family listed at $240k. Condition is rated excellent.
Deal economics
- At list price, monthly cash flow is $107 ($1k/yr) — positive.
- The deal already cash-flows at list — no discount required.
- To meet the 1% rule (rent ≥ 1% of price), the offer needs to be $223k (6.9% below list).
- Recommended offer: $223k (6.9% below list) — sets the bar for 1% rule.
- Cap rate 6.8% vs local median 5.1% in Milwaukee — top-decile yield for the area; either an underpriced asset or a hidden risk that comps aren't pricing in. Stress-test before assuming the spread holds.
Location & tenants
- Location reads 81/100 on livability (#55 in WI, #1,534 nationally) — a professional / high-income tenant draw. Strengths: amenities A+, commute A+, cost of living A+; Watch: employment D+, schools F, crime F.
- Milwaukee School District (urban): math 10% / reading 18% proficiency, ranked #337 of 342 in WI (top 98%) — low school quality limits family demand, transient renter base, plan for 1-2y turnover; 77% free/reduced lunch — lower-income household profile, screen leases tightly.
- Market conditions: 28 active listings in the ZIP; 3 comparable units currently listed for rent nearby; rentals lingering (median 44d on market — plan ~5-8 weeks vacancy on turnover, expect pricing pressure); 67% of comp listings sitting > 30 days — soft ceiling on asking rent; lower-income renter base — watch delinquency; 1,017 units permitted in Milwaukee County in 2024 (803 in 5+ unit buildings).
- At $2,234/mo this rent would consume 85% of the median local household income ($32k/yr) (locally 636% of renters already pay >50% of income on rent) — very limited rent-growth headroom before tenants either downsize or default.
Forward outlook
- In year one you build about $9k of equity ($2k loan paydown + $7k appreciation (3.0% local appreciation)).
- Milwaukee County population projected at +4% by 2050 — modest demand growth; plan on rents tracking national, not racing it.
- At projected returns (3.0% appreciation + 3.0% rent growth), your $67k cash investment doubles in ~6 years — after that, you're playing with house money.
- By year 4, paydown + projected appreciation supports a ~$30k cash-out refi (75% LTV) — recoverable capital for the next deal without selling this one.
Negotiation context
- It's been on market 37 days — a 3% lower offer ($233k) is reasonable based on typical stale-listing flexibility.
- 2 sale attempts; this cycle's ask is 13265% above the opening price — seller raised mid-cycle; expect resistance to lowballs.
Risks & watch-outs
- Watch-outs: built in 1886 — expect roof / HVAC / electrical / plumbing capex.
Questions for the listing agent
- It's been on market 37 days. Have you received any prior offers? Is the seller open to a 7% concession, seller financing, or rate buy-down credit?
- Built in 1886 — when were the roof, HVAC, electrical panel, plumbing, and water heater last replaced?
- Is there a deadline driving the sale (1031 exchange, divorce, estate, relocation)? That informs how much negotiation room exists.
- Schools are F-rated, which usually means shorter tenancies and higher turnover. Who's the typical renter profile here, and what's been the actual vacancy rate?
- Crime grade is F in this area — have there been break-ins, vandalism, or insurance claims at this property in the last 3 years? What carrier currently insures it and at what premium?
- What's the average days-on-market for RENTAL listings here right now (not sales)? A rising rental-DOM trend means longer vacancies and softer asking-rent achievability than the comps imply.
- What's the recent tenant-quality profile in this submarket — average credit score on applications, eviction rate, late-payment / NSF rate, and stable-employment percentage? A property-management company in the area should have these aggregated.
- How much new for-sale + rental construction is in the pipeline within 1–3 miles? Heavy new supply typically softens prices + rents 12–24 months out; constrained supply supports both.
Investment metrics
- 1% rule
- 0.93% ✗
- Cap rate
- 6.83%
- Cash-on-cash
- 1.91%
- DSCR
- 1.08
- GRM
- 9.0
CMA / ARV
- ARV (median comp)
- $264,449
- List price
- $239,900
- Delta
- -9.28%
- Verdict
- FAIR
- Comps
- 20 within 1.0 mi
Show comp detail 12 sales within ~0.75 mi
| Address | Dist | Beds/Ba | Sqft | Sold | Price | $/sf | Match |
|---|---|---|---|---|---|---|---|
| 2330 W Mckinley Ave | 0.08mi | 4/1.5 (-1) | 2,242 (-4%) | 20mo | $256,000 | $114 | 67 |
| 2426 W Highland Ave | 0.13mi | 4/3.0 (-1) | 2,194 (-6%) | 12mo | $262,275 | $120 | 65 |
| 845 N 22nd St | 0.38mi | 5/2.0 | 2,470 (+6%) | 9mo | $230,000 | $93 | 64 |
| 1028 N 29th St | 0.40mi | 5/2.5 | 2,519 (+8%) | 6mo | $250,600 | $99 | 61 |
| 2938 W State St | 0.48mi | 5/1.5 | 2,455 (+6%) | 10mo | $253,000 | $103 | 58 |
| 1254 N 20th St | 0.29mi | 4/3.0 (-1) | 2,516 (+8%) | 9mo | $290,450 | $115 | 56 |
| 3313 W Kilbourn Ave | 0.72mi | 5/2.0 | 2,323 (-0%) | 12mo | $195,000 | $84 | 56 |
| 1333 N 31st St | 0.50mi | 4/2.0 (-1) | 2,180 (-6%) | 7mo | $155,000 | $71 | 55 |
| 1011 N 21st St | 0.28mi | 5/2.0 | 2,026 (-13%) | 15mo | $229,800 | $113 | 53 |
| 1326 N 32nd St | 0.53mi | 5/3.0 | 2,491 (+7%) | 9mo | $240,000 | $96 | 52 |
| 1725 N 18th St | 0.62mi | 4/3.5 (-1) | 2,400 (+3%) | 5mo | $289,000 | $120 | 50 |
| 955 N 34th St | 0.73mi | 4/2.0 (-1) | 2,352 (+1%) | 13mo | $220,000 | $94 | 49 |
Match score weights: distance 35% · size 25% · config 20% · recency 20%. Top-matched comps best support the ARV.
Projected returns pro-forma
3.02% appreciation · 3.0% rent growth · sell at horizon
- IRR
- 9.4%
- Equity multiple
- 1.54×
- Total profit
- $36,028
- Equity at exit
- $108,185
- IRR
- 11.8%
- Equity multiple
- 2.76×
- Total profit
- $118,444
- Equity at exit
- $166,973
Cash invested: $67,172 (down + closing). Projections, not guarantees.
Landlord ↔ Tenant lean methodology
- Overall (STATE)
- 73 Landlord-Friendly
- State Wisconsin
- 73 Landlord-Friendly · R+2
- County
- — inherits STATE
- City
- — inherits STATE
ZIP-level market 53205
- Home prices YoY
- 0.8%
- Active inventory
- 28
- Price-to-rent
- 9.0×
Monthly cashflow live
- Estimated rent
- $2,234 medium interval (Pro) →
- Mortgage (P&I)
- −$1,258
- Tax est. 1.5%
- −$300 /mo · $3,598/yr
- Insurance
- −$100
- HOA
- −$0
- Vacancy / Maint / Mgmt
- −$469
- Net cashflow
- $107
Break-even live
UW: 25.0% down · 7.5% · 30yr · 1.5% tax · 5.0% vac · 8.0% maint · 8.0% mgmt
Financing live
Cash to close
- Down payment
- $59,975
- Closing costs
- $7,197
- Reserves months
- —
- Total cash needed
- —
Loan-product check · same deal, 3 products live
Conventional
25% down · 7.5% · 30yr
- Down + closing
- —
- Monthly P&I
- —
- Monthly cashflow
- —
- DSCR
- —
- Eligible?
- —
Personal DTI + credit; lowest rate.
DSCR
20% down · 8.5% · 30yr
- Down + closing
- —
- Monthly P&I
- —
- Monthly cashflow
- —
- DSCR
- —
- Eligible?
- —
No personal income docs; deal must DSCR.
Hard money
10% down · 12.0% · 12mo
- Down + closing
- —
- Monthly P&I
- —
- Monthly cashflow
- —
- DSCR
- —
- Eligible?
- —
Short-term bridge; refi at stabilization.
Rent comps 3 comps
| Address | Beds | Baths | Sqft | Rent | $/sqft | DOM | Units | Dist |
|---|---|---|---|---|---|---|---|---|
| 2028 W Michigan St Milwaukee, WI | 6.0 | 2.0 | 2005 | $2,450 | $1.22 | 10d | 1 | 0.61mi |
| 1227 W Juneau Ave Unit 1227 Milwaukee, WI | 4.0 | 1.0 | 3022 | $1,550 | $0.51 | 43d | 1 | 0.76mi |
| 2432 N 28th St Milwaukee, WI | 5.0 | 1.5 | 1876 | $1,600 | $0.85 | 43d | 1 | 1.22mi |
Listing history 15 events
-
2026-06-18days on market $239,900 Active 37 DOM
-
2026-06-17days on market $239,900 Active 36 DOM
-
2026-06-16days on market $239,900 Active 35 DOM
-
2026-06-15days on market $239,900 Active 34 DOM
-
2026-06-13days on market $239,900 Active 32 DOM
-
2026-06-13days on market $239,900 Active 31 DOM
-
2026-06-09days on market $239,900 Active 28 DOM
-
2026-06-08days on market $239,900 Active 27 DOM
-
2026-06-07days on market $239,900 Active 26 DOM
-
2026-06-05days on market $239,900 Active 23 DOM
-
2026-06-03days on market $239,900 Active 22 DOM
-
2026-06-02days on market $239,900 Active 21 DOM
-
2026-06-01days on market $239,900 Active 20 DOM
-
2026-05-31days on market $239,900 Active 19 DOM
-
2026-05-12$249,900 Active 715-char remark
ⓘ Source: listings_history table (triggers on properties + properties_extension) + one-shot
backfill from property_details.listing_events for pre-trigger history.
Climate risk First Street
- Flood 1/10 Low FEMA zone X (unshaded) · 0% chance over 30 yrs
- Wildfire 1/10 Low
- Heat 2/10 Low 7 d/yr ≥98°F today · 13 d/yr by 30 yrs out
- Wind 2/10 Low
- Air quality 3/10 Moderate 3 unhealthy d/yr today · 3 by 30 yrs out
Nearby sold comps map
Loading sold comps map…
Walkable amenities ~0.75 mi
Loading nearby amenities…
Taxation est. · year 1
- Rental income
- $26,804
- − Mortgage interest
- −$13,438
- − Property taxes
- −$3,598
- − Insurance
- −$1,200
- − Repairs & maintenance
- −$2,144
- − Management
- −$2,144
- − Depreciation
- −$6,979
- Taxable loss
- −$2,699
- Est. tax savings @ 24.0%
- +$648
- After-tax cash flow
- $1,929/yr
For passive investors: Depreciation is non-cash, so a rental often shows a tax loss while cash-flowing — sheltering income. Rental losses are passive: they offset passive income freely, and up to $25,000/yr can offset ordinary (W-2) income if you actively participate and your MAGI is under $100k (phasing out to $0 by $150k); unused losses carry forward. On sale, claimed depreciation is recaptured at up to 25%, and gains may owe capital-gains tax (a 1031 exchange can defer both). Figures are a year-1 estimate at your 24.0% rate — not tax advice; consult a CPA.
Condition & rehab AI · 30 photos
This completely renovated home is move-in ready with new kitchen, bathrooms, flooring, and HVAC. It offers excellent curb appeal and is ideal for owner-occupancy or investment.
Value-add opportunities
- Resale Painting exterior and interior walls — Fresh paint enhances curb appeal and interior aesthetics.
- Resale Landscaping improvements — Enhances curb appeal and adds value.
- Resale Upgrading light fixtures — Modernizes the home and improves energy efficiency.
- Both Adding smart home features — Enhances home's appeal and adds value for both resale and rental.
Renovation cost estimate screening
Value-add ROI direction
- Resale Painting exterior and interior walls — Fresh paint enhances curb appeal and interior aesthetics. ↑
- Resale Landscaping improvements — Enhances curb appeal and adds value. ↑
- Resale Upgrading light fixtures — Modernizes the home and improves energy efficiency. ↑
- Both Adding smart home features — Enhances home's appeal and adds value for both resale and rental. ↑
ⓘ Cost ranges are severity-bucket heuristics (US national rule-of-thumb). Get contractor quotes + a written scope before underwriting a rehab budget.
Schools (NCES district)
- District
- Milwaukee School District
- NCES district ID
- 5509600
- Math proficiency
- 10% ▼ -5.00%
- Reading proficiency
- 18% ▬ 0.00%
- Median HH income
- $36,339
- Composite
- 11.61/100
- National rank
- #9696
- State rank
- #337 of 342 in WI
Livability — Milwaukee
- Score
- 81/100
- State rank
- #55
- US rank
- #1534
Category grades
Schools grade is shown separately in the Schools card above.
Census & demographics
- Census place
- Milwaukee, WI
- County
- Milwaukee County · 926,379 people
- City population
- 573,768
- Metro
- Milwaukee-Waukesha, WI
- Population (ZIP)
- 9,265
- Household income
- $31,529
- Rent vs Own
- Severe rent burden
- 636.0
Population outlook (Milwaukee County) Hauer SSP2
- Today (2025)
- 995,758 people
- By 2030
- 1,009,124 · +1.3%
- By 2040
- 1,028,128 · +3.3%
- By 2050
- 1,040,066 · +4.4%
- By 2075
- 1,057,849 · +6.2%
- By 2100
- 1,039,774 · +4.4%
Race, ethnicity, and origin ACS 2023
- Neighborhood character
- Predominantly Black (80%)
- Race & ethnicity
- Black 80% Asian 7% White 6% Hispanic / Latino 6% Two or more races 3%
- Hispanic origin (detail)
- Mexican 4%
- Common ancestry
- Portuguese 1% Lithuanian 1% Swedish 1%
- Foreign-born
- 6% · Canada
- Languages at home
- 88% English-only · Other Asian/Pacific 5% Spanish 5%
Political lean MEDSL · Milwaukee
- 2024 margin
- Solid D (+38.5) · D 68.3% · R 29.8% · Other 1.8%
- 2008→2024 swing
- +2.7pp toward D · 2008: 35.9pp · 2024: 38.5pp
- All cycles
- 2024: D+38.5 2020: D+39.9 2016: D+37.5 2012: D+34.6 2008: D+35.9
Not yet ingested
- Civics
- —
Market trends
- HPI YoY
- ▲ 3.02%
- Current HPI
- 363.0038
- Rent YoY
- —
- Metro
- Milwaukee-Waukesha, WI
- State GDP YoY
- ▲ 2.10%
- F500 in state
- 20
Industry mix (Fortune 500 HQ in WI)
| Industry | F500 HQs | Revenue |
|---|---|---|
| Industrial Machinery | 4 | $23B |
|
||
| Industrial Technology | 2 | $36B |
|
||
| Insurance | 1 | $36B |
|
||
| Professional Services | 1 | $19B |
|
||
| Utilities | 1 | $9B |
|
||
| Consumer Goods | 1 | $3B |
|
||
Price history
-99.3% since first listed4 events — show timeline
- 2026-06-08 Rental Removed $1,795 APPFOLIO
- 2026-05-26 Listed for Rent $1,795 APPFOLIO
- 2026-05-24 Price Changed $239,900 METROMLS
- 2026-05-12 Listed $249,900 METROMLS
Cash-flow waterfall
monthlySold comps — $/sqft
last 12 mo · ≤1 miLoading sold comps…