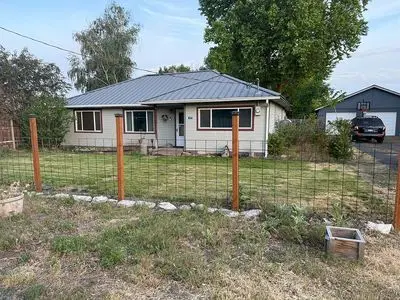
40 Long Ln · Eschbach, WA
Flood risk 1/10 · Minimal
- FEMA flood zone
- X (shaded)
- Chance of flooding over 30 yrs
- 0.0%
- Est. flood insurance / yr
- $507 – $1,088
Fire risk 5/10 · Moderate
- Est. fire insurance / yr
- $604 – $1,122
Heat risk 4/10 · Minor
- Hot days now (above 96°F)
- 7 days/yr
- Hot days in 30 yrs
- 15 days/yr
Wind risk 1/10 · Minimal
- Chance of severe wind over 30 yrs
- —
Air-quality risk 9/10 · Severe
- Unhealthy air days now
- 15 days/yr
- Unhealthy air days in 30 yrs
- 17 days/yr
Risk factors via First Street. Map © Google.
Why this score? — see what drove the D+ grade
The composite is a weighted blend of 9 inputs, each scored 0–100. Each bar is that input's sub-score; the figure is the points it added to the 100-point composite (weight × sub-score).
- ARV discount +14.4/15.0
- Cash flow +12.4/30.0
- Schools +4.8/10.0
- Rent growth +4.1/5.0
- DSCR +3.7/10.0
- 1% rule +3.5/10.0
- Livability +3.2/5.0
- Condition / age +2.5/5.0
- Appreciation +0.0/10.0
$245,000
🖨 Deal sheet 📄 Offer letter ✓ Due diligence
Listing remarks
Investor special! tons of opportunity here - Great neighborhood near nache river - 1.25 acres total - Parcel with the house is . 43 acres. parcel behind is . 83 acres and is includes. 4 bed 2 bath. 1 bathroom has been gutted and is ready to be remodeled. Oversized 2 car garage. Newer metal roof.
Key facts
- Near nache river
- Newer metal roof
- 1.25 acres total
Tags
Neighborhood map
What this means for you Summary
Snapshot
- This is a 3-bed/1.5-bath single-family listed at $245k.
Deal economics
- At list price, monthly cash flow is $-43 ($-510/yr) — negative.
- To cash-flow at today's rent, offer at most $239k (2.5% below list).
- To meet the 1% rule (rent ≥ 1% of price), the offer needs to be $209k (14.7% below list).
- Recommended offer: $209k (14.7% below list) — sets the bar for 1% rule.
Location & tenants
- Location reads 64/100 on livability (#362 in WA) — a middle-class / working-renter tenant base. Strengths: cost of living A+, housing A+, employment A; Watch: crime F, amenities F, commute F.
- Naches Valley School District (rural): math 48% / reading 59% proficiency, ranked #112 of 291 in WA (top 38%) — acceptable for families but not a draw, mixed tenant base, ~2y average lease.
- Market conditions: Rents rising fast (+6.5%/yr); 326 active listings in the ZIP; solid renter incomes; 468 units permitted in Yakima County in 2024 (23 in 5+ unit buildings).
Forward outlook
- Local home prices are declining (-3.0%/yr); year-one equity from $2k of loan paydown is wiped out by about $7k of value loss. Plan a longer hold.
- Yakima County population projected at +6% by 2050 — modest demand growth; plan on rents tracking national, not racing it.
Negotiation context
- Only 13 days on market — expect competitive offers; lowballing is unlikely to land.
Risks & watch-outs
- Watch-outs: built in 1950 — expect roof / HVAC / electrical / plumbing capex.
- Climate carrying-cost: moderate wildfire risk — expect insurance premiums to compound above CPI over the hold.
Questions for the listing agent
- What do current leases actually rent for vs. the listed asking? Can we see a recent rent roll and the last 12 months of T-12 income?
- Built in 1950 — when were the roof, HVAC, electrical panel, plumbing, and water heater last replaced?
- Is there a deadline driving the sale (1031 exchange, divorce, estate, relocation)? That informs how much negotiation room exists.
- Crime grade is F in this area — have there been break-ins, vandalism, or insurance claims at this property in the last 3 years? What carrier currently insures it and at what premium?
- The area grade is low — what's the realistic commute time and amenity access for the typical tenant pool here? Any planned neighborhood developments (good or bad) we should know about?
- What's the average days-on-market for RENTAL listings here right now (not sales)? A rising rental-DOM trend means longer vacancies and softer asking-rent achievability than the comps imply.
- What's the recent tenant-quality profile in this submarket — average credit score on applications, eviction rate, late-payment / NSF rate, and stable-employment percentage? A property-management company in the area should have these aggregated.
- How much new for-sale + rental construction is in the pipeline within 1–3 miles? Heavy new supply typically softens prices + rents 12–24 months out; constrained supply supports both.
Investment metrics
- 1% rule
- 0.85% ✗
- Cap rate
- 6.08%
- Cash-on-cash
- -0.74%
- DSCR
- 0.97
- GRM
- 9.8
CMA / ARV
- ARV (on-the-fly)
- $289,408
- Comps found
- 1
Show comp detail 1 sale within ~0.75 mi
| Address | Dist | Beds/Ba | Sqft | Sold | Price | $/sf | Match |
|---|---|---|---|---|---|---|---|
| 50 Maddox St | 0.64mi | 3/2.0 | 1,474 (+14%) | 20mo | $330,000 | $224 | 28 |
Match score weights: distance 35% · size 25% · config 20% · recency 20%. Top-matched comps best support the ARV.
Projected returns pro-forma
-3.0% appreciation · 6.45% rent growth · sell at horizon
- IRR
- -13.7%
- Equity multiple
- 0.49×
- Total profit
- $-34,873
- Equity at exit
- $36,530
- IRR
- -0.1%
- Equity multiple
- 0.99×
- Total profit
- $-667
- Equity at exit
- $21,183
Cash invested: $68,600 (down + closing). Projections, not guarantees.
Landlord ↔ Tenant lean methodology
- Overall (STATE)
- 28 Tenant-Leaning
- State Washington
- 28 Tenant-Leaning · D+8
- County
- — inherits STATE
- City
- — inherits STATE
ZIP-level market 98908
- Rents YoY
- 6.5%
- Active inventory
- 326
- Price-to-rent
- 9.8×
Monthly cashflow live
- Estimated rent
- $2,089 medium interval (Pro) →
- Mortgage (P&I)
- −$1,285
- Tax est. 1.5%
- −$306 /mo · $3,675/yr
- Insurance
- −$102
- HOA
- −$0
- Vacancy / Maint / Mgmt
- −$439
- Net cashflow
- $-43
Break-even live
UW: 25.0% down · 7.5% · 30yr · 1.5% tax · 5.0% vac · 8.0% maint · 8.0% mgmt
Financing live
Cash to close
- Down payment
- $61,250
- Closing costs
- $7,350
- Reserves months
- —
- Total cash needed
- —
Loan-product check · same deal, 3 products live
Conventional
25% down · 7.5% · 30yr
- Down + closing
- —
- Monthly P&I
- —
- Monthly cashflow
- —
- DSCR
- —
- Eligible?
- —
Personal DTI + credit; lowest rate.
DSCR
20% down · 8.5% · 30yr
- Down + closing
- —
- Monthly P&I
- —
- Monthly cashflow
- —
- DSCR
- —
- Eligible?
- —
No personal income docs; deal must DSCR.
Hard money
10% down · 12.0% · 12mo
- Down + closing
- —
- Monthly P&I
- —
- Monthly cashflow
- —
- DSCR
- —
- Eligible?
- —
Short-term bridge; refi at stabilization.
Listing history 12 events
-
2026-06-19days on market $245,000 Active 13 DOM
-
2026-06-18days on market $245,000 Active 12 DOM
-
2026-06-17days on market $245,000 Active 11 DOM
-
2026-06-16pricedays on market $245,000 Active 10 DOM
-
2026-06-15days on market $265,000 Active 9 DOM
-
2026-06-14days on market $265,000 Active 7 DOM
-
2026-06-13days on market $265,000 Active 6 DOM
-
2026-06-10days on market $265,000 Active 4 DOM
-
2026-06-09days on market $265,000 Active 3 DOM
-
2026-06-08days on market $265,000 Active 2 DOM
-
2026-06-07remarks 296-char remark
-
2026-06-07$265,000 Active 1 DOM
ⓘ Source: listings_history table (triggers on properties + properties_extension) + one-shot
backfill from property_details.listing_events for pre-trigger history.
Climate risk First Street
- Flood 1/10 Low FEMA zone X (shaded) · 0% chance over 30 yrs
- Wildfire 5/10 Major
- Heat 4/10 Moderate 7 d/yr ≥96°F today · 15 d/yr by 30 yrs out
- Wind 1/10 Low
- Air quality 9/10 Extreme 15 unhealthy d/yr today · 17 by 30 yrs out
Nearby sold comps map
Loading sold comps map…
Walkable amenities ~0.75 mi
Loading nearby amenities…
Taxation est. · year 1
- Rental income
- $25,073
- − Mortgage interest
- −$13,724
- − Property taxes
- −$3,675
- − Insurance
- −$1,225
- − Repairs & maintenance
- −$2,006
- − Management
- −$2,006
- − Depreciation
- −$7,127
- Taxable loss
- −$4,690
- Est. tax savings @ 24.0%
- +$1,126
- After-tax cash flow
- $615/yr
For passive investors: Depreciation is non-cash, so a rental often shows a tax loss while cash-flowing — sheltering income. Rental losses are passive: they offset passive income freely, and up to $25,000/yr can offset ordinary (W-2) income if you actively participate and your MAGI is under $100k (phasing out to $0 by $150k); unused losses carry forward. On sale, claimed depreciation is recaptured at up to 25%, and gains may owe capital-gains tax (a 1031 exchange can defer both). Figures are a year-1 estimate at your 24.0% rate — not tax advice; consult a CPA.
Schools (NCES district)
- District
- Naches Valley School District
- NCES district ID
- 5305460
- Math proficiency
- 48% ▼ -2.00%
- Reading proficiency
- 59% ▲ 1.00%
- Median HH income
- $55,781
- Composite
- 48.09/100
- National rank
- #4761
- State rank
- #112 of 291 in WA
Livability — Eschbach
- Score
- 64/100
- State rank
- #362
- US rank
- #13742
Category grades
Schools grade is shown separately in the Schools card above.
Census & demographics
- Census place
- Eschbach, WA
- County
- Yakima County · 134,789 people
- Metro
- Yakima, WA
- Population (ZIP)
- 38,060
- Household income
- $84,197
- Rent vs Own
- Severe rent burden
- 1265.0
Population outlook (Yakima County) Hauer SSP2
- Today (2025)
- 256,514 people
- By 2030
- 259,403 · +1.1%
- By 2040
- 265,677 · +3.6%
- By 2050
- 273,061 · +6.5%
- By 2075
- 296,991 · +15.8%
- By 2100
- 315,291 · +22.9%
Race, ethnicity, and origin ACS 2023
- Neighborhood character
- Predominantly White (68%)
- Race & ethnicity
- White 68% Hispanic / Latino 24% Two or more races 12% Asian 2%
- Hispanic origin (detail)
- Mexican 22%
- Common ancestry
- Portuguese 4% Italian 3% Lithuanian 2%
- Foreign-born
- 7% · Canada, China, South Korea
- Languages at home
- 82% English-only · Spanish 16% German/W. Germanic 1%
Political lean MEDSL · Yakima
- 2024 margin
- R (+14.3) · D 41.6% · R 55.9% · Other 2.5%
- 2008→2024 swing
- -3.8pp toward R · 2008: -10.6pp · 2024: -14.3pp
- All cycles
- 2024: R+14.3 2020: R+7.7 2016: R+15.4 2012: R+15.1 2008: R+10.6
Not yet ingested
- Civics
- —
Market trends
- HPI YoY
- ▼ -337.28%
- Current HPI
- 258.8688
- Rent YoY
- ▲ 6.45%
- Metro
- Yakima, WA
- State GDP YoY
- ▲ 4.65%
- F500 in state
- 22
Industry mix (Fortune 500 HQ in WA)
| Industry | F500 HQs | Revenue |
|---|---|---|
| Retail | 2 | $269B |
|
||
| Technology / Retail | 1 | $638B |
|
||
| Technology | 1 | $245B |
|
||
| Telecommunications | 1 | $38B |
|
||
| Food / Beverage | 1 | $36B |
|
||
| Automotive / Trucks | 1 | $34B |
|
||
Price history
1 event — show timeline
- 2026-06-07 Listed $265,000 FSBO.com
Property tax history
-3.9%/yrLatest (2026): $249 · -15.7% YoY. Source: county tax records.
Cash-flow waterfall
monthlySold comps — $/sqft
last 12 mo · ≤1 miLoading sold comps…