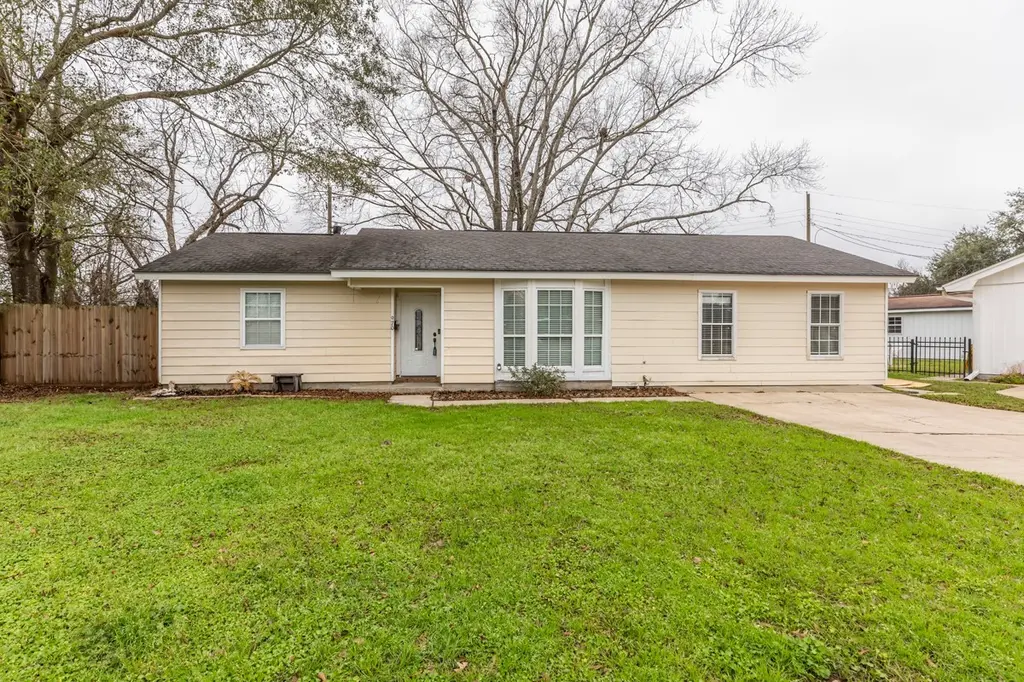
970 Charleston Cir · Bridge City, TX
Flood risk 9/10 · Severe
- FEMA flood zone
- X (shaded)
- Chance of flooding over 30 yrs
- 0.99%
- Est. flood insurance / yr
- $507 – $1,088
Fire risk 2/10 · Minimal
- Est. fire insurance / yr
- $1,222 – $2,270
Heat risk 9/10 · Severe
- Hot days now (above 109°F)
- 7 days/yr
- Hot days in 30 yrs
- 23 days/yr
Wind risk 9/10 · Severe
- Chance of severe wind over 30 yrs
- 99.0%
Air-quality risk 3/10 · Minor
- Unhealthy air days now
- 2 days/yr
- Unhealthy air days in 30 yrs
- 3 days/yr
Risk factors via First Street. Map © Google.
Why this score? — see what drove the C+ grade
The composite is a weighted blend of 9 inputs, each scored 0–100. Each bar is that input's sub-score; the figure is the points it added to the 100-point composite (weight × sub-score).
- Cash flow +22.3/30.0
- ARV discount +15.0/15.0
- DSCR +7.1/10.0
- 1% rule +6.5/10.0
- Schools +4.0/10.0
- Livability +3.6/5.0
- Rent growth +2.5/5.0
- Condition / age +2.5/5.0
- Appreciation +0.0/10.0
$169,900
🖨 Deal sheet 📄 Offer letter ✓ Due diligence
Listing remarks MLS
Make your move to this 4-bed, 3-bath Bridge City home offering generous space and a functional layout. Several rooms have recently been repainted, and some areas feature recently installed carpet, giving parts of the home a refreshed feel. The property includes an above-ground pool for summer fun and a shed for extra storage. Conveniently located in Bridge City ISD, it’s close to schools, shopping, and dining. PER SELLER, NO FLOODING IN HARVEY OR IMELDA. A great opportunity to make it your own—schedule a showing today!
Key facts
- Close to schools
- Close to dining
- Above-ground pool
Tags
Neighborhood map
What this means for you Summary
Snapshot
- This is a 4-bed/3.0-bath single-family listed at $170k.
Deal economics
- At list price, monthly cash flow is $213 ($3k/yr) — positive.
- The deal already cash-flows at list — no discount required.
- Meets the 1% rule at list price ($2k rent vs $170k).
- Recommended offer: $160k (6.0% below list) — sets the bar for market timing.
- Cap rate 8.3% vs local median 2.2% in Bridge City — top-decile yield for the area; either an underpriced asset or a hidden risk that comps aren't pricing in. Stress-test before assuming the spread holds.
Location & tenants
- Location reads 72/100 on livability (#251 in TX) — a middle-class / working-renter tenant base. Strengths: crime A+, employment A+, cost of living A+; Watch: schools C-, amenities F, commute F.
- Bridge City ISD (other): math 41% / reading 51% proficiency, ranked #224 of 826 in TX (top 27%) — families likely to look elsewhere, expect single-tenant / working-renter base with shorter leases.
- Market conditions: 125 active listings in the ZIP; 5 comparable units currently listed for rent nearby; rentals leasing fast (median 14d on market — plan ~1-2 weeks tenant-placement turnaround); 40% of comp listings sitting > 30 days — soft ceiling on asking rent; solid renter incomes; 235 units permitted in Orange County in 2024 (50 in 5+ unit buildings).
Forward outlook
- Local home prices are declining (-3.0%/yr); year-one equity from $1k of loan paydown is wiped out by about $5k of value loss. Plan a longer hold.
- Orange County population projected at +6% by 2050 — modest demand growth; plan on rents tracking national, not racing it.
Negotiation context
- It's been on market 66 days — a 6% lower offer ($160k) is reasonable based on typical stale-listing flexibility.
- 3 sale attempts since 8y ago with the ask held roughly flat each time — persistent listings suggest the price (not the market) is what's stuck; bring a comps-based counter.
Risks & watch-outs
- Watch-outs: flood insurance adds $66/mo.
- Climate carrying-cost: severe flood risk; severe wind risk, 99% chance of damaging wind over 30y; extreme-heat days projected 7→23/yr by 2055 (HVAC capex compounding) — expect insurance premiums to compound above CPI over the hold.
Questions for the listing agent
- It's been on market 66 days. Have you received any prior offers? Is the seller open to a 6% concession, seller financing, or rate buy-down credit?
- Built in 1963 — when were the roof, HVAC, electrical panel, plumbing, and water heater last replaced?
- What's the actual annual flood-insurance premium (NFIP or private), and is the property in a SFHA with mandatory coverage?
- Why hasn't it sold? Are there any deal-killer items the seller is aware of (foundation, flood, title, zoning, code violations)?
- Is there a deadline driving the sale (1031 exchange, divorce, estate, relocation)? That informs how much negotiation room exists.
- What's the average days-on-market for RENTAL listings here right now (not sales)? A rising rental-DOM trend means longer vacancies and softer asking-rent achievability than the comps imply.
- What's the recent tenant-quality profile in this submarket — average credit score on applications, eviction rate, late-payment / NSF rate, and stable-employment percentage? A property-management company in the area should have these aggregated.
- How much new for-sale + rental construction is in the pipeline within 1–3 miles? Heavy new supply typically softens prices + rents 12–24 months out; constrained supply supports both.
Investment metrics
- 1% rule
- 1.15% ✓
- Cap rate
- 8.27%
- Cash-on-cash
- 7.06%
- DSCR
- 1.31
- GRM
- 7.3
CMA / ARV
- ARV (median comp)
- $262,060
- List price
- $169,900
- Delta
- -35.17%
- Verdict
- UNDERPRICED
- Comps
- 20 within 1.0 mi
Show comp detail 10 sales within ~0.75 mi
| Address | Dist | Beds/Ba | Sqft | Sold | Price | $/sf | Match |
|---|---|---|---|---|---|---|---|
| 970 Charleston Cir | 0.00mi | 4/3.0 | 1,609 (0%) | 0mo | $169,900 | $106 | 100 |
| 1140 Arthur St | 0.30mi | 3/2.0 (-1) | 1,739 (+8%) | 8mo | $229,999 | $132 | 57 |
| 855 Carolina | 0.11mi | 3/1.0 (-1) | 1,386 (-14%) | 4mo | $155,000 | $112 | 56 |
| 500 Larry Ward Dr | 0.43mi | 3/2.0 (-1) | 1,727 (+7%) | 8mo | $249,900 | $145 | 52 |
| 317 Paula Ave | 0.57mi | 3/2.0 (-1) | 1,628 (+1%) | 14mo | $199,999 | $123 | 51 |
| 895 Morning Glory Dr | 0.72mi | 3/2.0 (-1) | 1,618 (+1%) | 7mo | $179,900 | $111 | 51 |
| 103 Holly Grove St | 0.45mi | 3/2.0 (-1) | 1,788 (+11%) | 2mo | $266,000 | $149 | 50 |
| 307 Martin Ave | 0.63mi | 4/2.0 | 1,576 (-2%) | 19mo | $185,000 | $117 | 47 |
| 320 Meadow Dr | 0.70mi | 3/2.0 (-1) | 1,714 (+6%) | 4mo | $237,700 | $139 | 44 |
| 800 Cactus St | 0.68mi | 3/2.0 (-1) | 1,688 (+5%) | 10mo | $199,900 | $118 | 43 |
Match score weights: distance 35% · size 25% · config 20% · recency 20%. Top-matched comps best support the ARV.
Projected returns pro-forma
-3.0% appreciation · 3.0% rent growth · sell at horizon
- IRR
- -7.9%
- Equity multiple
- 0.71×
- Total profit
- $-13,822
- Equity at exit
- $25,333
- IRR
- 1.8%
- Equity multiple
- 1.13×
- Total profit
- $5,959
- Equity at exit
- $14,690
Cash invested: $47,572 (down + closing). Projections, not guarantees.
Landlord ↔ Tenant lean methodology
- Overall (STATE)
- 87 Strongly Landlord-Friendly
- State Texas
- 87 Strongly Landlord-Friendly · R+5
- County
- — inherits STATE
- City
- — inherits STATE
ZIP-level market 77611
- Active inventory
- 125
- Price-to-rent
- 7.3×
Monthly cashflow live
- Estimated rent
- $1,950 high interval (Pro) →
- Mortgage (P&I)
- −$891
- Tax from tax record
- −$299 /mo · $3,587/yr
- Insurance
- −$71
- Flood insurance flood zone
- −$66 /mo · $798/yr
- HOA
- −$0
- Vacancy / Maint / Mgmt
- −$409
- Net cashflow
- $213
Break-even live
UW: 25.0% down · 7.5% · 30yr · 1.5% tax · 5.0% vac · 8.0% maint · 8.0% mgmt
Financing live
Cash to close
- Down payment
- $42,475
- Closing costs
- $5,097
- Reserves months
- —
- Total cash needed
- —
Loan-product check · same deal, 3 products live
Conventional
25% down · 7.5% · 30yr
- Down + closing
- —
- Monthly P&I
- —
- Monthly cashflow
- —
- DSCR
- —
- Eligible?
- —
Personal DTI + credit; lowest rate.
DSCR
20% down · 8.5% · 30yr
- Down + closing
- —
- Monthly P&I
- —
- Monthly cashflow
- —
- DSCR
- —
- Eligible?
- —
No personal income docs; deal must DSCR.
Hard money
10% down · 12.0% · 12mo
- Down + closing
- —
- Monthly P&I
- —
- Monthly cashflow
- —
- DSCR
- —
- Eligible?
- —
Short-term bridge; refi at stabilization.
Rent comps 5 comps
| Address | Beds | Baths | Sqft | Rent | $/sqft | DOM | Units | Dist |
|---|---|---|---|---|---|---|---|---|
| 1180 Alton St Bridge City, TX | 3.0 | 1.5 | 1470 | $1,800 | $1.22 | 13d | 1 | 0.30mi |
| 1320 Wisteria St Bridge City, TX | 3.0 | 2.0 | 2151 | $2,800 | $1.30 | 43d | 1 | 0.50mi |
| 880 Morning Glory Dr Bridge City, TX | 3.0 | 2.0 | 1515 | $1,795 | $1.18 | 43d | 1 | 0.77mi |
| 404 Crescent Dr Bridge City, TX | 3.0 | 2.0 | 1063 | $1,500 | $1.41 | 13d | 1 | 0.89mi |
| 2201 Wise St Bridge City, TX | 2.0–3.0 | 1.0–2.0 | 1144 | $1,500 | $1.31 | 13d | 7 | 1.45mi |
Listing history 10 events
-
2026-06-17days on market $169,900 Pending 66 DOM
-
2026-05-11status Pending 536-char remark
Show marketing remark (536 chars)
Make your move to this 4-bed, 3-bath Bridge City home offering generous space and a functional layout. Several rooms have recently been repainted, and some areas feature recently installed carpet, giving parts of the home a refreshed feel. The property includes an above-ground pool for summer fun and a shed for extra storage. Conveniently located in Bridge City ISD, it’s close to schools, shopping, and dining. PER SELLER, NO FLOODING IN HARVEY OR IMELDA. A great opportunity to make it your own—schedule a showing today!
-
2026-03-06$169,900 Active 536-char remark
Show marketing remark (536 chars)
Make your move to this 4-bed, 3-bath Bridge City home offering generous space and a functional layout. Several rooms have recently been repainted, and some areas feature recently installed carpet, giving parts of the home a refreshed feel. The property includes an above-ground pool for summer fun and a shed for extra storage. Conveniently located in Bridge City ISD, it’s close to schools, shopping, and dining. PER SELLER, NO FLOODING IN HARVEY OR IMELDA. A great opportunity to make it your own—schedule a showing today!
-
2025-03-27price $177,900
-
2018-07-19soldstatus
-
2018-07-17soldstatus
-
2018-05-30$125,000
-
2007-03-15soldstatus
ⓘ Source: listings_history table (triggers on properties + properties_extension) + one-shot
backfill from property_details.listing_events for pre-trigger history.
Tax reassessment forecast TX · Resets to sale price
- Current annual tax
- $3,587 · $299/mo
- Projected year-2 tax
- $3,587 · $299/mo
- Expected delta
- $0/yr ($0/mo · 0.0%)
ⓘ Screening estimate from a state-policy table — verify with the county assessor before closing.
Climate risk First Street
- Flood 9/10 Extreme FEMA zone X (shaded) · 99% chance over 30 yrs
- Wildfire 2/10 Low
- Heat 9/10 Extreme 7 d/yr ≥109°F today · 23 d/yr by 30 yrs out
- Wind 9/10 Extreme 99% chance of damaging wind over 30 yrs
- Air quality 3/10 Moderate 2 unhealthy d/yr today · 3 by 30 yrs out
Nearby sold comps map
Loading sold comps map…
Walkable amenities ~0.75 mi
Loading nearby amenities…
Taxation est. · year 1
- Rental income
- $23,400
- − Mortgage interest
- −$9,517
- − Property taxes
- −$3,587
- − Insurance
- −$1,647
- − Repairs & maintenance
- −$1,872
- − Management
- −$1,872
- − Depreciation
- −$4,943
- Taxable loss
- −$38
- Est. tax savings @ 24.0%
- +$9
- After-tax cash flow
- $2,569/yr
For passive investors: Depreciation is non-cash, so a rental often shows a tax loss while cash-flowing — sheltering income. Rental losses are passive: they offset passive income freely, and up to $25,000/yr can offset ordinary (W-2) income if you actively participate and your MAGI is under $100k (phasing out to $0 by $150k); unused losses carry forward. On sale, claimed depreciation is recaptured at up to 25%, and gains may owe capital-gains tax (a 1031 exchange can defer both). Figures are a year-1 estimate at your 24.0% rate — not tax advice; consult a CPA.
Schools (NCES district)
- District
- Bridge City ISD
- NCES district ID
- 4811310
- Math proficiency
- 41% ▼ -11.00%
- Reading proficiency
- 51% ▲ 1.00%
- Median HH income
- $60,817
- Composite
- 40.47/100
- National rank
- #3720
- State rank
- #224 of 826 in TX
Livability — Bridge City
- Score
- 72/100
- State rank
- #251
- US rank
- #5948
Category grades
Schools grade is shown separately in the Schools card above.
Census & demographics
- Census place
- Bridge City, TX
- County
- Orange County · 87,112 people
- City population
- 10,112
- Metro
- Beaumont-Port Arthur, TX
- Population (ZIP)
- 10,112
- Household income
- $92,004
- Rent vs Own
- Severe rent burden
- 214.0
Population outlook (Orange County) Hauer SSP2
- Today (2025)
- 88,065 people
- By 2030
- 89,591 · +1.7%
- By 2040
- 91,982 · +4.4%
- By 2050
- 93,023 · +5.6%
- By 2075
- 94,871 · +7.7%
- By 2100
- 88,155 · +0.1%
Race, ethnicity, and origin ACS 2023
- Neighborhood character
- Predominantly White (82%)
- Race & ethnicity
- White 82% Hispanic / Latino 14% Two or more races 12% Asian 2%
- Hispanic origin (detail)
- Mexican 12%
- Common ancestry
- Lithuanian 12% Slovak 3% Iranian 2%
- Foreign-born
- 3% · Canada
- Languages at home
- 89% English-only · Spanish 6% French/Haitian/Cajun 2% Russian/Polish/Slavic 1%
Political lean MEDSL · Orange
- 2024 margin
- Solid R (+66.8) · D 16.4% · R 83.1%
- 2008→2024 swing
- -19.6pp toward R · 2008: -47.1pp · 2024: -66.8pp
- All cycles
- 2024: R+66.8 2020: R+63.4 2016: R+61.9 2012: R+54.3 2008: R+47.1
Not yet ingested
- Civics
- —
Market trends
- HPI YoY
- ▼ -98.42%
- Current HPI
- 155.9874
- Rent YoY
- —
- Metro
- Beaumont-Port Arthur, TX
- State GDP YoY
- ▲ 3.95%
- F500 in state
- 110
Industry mix (Fortune 500 HQ in TX)
| Industry | F500 HQs | Revenue |
|---|---|---|
| Energy | 16 | $1,198B |
|
||
| Technology | 5 | $198B |
|
||
| Engineering / Construction | 4 | $72B |
|
||
| Energy Services | 3 | $60B |
|
||
| Utilities | 3 | $41B |
|
||
| Healthcare | 2 | $330B |
|
||
Price history
+35.9% since first listed9 events — show timeline
- 2026-05-11 Pending — HARMLS
- 2026-05-11 Pending — BBOR
- 2026-03-06 Listed $169,900 BBOR
- 2026-03-06 Listed $169,900 HARMLS
- 2025-03-27 Price Changed $177,900 BBOR
- 2018-07-19 Sold (Public Records) — Public Records
- 2018-07-17 Sold (MLS) — BBOR
- 2018-05-30 Listed $125,000 BBOR
- 2007-03-15 Sold (Public Records) — Public Records
Property tax history
+5.9%/yrLatest (2025): $3,587 · +2.2% YoY. Source: county tax records.
Cash-flow waterfall
monthlySold comps — $/sqft
last 12 mo · ≤1 miLoading sold comps…