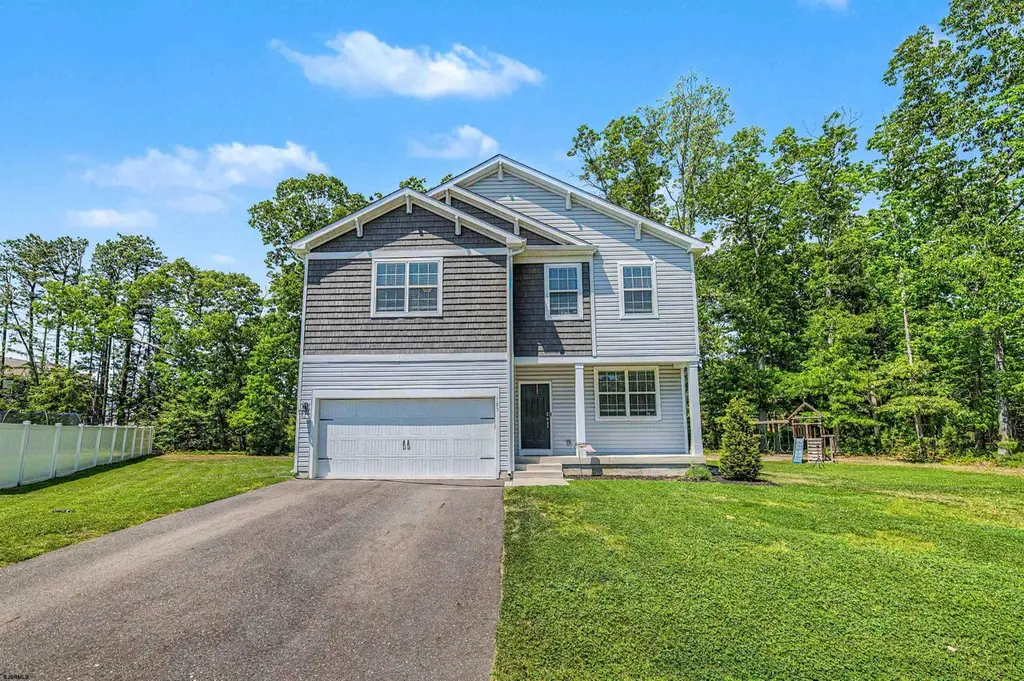
103 Wilkshire · Bargaintown, NJ
Flood risk 1/10 · Minimal
- FEMA flood zone
- X (unshaded)
- Chance of flooding over 30 yrs
- 0.0%
- Est. flood insurance / yr
- $507 – $1,088
Fire risk 3/10 · Minor
- Est. fire insurance / yr
- $526 – $976
Heat risk 8/10 · Major
- Hot days now (above 99°F)
- 7 days/yr
- Hot days in 30 yrs
- 16 days/yr
Wind risk 8/10 · Major
- Chance of severe wind over 30 yrs
- 80.0%
Air-quality risk 2/10 · Minimal
- Unhealthy air days now
- 1 days/yr
- Unhealthy air days in 30 yrs
- 2 days/yr
Risk factors via First Street. Map © Google.
Why this score? — see what drove the D grade
The composite is a weighted blend of 9 inputs, each scored 0–100. Each bar is that input's sub-score; the figure is the points it added to the 100-point composite (weight × sub-score).
- Cash flow +11.9/30.0
- ARV discount +11.2/15.0
- 1% rule +4.4/10.0
- DSCR +3.5/10.0
- Schools +3.0/10.0
- Rent growth +2.5/5.0
- Livability +2.5/5.0
- Condition / age +2.5/5.0
- Appreciation +0.0/10.0
$489,900
🖨 Deal sheet 📄 Offer letter ✓ Due diligence
Listing remarks
NEW AND IMPROVED PRICE! Welcome to this beautiful 4BD 2.5 BA 2 story homes, less than 5 years old and located on a quiet cul de sac which backs to the woods for added privacy. As you enter the front door you have a den and or perfect space for a home office. Your custom EIK has quartz countertops, 42 inch cabinets and a center island along with a breakfast nook. You also have a large pantry. The family room overlooks your EIK which is a perfect set up for entertaining. The upstairs has 3 very nice sized bedrooms along with a designated full bath and your Master BD has a walk in closet and it’s own private Master Bath. Your laundry room is located upstairs which makes it very convenien
Key facts
- Breakfast nook
- Quartz countertops
- Backs to the woods
Tags
Property features AI
Finance
- Other: Not in floodplain; Zoned RES
Exterior
- Parking: Attached two-car garage with automatic door opener; Space for two exterior vehicles
- Utilities: Public water; Public sewer; Gas water heater
- Home design: Residential property; 2–5 years old; Property is for sale
- Construction: Vinyl exterior
- Exterior features: Vinyl siding; Patio; Concrete driveway; Curbs and sidewalks; Insulated glass; Cul-de-sac lot; Wooded lot
Interior
- Kitchen: Gas stove; Microwave; Dishwasher; Garbage disposal; Refrigerator; Kitchen with eat-in area and breakfast nook; Pantry; Kitchen island
- Bedrooms: Upper-level bedrooms (several); Main-level bedroom (includes a breakfast nook)
- Flooring: Tile; Wall-to-wall carpet; Laminate
- Bathrooms: Two full bathrooms; One half bathroom; Upper-level full baths
- Heating & cooling: Central air conditioning; Ceiling fans; Forced air heating; Natural gas heating
- Interior features: Carbon monoxide detector; Smoke/fire alarm; Kitchen center island; Walk-in closet; Storage; Blinds
- Laundry & utility: Washer; Dryer; Laundry/utility room
Neighborhood map
What this means for you Summary
Snapshot
- This is a 4-bed/2.5-bath single-family listed at $490k.
Deal economics
- At list price, monthly cash flow is $-125 ($-1k/yr) — negative.
- To cash-flow at today's rent, offer at most $468k (4.5% below list).
- To meet the 1% rule (rent ≥ 1% of price), the offer needs to be $461k (6.0% below list).
- Recommended offer: $461k (6.0% below list) — sets the bar for 1% rule.
- Cap rate 6.0% vs local median 4.2% in Bargaintown — top-decile yield for the area; either an underpriced asset or a hidden risk that comps aren't pricing in. Stress-test before assuming the spread holds.
Location & tenants
- Location reads: area grade D — affects rentability + tenant quality, not the cash-flow math above.
- Egg Harbor Township School District (suburban): math 18% / reading 46% proficiency, ranked #311 of 472 in NJ (top 66%) — families likely to look elsewhere, expect single-tenant / working-renter base with shorter leases.
- Market conditions: 357 active listings in the ZIP; 3 comparable units currently listed for rent nearby; rentals at typical pace (median 21d on market — plan ~3-4 weeks tenant-placement turnaround); 672 units permitted in Atlantic County in 2024 (258 in 5+ unit buildings).
Forward outlook
- Local home prices are declining (-3.0%/yr); year-one equity from $3k of loan paydown is wiped out by about $15k of value loss. Plan a longer hold.
- Atlantic County population projected at -12% by 2050 — secular population decline; favor cash flow + early exit over multi-decade hold.
Negotiation context
- It's been on market 26 days — a 2% lower offer ($483k) is reasonable based on typical stale-listing flexibility.
- 2 sale attempts since 6y ago; this cycle's ask has dropped $59k (11%) from the opening price — seller is motivated, your offer sets the floor, not the list.
Risks & watch-outs
- Climate carrying-cost: severe wind risk, 80% chance of damaging wind over 30y; extreme-heat days projected 7→16/yr by 2055 (HVAC capex compounding) — expect insurance premiums to compound above CPI over the hold.
Questions for the listing agent
- What do current leases actually rent for vs. the listed asking? Can we see a recent rent roll and the last 12 months of T-12 income?
- Is there a deadline driving the sale (1031 exchange, divorce, estate, relocation)? That informs how much negotiation room exists.
- The area grade is low — what's the realistic commute time and amenity access for the typical tenant pool here? Any planned neighborhood developments (good or bad) we should know about?
- What's the average days-on-market for RENTAL listings here right now (not sales)? A rising rental-DOM trend means longer vacancies and softer asking-rent achievability than the comps imply.
- What's the recent tenant-quality profile in this submarket — average credit score on applications, eviction rate, late-payment / NSF rate, and stable-employment percentage? A property-management company in the area should have these aggregated.
- How much new for-sale + rental construction is in the pipeline within 1–3 miles? Heavy new supply typically softens prices + rents 12–24 months out; constrained supply supports both.
Investment metrics
- 1% rule
- 0.94% ✗
- Cap rate
- 5.99%
- Cash-on-cash
- -1.09%
- DSCR
- 0.95
- GRM
- 8.9
CMA / ARV
- ARV (on-the-fly)
- $534,336
- Comps found
- 12
Show comp detail 12 sales within ~0.75 mi
| Address | Dist | Beds/Ba | Sqft | Sold | Price | $/sf | Match |
|---|---|---|---|---|---|---|---|
| 212 Windswept Dr | 0.33mi | 4/2.5 | 2,192 (-1%) | 3mo | $540,000 | $246 | 81 |
| 119 Woodberry Dr | 0.28mi | 4/2.5 | 2,250 (+2%) | 10mo | $535,000 | $238 | 76 |
| 1055 Old Zion Rd | 0.47mi | 4/2.5 | 2,192 (-1%) | 3mo | $530,000 | $242 | 75 |
| 7 Beechnut Ave | 0.48mi | 4/2.5 | 2,340 (+6%) | 9mo | $519,990 | $222 | 60 |
| 203 Tallowwood | 0.25mi | 4/2.5 | 2,538 (+15%) | 8mo | $620,000 | $244 | 57 |
| 312 Knollwood Dr | 0.46mi | 3/3.0 (-1) | 2,090 (-5%) | 8mo | $585,000 | $280 | 56 |
| 311 Reynolds Rd | 0.64mi | 3/2.5 (-1) | 2,300 (+4%) | 5mo | $518,000 | $225 | 54 |
| 61 Burnside Dr | 0.56mi | 4/3.0 | 2,394 (+8%) | 7mo | $440,000 | $184 | 52 |
| 129 Bridle Path Dr | 0.42mi | 4/3.5 | 2,446 (+11%) | 11mo | $600,000 | $245 | 49 |
| 23 Sturbridge Ct | 0.73mi | 4/2.5 | 2,063 (-7%) | 7mo | $500,000 | $242 | 49 |
| 310 Superior Rd | 0.66mi | 4/2.5 | 1,906 (-14%) | 7mo | $479,900 | $252 | 41 |
| 220 Ontario Ave | 0.72mi | 3/2.5 (-1) | 2,011 (-9%) | 11mo | $439,900 | $219 | 38 |
Match score weights: distance 35% · size 25% · config 20% · recency 20%. Top-matched comps best support the ARV.
Projected returns pro-forma
-3.0% appreciation · 3.0% rent growth · sell at horizon
- IRR
- -18.0%
- Equity multiple
- 0.37×
- Total profit
- $-87,013
- Equity at exit
- $73,046
- IRR
- -10.1%
- Equity multiple
- 0.38×
- Total profit
- $-84,757
- Equity at exit
- $42,358
Cash invested: $137,172 (down + closing). Projections, not guarantees.
Landlord ↔ Tenant lean methodology
- Overall (STATE)
- 21 Tenant-Leaning
- State New Jersey
- 21 Tenant-Leaning · D+6
- County
- — inherits STATE
- City
- — inherits STATE
ZIP-level market 08234
- Home prices YoY
- -6.7%
- Active inventory
- 357
- Price-to-rent
- 8.9×
Monthly cashflow live
- Estimated rent
- $4,605 medium interval (Pro) →
- Mortgage (P&I)
- −$2,569
- Tax from tax record
- −$989 /mo · $11,873/yr
- Insurance
- −$204
- HOA
- −$0
- Vacancy / Maint / Mgmt
- −$967
- Net cashflow
- $-125
Break-even live
UW: 25.0% down · 7.5% · 30yr · 1.5% tax · 5.0% vac · 8.0% maint · 8.0% mgmt
Financing live
Cash to close
- Down payment
- $122,475
- Closing costs
- $14,697
- Reserves months
- —
- Total cash needed
- —
Loan-product check · same deal, 3 products live
Conventional
25% down · 7.5% · 30yr
- Down + closing
- —
- Monthly P&I
- —
- Monthly cashflow
- —
- DSCR
- —
- Eligible?
- —
Personal DTI + credit; lowest rate.
DSCR
20% down · 8.5% · 30yr
- Down + closing
- —
- Monthly P&I
- —
- Monthly cashflow
- —
- DSCR
- —
- Eligible?
- —
No personal income docs; deal must DSCR.
Hard money
10% down · 12.0% · 12mo
- Down + closing
- —
- Monthly P&I
- —
- Monthly cashflow
- —
- DSCR
- —
- Eligible?
- —
Short-term bridge; refi at stabilization.
Rent comps 3 comps
| Address | Beds | Baths | Sqft | Rent | $/sqft | DOM | Units | Dist |
|---|---|---|---|---|---|---|---|---|
| 49 Fairhill Ave Egg Harbor Township, NJ | 4.0 | 2.5 | 2208 | $3,750 | $1.70 | 13d | 1 | 1.17mi |
| 102 Julie Dr Northfield, NJ | 5.0 | 3.5 | 2860 | $7,000 | $2.45 | 44d | 1 | 1.28mi |
| 1 Broadmoor Dr Egg Harbor Township, NJ | 5.0 | 2.5 | 2488 | $3,400 | $1.37 | 21d | 1 | 1.50mi |
Listing history 20 events
-
2026-06-19days on market $489,900 Active 26 DOM
-
2026-06-18days on market $489,900 Active 25 DOM
-
2026-06-17days on market $489,900 Active 24 DOM
-
2026-06-16days on market $489,900 Active 23 DOM
-
2026-06-15days on market $489,900 Active 22 DOM
-
2026-06-14days on market $489,900 Active 20 DOM
-
2026-06-13pricedays on market $489,900 Active 19 DOM
-
2026-06-10days on market $524,900 Active 17 DOM
-
2026-06-09days on market $524,900 Active 16 DOM
-
2026-06-08days on market $524,900 Active 15 DOM
-
2026-06-07days on market $524,900 Active 14 DOM
-
2026-06-02pricedays on market $524,900 Active 9 DOM
-
2026-06-01days on market $549,000 Active 8 DOM
-
2026-05-31days on market $549,000 Active 7 DOM
-
2026-05-30days on market $549,000 Active 6 DOM
-
2026-05-23$549,000 Active
-
2021-02-09soldstatus $2,262,000
-
2020-11-16$342,990
-
2020-11-16historical
-
2020-11-16historical
ⓘ Source: listings_history table (triggers on properties + properties_extension) + one-shot
backfill from property_details.listing_events for pre-trigger history.
Tax reassessment forecast NJ · Partial reset (capped growth)
- Current annual tax
- $11,873 · $989/mo
- Projected year-2 tax
- $12,036 · $1,003/mo
- Expected delta
- +$163/yr (+$14/mo · 1.4%)
ⓘ Screening estimate from a state-policy table — verify with the county assessor before closing.
Climate risk First Street
- Flood 1/10 Low FEMA zone X (unshaded) · 0% chance over 30 yrs
- Wildfire 3/10 Moderate
- Heat 8/10 Severe 7 d/yr ≥99°F today · 16 d/yr by 30 yrs out
- Wind 8/10 Severe 80% chance of damaging wind over 30 yrs
- Air quality 2/10 Low 1 unhealthy d/yr today · 2 by 30 yrs out
Nearby sold comps map
Loading sold comps map…
Walkable amenities ~0.75 mi
Loading nearby amenities…
Taxation est. · year 1
- Rental income
- $55,263
- − Mortgage interest
- −$27,442
- − Property taxes
- −$11,873
- − Insurance
- −$2,450
- − Repairs & maintenance
- −$4,421
- − Management
- −$4,421
- − Depreciation
- −$14,252
- Taxable loss
- −$9,596
- Est. tax savings @ 24.0%
- +$2,303
- After-tax cash flow
- $809/yr
For passive investors: Depreciation is non-cash, so a rental often shows a tax loss while cash-flowing — sheltering income. Rental losses are passive: they offset passive income freely, and up to $25,000/yr can offset ordinary (W-2) income if you actively participate and your MAGI is under $100k (phasing out to $0 by $150k); unused losses carry forward. On sale, claimed depreciation is recaptured at up to 25%, and gains may owe capital-gains tax (a 1031 exchange can defer both). Figures are a year-1 estimate at your 24.0% rate — not tax advice; consult a CPA.
Schools (NCES district)
- District
- Egg Harbor Township School District
- NCES district ID
- 3404560
- Math proficiency
- 18% ▼ -24.00%
- Reading proficiency
- 46% ▼ -6.00%
- Median HH income
- $71,612
- Composite
- 29.81/100
- National rank
- #6421
- State rank
- #311 of 472 in NJ
Livability — Bargaintown
No livability data for this city. (Only ~50 U.S. cities are tracked.)
Census & demographics
- Census place
- Bargaintown, NJ
- Population (ZIP)
- 46,856
Population outlook (Atlantic County) Hauer SSP2
- Today (2025)
- 268,948 people
- By 2030
- 264,497 · -1.7%
- By 2040
- 252,261 · -6.2%
- By 2050
- 237,846 · -11.6%
- By 2075
- 210,650 · -21.7%
- By 2100
- 180,234 · -33.0%
Race, ethnicity, and origin ACS 2023
- Neighborhood character
- Diverse neighborhood (Simpson 0.63)
- Race & ethnicity
- White 56% Hispanic / Latino 16% Asian 13% Black 9% Two or more races 9%
- Hispanic origin (detail)
- Mexican 3% Puerto Rican 6% Dominican 2%
- Common ancestry
- Romanian 3% Italian 1% Slovak 1%
- Foreign-born
- 17% · Canada, China, Vietnam
- Languages at home
- 73% English-only · Spanish 12% Other Indo-European 4% Tagalog/Filipino 3%
Political lean MEDSL · Atlantic
- 2024 margin
- Toss-up / Even · D 47.7% · R 50.7% · Other 1.6%
- 2008→2024 swing
- -18.1pp toward R · 2008: 15.1pp · 2024: -3.0pp
- All cycles
- 2024: R+3.0 2020: D+6.7 2016: D+6.2 2012: D+17.2 2008: D+15.1
Not yet ingested
- Civics
- —
Market trends
- HPI YoY
- ▼ -22.76%
- Current HPI
- 319.2948
- Rent YoY
- —
- Metro
- —
- State GDP YoY
- ▲ 2.05%
- F500 in state
- 34
Industry mix (Fortune 500 HQ in NJ)
| Industry | F500 HQs | Revenue |
|---|---|---|
| Consumer Goods | 3 | $31B |
|
||
| Pharmaceuticals | 2 | $153B |
|
||
| Technology | 2 | $21B |
|
||
| Insurance | 2 | $20B |
|
||
| Healthcare | 2 | $19B |
|
||
| Financial Services | 1 | $70B |
|
||
Price history
+60.1% since first listed5 events — show timeline
- 2026-05-23 Listed $549,000 SJSRMLS
- 2021-02-09 Sold (Public Records) $2,262,000 Public Records
- 2020-11-16 Listing Removed — BRIGHT MLS
- 2020-11-16 Listing Removed — BRIGHT MLS
- 2020-11-16 Listed $342,990 BRIGHT MLS
Property tax history
+25.8%/yrLatest (2025): $11,873 · +1.4% YoY. Source: county tax records.
Cash-flow waterfall
monthlySold comps — $/sqft
last 12 mo · ≤1 miLoading sold comps…