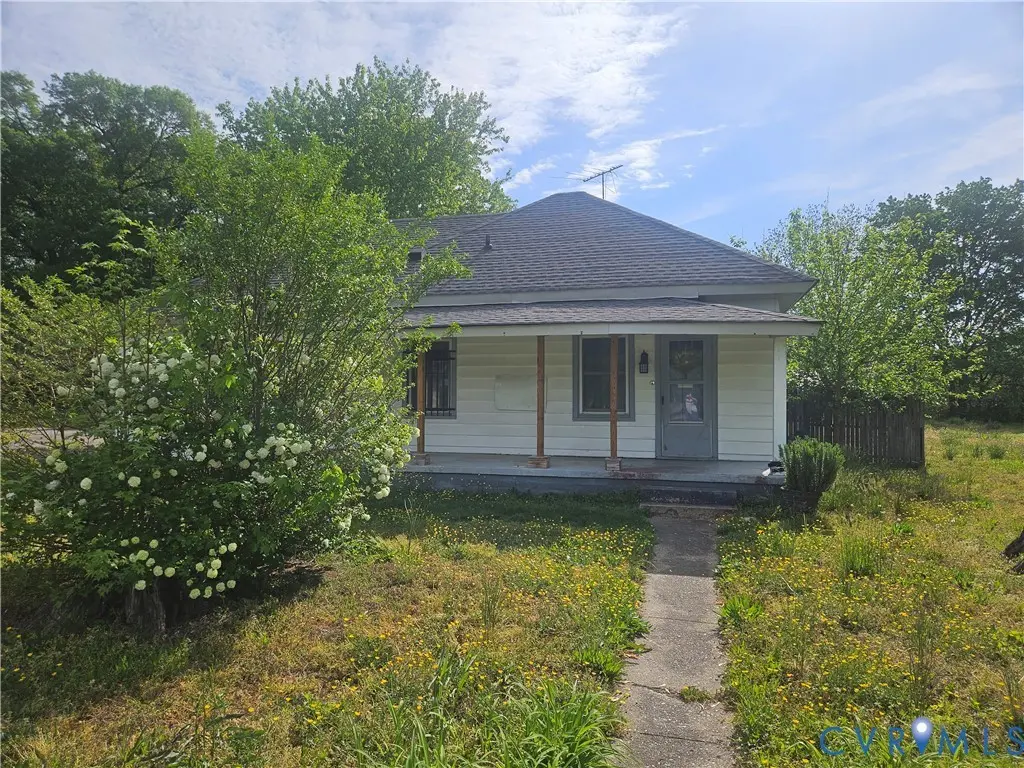
203 Wren Rd · Highland Springs, VA
Flood risk 1/10 · Minimal
- FEMA flood zone
- X (unshaded)
- Chance of flooding over 30 yrs
- 0.0%
- Est. flood insurance / yr
- $507 – $1,088
Fire risk 2/10 · Minimal
- Est. fire insurance / yr
- $666 – $1,236
Heat risk 7/10 · Major
- Hot days now (above 106°F)
- 7 days/yr
- Hot days in 30 yrs
- 16 days/yr
Wind risk 6/10 · Moderate
- Chance of severe wind over 30 yrs
- 27.0%
Air-quality risk 2/10 · Minimal
- Unhealthy air days now
- 1 days/yr
- Unhealthy air days in 30 yrs
- 3 days/yr
Risk factors via First Street. Map © Google.
Why this score? — see what drove the B grade
The composite is a weighted blend of 9 inputs, each scored 0–100. Each bar is that input's sub-score; the figure is the points it added to the 100-point composite (weight × sub-score).
- Cash flow +27.6/30.0
- ARV discount +15.0/15.0
- DSCR +9.7/10.0
- 1% rule +6.9/10.0
- Schools +4.9/10.0
- Rent growth +4.1/5.0
- Livability +3.6/5.0
- Condition / age +2.5/5.0
- Appreciation +0.0/10.0
$145,000
🖨 Deal sheet 📄 Offer letter ✓ Due diligence
Listing remarks
Listed below assessed value. Calling all investors. 3 bedroom 1 1/2 bath cottage located in eastern Henrico county. Newer roof, 1 1/2 car garage with lean to, carport, shed with lean to and circular paved driveway on almost 1 acre of land. Cash only property sold as is.
Key facts
- Newer roof
- 1 1/2 car garage
- 0.93 acre lot
Tags
Property features AI
Exterior
- Parking: Detached garage; Approximately 1.5 garage spaces; Driveway (paved)
- Utilities: Public sewer; Well water
- Home design: Single-story home; Resale property
- Construction: Block and drywall construction with vinyl siding; Shingle roof
- Exterior features: Front porch; Porch; Storage; Shed(s); Paved driveway; Circular driveway
Interior
- Bedrooms: Total of 7 rooms (bedrooms and living areas combined)
- Flooring: Vinyl flooring; Wood flooring
- Bathrooms: 1 full bathroom with tub and shower; 1 half bathroom
- Heating & cooling: Central air conditioning; Heating by baseboard, electric, and heat pump
- Interior features: Vinyl and wood flooring; Electric water heater
Neighborhood map
What this means for you Summary
Snapshot
- This is a 2-bed/1.0-bath single-family listed at $145k.
Deal economics
- At list price, monthly cash flow is $434 ($5k/yr) — positive.
- The deal already cash-flows at list — no discount required.
- Meets the 1% rule at list price ($2k rent vs $145k).
- Cap rate 9.9% vs local median 5.1% in Highland Springs — top-decile yield for the area; either an underpriced asset or a hidden risk that comps aren't pricing in. Stress-test before assuming the spread holds.
Location & tenants
- Location reads 72/100 on livability (#196 in VA) — a middle-class / working-renter tenant base. Strengths: commute A+, cost of living A+, housing A+; Watch: employment C-, amenities F, health & safety F.
- Henrico County Public School District (suburban): math 49% / reading 64% proficiency, ranked #68 of 131 in VA (top 52%) — acceptable for families but not a draw, mixed tenant base, ~2y average lease.
- Market conditions: Rents rising fast (+6.4%/yr); 337 active listings in the ZIP; 10 comparable units currently listed for rent nearby; rentals at typical pace (median 19d on market — plan ~3-4 weeks tenant-placement turnaround); 1,826 units permitted in Henrico County in 2024 (785 in 5+ unit buildings).
- This rent runs 37% of the median local income ($56k/yr) — at the standard rent-burdened threshold; future hikes will face affordability resistance.
Forward outlook
- Local home prices are declining (-3.0%/yr); year-one equity from $1k of loan paydown is wiped out by about $4k of value loss. Plan a longer hold.
- Henrico County population projected at +21% by 2050 — long-run rental-demand tailwind backs the buy-and-hold thesis.
- At projected returns (-3.0% appreciation + 6.4% rent growth), your $41k cash investment doubles in ~7 years — after that, you're playing with house money.
Negotiation context
- Only 1 days on market — expect competitive offers; lowballing is unlikely to land.
- 2 sale attempts since 3y ago with the ask held roughly flat each time — persistent listings suggest the price (not the market) is what's stuck; bring a comps-based counter.
- Current owner paid $55k; list at $145k implies a 164% gain — meaningful room to come down on a strong offer.
Risks & watch-outs
- Watch-outs: built in 1937 — expect roof / HVAC / electrical / plumbing capex.
- Climate carrying-cost: major wind risk, 27% chance of damaging wind over 30y; extreme-heat days projected 7→16/yr by 2055 (HVAC capex compounding) — expect insurance premiums to compound above CPI over the hold.
Questions for the listing agent
- Built in 1937 — when were the roof, HVAC, electrical panel, plumbing, and water heater last replaced?
- Is there a deadline driving the sale (1031 exchange, divorce, estate, relocation)? That informs how much negotiation room exists.
- What's the average days-on-market for RENTAL listings here right now (not sales)? A rising rental-DOM trend means longer vacancies and softer asking-rent achievability than the comps imply.
- What's the recent tenant-quality profile in this submarket — average credit score on applications, eviction rate, late-payment / NSF rate, and stable-employment percentage? A property-management company in the area should have these aggregated.
- How much new for-sale + rental construction is in the pipeline within 1–3 miles? Heavy new supply typically softens prices + rents 12–24 months out; constrained supply supports both.
Investment metrics
- 1% rule
- 1.19% ✓
- Cap rate
- 9.88%
- Cash-on-cash
- 12.82%
- DSCR
- 1.57
- GRM
- 7.0
CMA / ARV
- ARV (on-the-fly)
- $267,750
- Comps found
- 12
Show comp detail 12 sales within ~0.75 mi
| Address | Dist | Beds/Ba | Sqft | Sold | Price | $/sf | Match |
|---|---|---|---|---|---|---|---|
| 6 Emerson St | 0.48mi | 2/1.0 | 1,057 (+1%) | 1mo | $270,000 | $255 | 76 |
| 301 Buffalo Rd | 0.14mi | 2/1.0 | 1,000 (-5%) | 14mo | $266,000 | $266 | 74 |
| 213 Buffalo Rd | 0.07mi | 3/1.0 (+1) | 956 (-9%) | 14mo | $260,000 | $272 | 66 |
| 315 Cedar Fork Rd | 0.33mi | 2/2.0 | 1,100 (+5%) | 12mo | $269,900 | $245 | 63 |
| 5121 Bending Branch Dr | 0.19mi | 3/1.0 (+1) | 974 (-7%) | 18mo | $242,000 | $248 | 59 |
| 217 Liberty | 0.38mi | 3/1.0 (+1) | 960 (-9%) | 6mo | $155,000 | $161 | 58 |
| 220 Cedar Fork Rd | 0.61mi | 3/2.0 (+1) | 1,100 (+5%) | 0mo | $300,000 | $273 | 54 |
| 2 Emerson St | 0.44mi | 3/2.0 (+1) | 1,200 (+14%) | 2mo | $320,000 | $267 | 45 |
| 5517 Jefferson St | 0.59mi | 3/1.5 (+1) | 960 (-9%) | 13mo | $254,000 | $265 | 41 |
| 5906 3rd St | 0.58mi | 3/2.0 (+1) | 1,200 (+14%) | 4mo | $274,950 | $229 | 37 |
| 3809 Korth Ln | 0.74mi | 3/2.0 (+1) | 1,128 (+7%) | 12mo | $260,000 | $230 | 34 |
| 205 Seaton Dr | 0.74mi | 3/1.0 (+1) | 1,189 (+13%) | 18mo | $230,000 | $193 | 23 |
Match score weights: distance 35% · size 25% · config 20% · recency 20%. Top-matched comps best support the ARV.
Projected returns pro-forma
-3.0% appreciation · 6.38% rent growth · sell at horizon
- IRR
- 6.2%
- Equity multiple
- 1.25×
- Total profit
- $10,167
- Equity at exit
- $21,620
- IRR
- 18.3%
- Equity multiple
- 2.75×
- Total profit
- $70,994
- Equity at exit
- $12,537
Cash invested: $40,600 (down + closing). Projections, not guarantees.
Landlord ↔ Tenant lean methodology
- Overall (STATE)
- 55 Moderately Landlord-Leaning
- State Virginia
- 55 Moderately Landlord-Leaning · D+2
- County
- — inherits STATE
- City
- — inherits STATE
ZIP-level market 23223
- Rents YoY
- 6.4%
- Active inventory
- 337
- Price-to-rent
- 7.0×
Monthly cashflow live
- Estimated rent
- $1,723 high interval (Pro) →
- Mortgage (P&I)
- −$760
- Tax from tax record
- −$107 /mo · $1,280/yr
- Insurance
- −$60
- HOA
- −$0
- Vacancy / Maint / Mgmt
- −$362
- Net cashflow
- $434
Break-even live
UW: 25.0% down · 7.5% · 30yr · 1.5% tax · 5.0% vac · 8.0% maint · 8.0% mgmt
Financing live
Cash to close
- Down payment
- $36,250
- Closing costs
- $4,350
- Reserves months
- —
- Total cash needed
- —
Loan-product check · same deal, 3 products live
Conventional
25% down · 7.5% · 30yr
- Down + closing
- —
- Monthly P&I
- —
- Monthly cashflow
- —
- DSCR
- —
- Eligible?
- —
Personal DTI + credit; lowest rate.
DSCR
20% down · 8.5% · 30yr
- Down + closing
- —
- Monthly P&I
- —
- Monthly cashflow
- —
- DSCR
- —
- Eligible?
- —
No personal income docs; deal must DSCR.
Hard money
10% down · 12.0% · 12mo
- Down + closing
- —
- Monthly P&I
- —
- Monthly cashflow
- —
- DSCR
- —
- Eligible?
- —
Short-term bridge; refi at stabilization.
Rent comps 10 comps
| Address | Beds | Baths | Sqft | Rent | $/sqft | DOM | Units | Dist |
|---|---|---|---|---|---|---|---|---|
| 210 Natchez Rd Richmond, VA | 3.0 | 1.0 | 1080 | $1,850 | $1.71 | 2d | 1 | 0.11mi |
| 315 Natchez Rd Richmond, VA | 3.0 | 1.5 | 1176 | $1,995 | $1.70 | 23d | 1 | 0.19mi |
| 120 Barker Ave Richmond, VA | 3.0 | 1.0 | 1064 | $1,597 | $1.50 | 2d | 1 | 0.77mi |
| 5951 Tiger Lily Ln Richmond, VA | 2.0–3.0 | 2.0 | 1080 | $1,375 | $1.27 | 1d | 12 | 0.86mi |
| 11 N Laburnum Ave Richmond, VA | 2.0 | 1.0 | 784 | $1,339 | $1.71 | 2d | 20 | 0.93mi |
| 400 Acreview Dr Henrico, VA | 1.0 | 1.5 | 1300 | $875 | $0.67 | 43d | 1 | 1.04mi |
| 1005 W Nine Mile Rd Henrico, VA | 2.0 | 1.0 | 783 | $1,345 | $1.72 | 43d | 1 | 1.13mi |
| 1005 W Nine Mile Rd Unit J Henrico, VA | 2.0 | 1.0 | 783 | $1,395 | $1.78 | 23d | 1 | 1.14mi |
| 500 S Laburnum Ave Richmond, VA | 3.0 | 1.5 | 1000 | $1,950 | $1.95 | 19d | 1 | 1.40mi |
| 4704 Greenleigh Rd Richmond, VA | 3.0 | 1.5 | 1188 | $2,200 | $1.85 | 15d | 1 | 1.46mi |
Listing history 3 events
-
2026-06-19status $145,000 Pending 1 DOM
-
2026-06-17remarks 270-char remark
-
2026-06-17$145,000 Active 1 DOM
ⓘ Source: listings_history table (triggers on properties + properties_extension) + one-shot
backfill from property_details.listing_events for pre-trigger history.
Tax reassessment forecast VA · Resets to sale price
- Current annual tax
- $1,280 · $107/mo
- Projected year-2 tax
- $1,280 · $107/mo
- Expected delta
- $0/yr ($0/mo · 0.0%)
ⓘ Screening estimate from a state-policy table — verify with the county assessor before closing.
Climate risk First Street
- Flood 1/10 Low FEMA zone X (unshaded) · 0% chance over 30 yrs
- Wildfire 2/10 Low
- Heat 7/10 Severe 7 d/yr ≥106°F today · 16 d/yr by 30 yrs out
- Wind 6/10 Major 27% chance of damaging wind over 30 yrs
- Air quality 2/10 Low 1 unhealthy d/yr today · 3 by 30 yrs out
Nearby sold comps map
Loading sold comps map…
Walkable amenities ~0.75 mi
Loading nearby amenities…
Taxation est. · year 1
- Rental income
- $20,676
- − Mortgage interest
- −$8,122
- − Property taxes
- −$1,280
- − Insurance
- −$725
- − Repairs & maintenance
- −$1,654
- − Management
- −$1,654
- − Depreciation
- −$4,218
- Taxable income
- $3,023
- Est. tax owed @ 24.0%
- −$726
- After-tax cash flow
- $4,479/yr
For passive investors: Depreciation is non-cash, so a rental often shows a tax loss while cash-flowing — sheltering income. Rental losses are passive: they offset passive income freely, and up to $25,000/yr can offset ordinary (W-2) income if you actively participate and your MAGI is under $100k (phasing out to $0 by $150k); unused losses carry forward. On sale, claimed depreciation is recaptured at up to 25%, and gains may owe capital-gains tax (a 1031 exchange can defer both). Figures are a year-1 estimate at your 24.0% rate — not tax advice; consult a CPA.
Schools (NCES district)
- District
- Henrico County Public School District
- NCES district ID
- 5101890
- Math proficiency
- 49% ▼ -32.00%
- Reading proficiency
- 64% ▼ -12.00%
- Median HH income
- $61,854
- Composite
- 49.25/100
- National rank
- #2031
- State rank
- #68 of 131 in VA
Livability — Highland Springs
- Score
- 72/100
- State rank
- #196
- US rank
- #6085
Category grades
Schools grade is shown separately in the Schools card above.
Census & demographics
- Census place
- Highland Springs, VA
- County
- Henrico County · 334,490 people
- City population
- 8,347
- Metro
- Richmond, VA
- Population (ZIP)
- 54,659
- Household income
- $55,731
- Rent vs Own
- Severe rent burden
- 3530.0
Population outlook (Henrico County) Hauer SSP2
- Today (2025)
- 365,885 people
- By 2030
- 384,255 · +5.0%
- By 2040
- 416,688 · +13.9%
- By 2050
- 442,376 · +20.9%
- By 2075
- 488,037 · +33.4%
- By 2100
- 487,430 · +33.2%
Race, ethnicity, and origin ACS 2023
- Neighborhood character
- Predominantly Black (71%)
- Race & ethnicity
- Black 71% White 19% Two or more races 5% Hispanic / Latino 5%
- Common ancestry
- Romanian 1% Lithuanian 1% Slovak 1%
- Foreign-born
- 4% · Canada
- Languages at home
- 93% English-only · Spanish 4% French/Haitian/Cajun 1% Other Indo-European 1%
Political lean MEDSL · Henrico
- 2024 margin
- Strong D (+28.9) · D 63.7% · R 34.8% · Other 1.5%
- 2008→2024 swing
- +16.6pp toward D · 2008: 12.2pp · 2024: 28.9pp
- All cycles
- 2024: D+28.9 2020: D+29.0 2016: D+21.0 2012: D+11.7 2008: D+12.2
Not yet ingested
- Civics
- —
Market trends
- HPI YoY
- ▼ -257.81%
- Current HPI
- 324.0589
- Rent YoY
- ▲ 6.38%
- Metro
- Richmond, VA
- State GDP YoY
- ▲ 2.40%
- F500 in state
- 50
Industry mix (Fortune 500 HQ in VA)
| Industry | F500 HQs | Revenue |
|---|---|---|
| Aerospace / Defense | 4 | $236B |
|
||
| Technology / Defense | 3 | $32B |
|
||
| Financial Services | 2 | $176B |
|
||
| Utilities | 2 | $27B |
|
||
| Insurance | 2 | $25B |
|
||
| Technology | 2 | $15B |
|
||
Price history
+163.6% since first listed5 events — show timeline
- 2026-06-16 Listed $145,000 CVRMLS
- 2023-04-25 Pending — CVRMLS
- 2023-04-25 Listing Removed — CVRMLS
- 2023-04-22 Listed $125,000 CVRMLS
- 1992-06-01 Sold (Public Records) $55,000 Public Records
Property tax history
+4.9%/yrLatest (2025): $1,280 · +14.2% YoY. Source: county tax records.
Cash-flow waterfall
monthlySold comps — $/sqft
last 12 mo · ≤1 miLoading sold comps…