104 Woodlake Ln · Lafayette, LA
Flood risk 1/10 · Minimal
- FEMA flood zone
- X (unshaded)
- Chance of flooding over 30 yrs
- 0.0%
- Est. flood insurance / yr
- $507 – $1,088
Fire risk 1/10 · Minimal
- Est. fire insurance / yr
- $1,269 – $2,357
Heat risk 9/10 · Severe
- Hot days now (above 109°F)
- 7 days/yr
- Hot days in 30 yrs
- 21 days/yr
Wind risk 9/10 · Severe
- Chance of severe wind over 30 yrs
- 99.0%
Air-quality risk 2/10 · Minimal
- Unhealthy air days now
- 0 days/yr
- Unhealthy air days in 30 yrs
- 1 days/yr
Risk factors via First Street. Map © Google.
Why this score? — see what drove the D grade
The composite is a weighted blend of 9 inputs, each scored 0–100. Each bar is that input's sub-score; the figure is the points it added to the 100-point composite (weight × sub-score).
- ARV discount +13.8/15.0
- Cash flow +9.4/30.0
- Schools +3.6/10.0
- Livability +3.5/5.0
- Rent growth +2.8/5.0
- DSCR +2.6/10.0
- Condition / age +2.5/5.0
- 1% rule +1.9/10.0
- Appreciation +0.0/10.0
$455,000
🖨 Deal sheet (PDF) 📄 Offer letter ✓ Due diligence
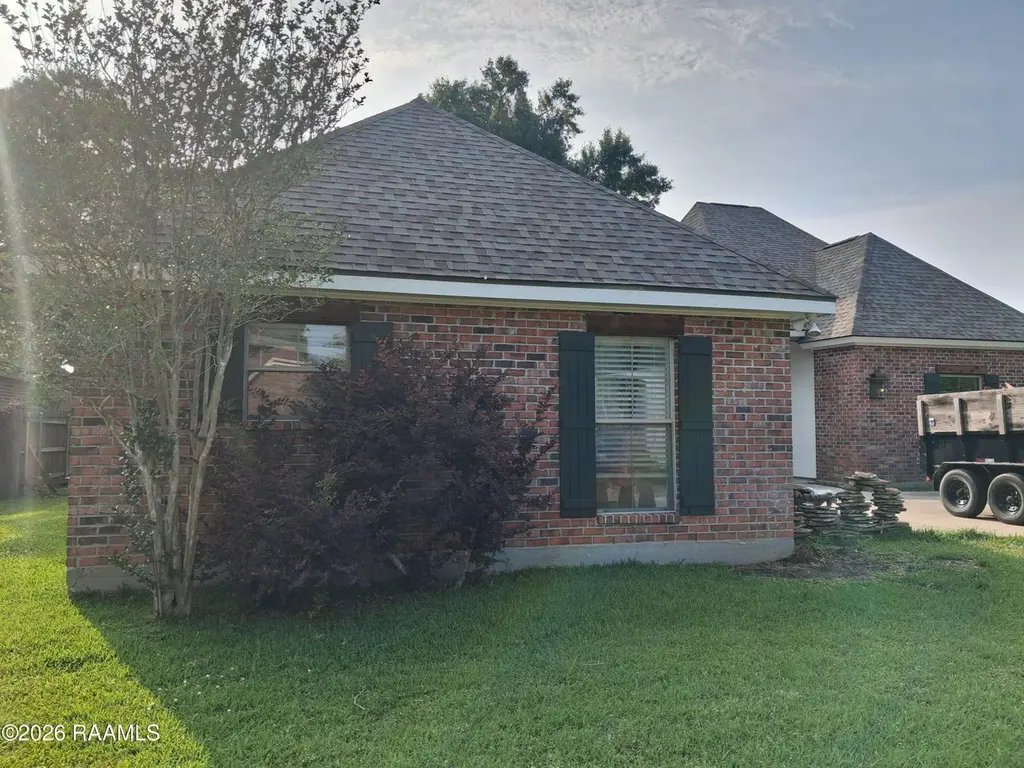
Listing remarks
Completely renovated home featuring 4 bedrooms and 3 bathrooms in a great location with high and dry, never flooded property. Roof is only 3 years old. Brand new A/C inside and out, new hot water heater, and all new appliances. Fresh paint throughout with new luxury vinyl plank flooring. Side garage offers extra parking space. A must-see!
Key facts
- 0.35 acre lot
- Garage
- Built 2001
Property features AI
Exterior
- Parking: Garage (1 covered space, total parking for 1 vehicle)
- Utilities: Public sewer; City electrical service
- Home design: Single family residence; City street frontage
- Construction: Brick veneer and HardiPlank/wood frame construction; Composition roof
- Exterior features: Covered patio/porch; Full wood fencing; Exterior lighting
Interior
- Kitchen: Dishwasher; Gas cooktop; Microwave; Granite counters
- Flooring: Tile; Vinyl plank
- Bathrooms: Three full bathrooms
- Heating & cooling: Central heating; Central air conditioning
- Interior features: Separate shower; Granite counters; Double pane windows; Lighting (exterior lighting noted)
- Laundry & utility: Washer hookup; Electric dryer hookup
Neighborhood map
What this means for you Summary
Snapshot
- This is a 4-bed/3.0-bath single-family listed at $455k.
Deal economics
- At list price, monthly cash flow is $-327 ($-4k/yr) — negative.
- To cash-flow at today's rent, offer at most $397k (12.7% below list).
- To meet the 1% rule (rent ≥ 1% of price), the offer needs to be $315k (30.8% below list).
- Recommended offer: $315k (30.8% below list) — sets the bar for 1% rule.
Location & tenants
- Location reads 70/100 on livability (#63 in LA) — a middle-class / working-renter tenant base. Strengths: cost of living A+, housing A+, health & safety A+; Watch: amenities C-, employment C-, crime F.
- Lafayette Parish (urban): math 38% / reading 46% proficiency, ranked #19 of 98 in LA (top 19%) — families likely to look elsewhere, expect single-tenant / working-renter base with shorter leases.
- Zoned schools: J. Wallace James Elementary School (math 46% / reading 49%, grade D, #147 of 646 statewide, top 23%, 939 students, 64% FRL); Broussard Middle School (math 38% / reading 51%, grade D, #49 of 218 statewide, top 23%, 581 students, 60% FRL); O. Comeaux High School (math 38% / reading 40%, grade F, #86 of 265 statewide, top 33%, 1,098 students, 56% FRL) — zoned schools at 60% FRL track the district average.
- Market conditions: Rents rising (+1.2%/yr); 473 active listings in the ZIP; 10 comparable units currently listed for rent nearby; rentals lingering (median 46d on market — plan ~5-8 weeks vacancy on turnover, expect pricing pressure); 70% of comp listings sitting > 30 days — soft ceiling on asking rent; solid renter incomes; 1,585 units permitted in Lafayette Parish in 2024 (10 in 5+ unit buildings).
- This rent runs 44% of the median local income ($86k/yr) — at the standard rent-burdened threshold; future hikes will face affordability resistance.
Forward outlook
- Local home prices are declining (-3.0%/yr); year-one equity from $3k of loan paydown is wiped out by about $14k of value loss. Plan a longer hold.
- Lafayette County population projected at +34% by 2050 — long-run rental-demand tailwind backs the buy-and-hold thesis.
Negotiation context
- Only 1 days on market — expect competitive offers; lowballing is unlikely to land.
Risks & watch-outs
- Climate carrying-cost: severe wind risk, 99% chance of damaging wind over 30y; extreme-heat days projected 7→21/yr by 2055 (HVAC capex compounding) — expect insurance premiums to compound above CPI over the hold.
Questions for the listing agent
- What do current leases actually rent for vs. the listed asking? Can we see a recent rent roll and the last 12 months of T-12 income?
- Is there a deadline driving the sale (1031 exchange, divorce, estate, relocation)? That informs how much negotiation room exists.
- Schools are B-rated — typically a magnet for longer-tenancy family renters. What's the average tenant stay here, and is there a school-zone premium baked into asking?
- Crime grade is F in this area — have there been break-ins, vandalism, or insurance claims at this property in the last 3 years? What carrier currently insures it and at what premium?
- The area grade is low — what's the realistic commute time and amenity access for the typical tenant pool here? Any planned neighborhood developments (good or bad) we should know about?
- What's the average days-on-market for RENTAL listings here right now (not sales)? A rising rental-DOM trend means longer vacancies and softer asking-rent achievability than the comps imply.
- What's the recent tenant-quality profile in this submarket — average credit score on applications, eviction rate, late-payment / NSF rate, and stable-employment percentage? A property-management company in the area should have these aggregated.
- How much new for-sale + rental construction is in the pipeline within 1–3 miles? Heavy new supply typically softens prices + rents 12–24 months out; constrained supply supports both.
Investment metrics
- 1% rule
- 0.69% ✗
- Cap rate
- 5.43%
- Cash-on-cash
- -3.08%
- DSCR
- 0.86
- GRM
- 12.1
CMA / ARV
- ARV (median comp)
- $529,657
- List price
- $455,000
- Delta
- -14.10%
- Verdict
- UNDERPRICED
- Comps
- 20 within 1.0 mi
Show comp detail 12 sales within ~0.75 mi
| Address | Dist | Beds/Ba | Sqft | Sold | Price | $/sf | Match |
|---|---|---|---|---|---|---|---|
| 120 Greenfarm Rd | 0.18mi | 4/2.5 | 2,568 (-6%) | 2mo | $420,000 | $164 | 77 |
| 108 Little Hickory Ct | 0.29mi | 4/3.0 | 2,609 (-5%) | 2mo | $655,000 | $251 | 77 |
| 301 Timberwood Cir | 0.31mi | 4/3.5 | 2,974 (+8%) | 2mo | $482,000 | $162 | 68 |
| 103 Timber Hollow Ln | 0.43mi | 4/3.0 | 2,532 (-8%) | 1mo | $625,000 | $247 | 66 |
| 102 N Michot Rd | 0.31mi | 4/3.0 | 3,064 (+12%) | 1mo | $348,000 | $114 | 65 |
| 202 Trailwood Ln | 0.34mi | 5/3.0 (+1) | 3,000 (+9%) | 1mo | $495,000 | $165 | 63 |
| 201 Barkhill Dr | 0.64mi | 4/3.0 | 2,589 (-6%) | 1mo | $499,900 | $193 | 60 |
| 110 Fernridge Dr | 0.71mi | 3/3.0 (-1) | 2,756 (+0%) | 1mo | $630,000 | $229 | 60 |
| 502 Queensberry Dr | 0.64mi | 4/3.0 | 2,488 (-9%) | 2mo | $547,000 | $220 | 53 |
| 108 Fernridge Dr | 0.70mi | 3/4.0 (-1) | 2,644 (-4%) | 1mo | $535,000 | $202 | 51 |
| 111 Bancroft Dr | 0.67mi | 4/3.0 | 2,458 (-10%) | 1mo | $555,000 | $226 | 51 |
| 103 Failla Rd | 0.53mi | 5/3.0 (+1) | 2,372 (-14%) | 1mo | $372,000 | $157 | 47 |
Match score weights: distance 35% · size 25% · config 20% · recency 20%. Top-matched comps best support the ARV.
Projected returns pro-forma
-3.0% appreciation · 1.23% rent growth · sell at horizon
- IRR
- -23.2%
- Equity multiple
- 0.21×
- Total profit
- $-100,206
- Equity at exit
- $67,842
- IRR
- -22.8%
- Equity multiple
- -0.07×
- Total profit
- $-136,499
- Equity at exit
- $39,340
Cash invested: $127,400 (down + closing). Projections, not guarantees.
Landlord ↔ Tenant lean methodology
- Overall (STATE)
- 90 Strongly Landlord-Friendly
- State Louisiana
- 90 Strongly Landlord-Friendly · R+12
- County
- — inherits STATE
- City
- — inherits STATE
ZIP-level market 70508
- Home prices YoY
- -34.7%
- Rents YoY
- 1.2%
- Active inventory
- 473
- Price-to-rent
- 12.1×
Monthly cashflow live
- Estimated rent
- $3,146 high interval (Pro) →
- Mortgage (P&I)
- −$2,386
- Tax from tax record
- −$237 /mo · $2,842/yr
- Insurance
- −$190
- HOA
- −$0
- Vacancy / Maint / Mgmt
- −$661
- Net cashflow
- $-327
Break-even live
Sensitivity live
| Price | -10% $-69 | -5% $-198 | +0% $-327 | +5% $-456 | +10% $-584 |
|---|---|---|---|---|---|
| Rent | -10% $-575 | -5% $-451 | +0% $-327 | +5% $-202 | +10% $-78 |
| Rate | -1.0pp $-98 | -0.5pp $-211 | base $-327 | +0.5pp $-445 | +1.0pp $-565 |
UW: 25.0% down · 7.5% · 30yr · 1.5% tax · 5.0% vac · 8.0% maint · 8.0% mgmt
Financing live
Cash to close
- Down payment
- $113,750
- Closing costs
- $13,650
- Reserves months
- —
- Total cash needed
- —
Loan-product check · same deal, 3 products live
Conventional
25% down · 7.5% · 30yr
- Down + closing
- —
- Monthly P&I
- —
- Monthly cashflow
- —
- DSCR
- —
- Eligible?
- —
Personal DTI + credit; lowest rate.
DSCR
20% down · 8.5% · 30yr
- Down + closing
- —
- Monthly P&I
- —
- Monthly cashflow
- —
- DSCR
- —
- Eligible?
- —
No personal income docs; deal must DSCR.
Hard money
10% down · 12.0% · 12mo
- Down + closing
- —
- Monthly P&I
- —
- Monthly cashflow
- —
- DSCR
- —
- Eligible?
- —
Short-term bridge; refi at stabilization.
Rent comps 10 comps
| Address | Beds | Baths | Sqft | Rent | $/sqft | DOM | Units | Dist |
|---|---|---|---|---|---|---|---|---|
| 102 Orchard Park Ave Lafayette, LA | 4.0 | 3.0 | 2464 | $4,200 | $1.70 | 15d | 1 | 0.28mi |
| 128 Pigeon Loop Lafayette, LA | 4.0 | 3.0 | 2700 | $2,200 | $0.81 | 15d | 1 | 0.90mi |
| 406 E Martial Ave Lafayette, LA | 4.0 | 2.0 | 2017 | $5,000 | $2.48 | 45d | 1 | 1.08mi |
| 202 Student Ln Lafayette, LA | 4.0 | 2.0 | 2017 | $4,000 | $1.98 | 45d | 1 | 1.08mi |
| 204 Student Ln Lafayette, LA | 3.0 | 2.0 | 1976 | $3,500 | $1.77 | 45d | 1 | 1.09mi |
| 207 Summerland Key Ln Lafayette, LA | 4.0 | 3.0 | 2018 | $2,350 | $1.16 | 46d | 1 | 1.10mi |
| 404 E Martial Ave Lafayette, LA | 4.0 | 2.0 | 2017 | $4,000 | $1.98 | 45d | 1 | 1.11mi |
| 115 La Rue Vil Lafayette, LA | 3.0 | 2.0 | 1860 | $1,900 | $1.02 | 46d | 1 | 1.17mi |
| 104 Avalon St Lafayette, LA | 3.0 | 2.0 | 1895 | $1,800 | $0.95 | 45d | 1 | 1.23mi |
| 13 Heatherstone Dr Lafayette, LA | 3.0 | 2.0 | 1995 | $2,800 | $1.40 | 23d | 1 | 1.40mi |
Listing history 12 events
-
2026-06-13statusdays on market $455,000 Active 1 DOM
-
2026-06-10days on market $455,000 Coming Soon 29 DOM
-
2026-06-09days on market $455,000 Coming Soon 28 DOM
-
2026-06-08days on market $455,000 Coming Soon 27 DOM
-
2026-06-07days on market $455,000 Coming Soon 26 DOM
-
2026-06-05days on market $455,000 Coming Soon 23 DOM
-
2026-06-03days on market $455,000 Coming Soon 22 DOM
-
2026-06-02days on market $455,000 Coming Soon 21 DOM
-
2026-06-01days on market $455,000 Coming Soon 20 DOM
-
2026-05-31days on market $455,000 Coming Soon 19 DOM
-
2026-05-30days on market $455,000 Coming Soon 18 DOM
-
2026-05-12historical $455,000 340-char remark
ⓘ Source: listings_history table (triggers on properties + properties_extension) + one-shot
backfill from property_details.listing_events for pre-trigger history.
Tax reassessment forecast LA · Resets to sale price
- Current annual tax
- $2,842 · $237/mo
- Projected year-2 tax
- $2,842 · $237/mo
- Expected delta
- $0/yr ($0/mo · 0.0%)
ⓘ Screening estimate from a state-policy table — verify with the county assessor before closing.
Climate risk First Street
- Flood 1/10 Low FEMA zone X (unshaded) · 0% chance over 30 yrs
- Wildfire 1/10 Low
- Heat 9/10 Extreme 7 d/yr ≥109°F today · 21 d/yr by 30 yrs out
- Wind 9/10 Extreme 99% chance of damaging wind over 30 yrs
- Air quality 2/10 Low 0 unhealthy d/yr today · 1 by 30 yrs out
Nearby sold comps map
Loading sold comps map…
Walkable amenities ~0.75 mi
Loading nearby amenities…
Taxation est. · year 1
- Rental income
- $37,757
- − Mortgage interest
- −$25,487
- − Property taxes
- −$2,842
- − Insurance
- −$2,275
- − Repairs & maintenance
- −$3,021
- − Management
- −$3,021
- − Depreciation
- −$13,236
- Taxable loss
- −$12,124
- Est. tax savings @ 24.0%
- +$2,910
- After-tax cash flow
- $-1,012/yr
For passive investors: Depreciation is non-cash, so a rental often shows a tax loss while cash-flowing — sheltering income. Rental losses are passive: they offset passive income freely, and up to $25,000/yr can offset ordinary (W-2) income if you actively participate and your MAGI is under $100k (phasing out to $0 by $150k); unused losses carry forward. On sale, claimed depreciation is recaptured at up to 25%, and gains may owe capital-gains tax (a 1031 exchange can defer both). Figures are a year-1 estimate at your 24.0% rate — not tax advice; consult a CPA.
Schools (NCES district)
- District
- Lafayette Parish
- NCES district ID
- 2200870
- Math proficiency
- 38% ▼ -32.00%
- Reading proficiency
- 46% ▼ -24.00%
- Median HH income
- $50,238
- Composite
- 36.15/100
- National rank
- #4741
- State rank
- #19 of 98 in LA
Livability — Lafayette
- Score
- 70/100
- State rank
- #63
- US rank
- #8133
Category grades
Schools grade is shown separately in the Schools card above.
Census & demographics
- Census place
- Lafayette, LA
- County
- Lafayette Parish · 207,544 people
- City population
- 158,114
- Metro
- Lafayette, LA
- Population (ZIP)
- 40,592
- Household income
- $86,005
- Rent vs Own
- Severe rent burden
- 1860.0
Population outlook (Lafayette County) Hauer SSP2
- Today (2025)
- 280,930 people
- By 2030
- 301,092 · +7.2%
- By 2040
- 339,456 · +20.8%
- By 2050
- 375,156 · +33.5%
- By 2075
- 451,672 · +60.8%
- By 2100
- 497,203 · +77.0%
Race, ethnicity, and origin ACS 2023
- Neighborhood character
- Predominantly White (75%)
- Race & ethnicity
- White 75% Black 13% Two or more races 7% Hispanic / Latino 5% Asian 3%
- Common ancestry
- Lithuanian 20% Slovak 2% Italian 1%
- Foreign-born
- 5% · Canada, China
- Languages at home
- 91% English-only · Spanish 3% French/Haitian/Cajun 2% Other Indo-European 1%
Political lean MEDSL · Lafayette
- 2024 margin
- Solid R (+31.4) · D 33.5% · R 64.8% · Other 1.7%
- 2008→2024 swing
- -0.1pp no change · 2008: -31.3pp · 2024: -31.4pp
- All cycles
- 2024: R+31.4 2020: R+28.7 2016: R+33.6 2012: R+33.7 2008: R+31.3
Not yet ingested
- Civics
- —
Market trends
- HPI YoY
- ▼ -76.28%
- Current HPI
- 143.6305
- Rent YoY
- ▲ 1.23%
- Metro
- Lafayette, LA
- State GDP YoY
- ▲ 3.29%
- F500 in state
- 10
Industry mix (Fortune 500 HQ in LA)
| Industry | F500 HQs | Revenue |
|---|---|---|
| Telecommunications | 2 | $23B |
|
||
| Utilities | 1 | $12B |
|
||
| Wholesale / Distribution | 1 | $5B |
|
||
| Advertising | 1 | $2B |
|
||
Price history
2 events — show timeline
- 2026-06-12 Listed $455,000 AcadianaMLS
- 2026-05-12 Coming Soon — AcadianaMLS
Property tax history
+5.3%/yrLatest (2025): $2,842 · -1.1% YoY. Source: county tax records.
Cash-flow waterfall
monthlySold comps — $/sqft
last 12 mo · ≤1 miLoading sold comps…