 Multi-family
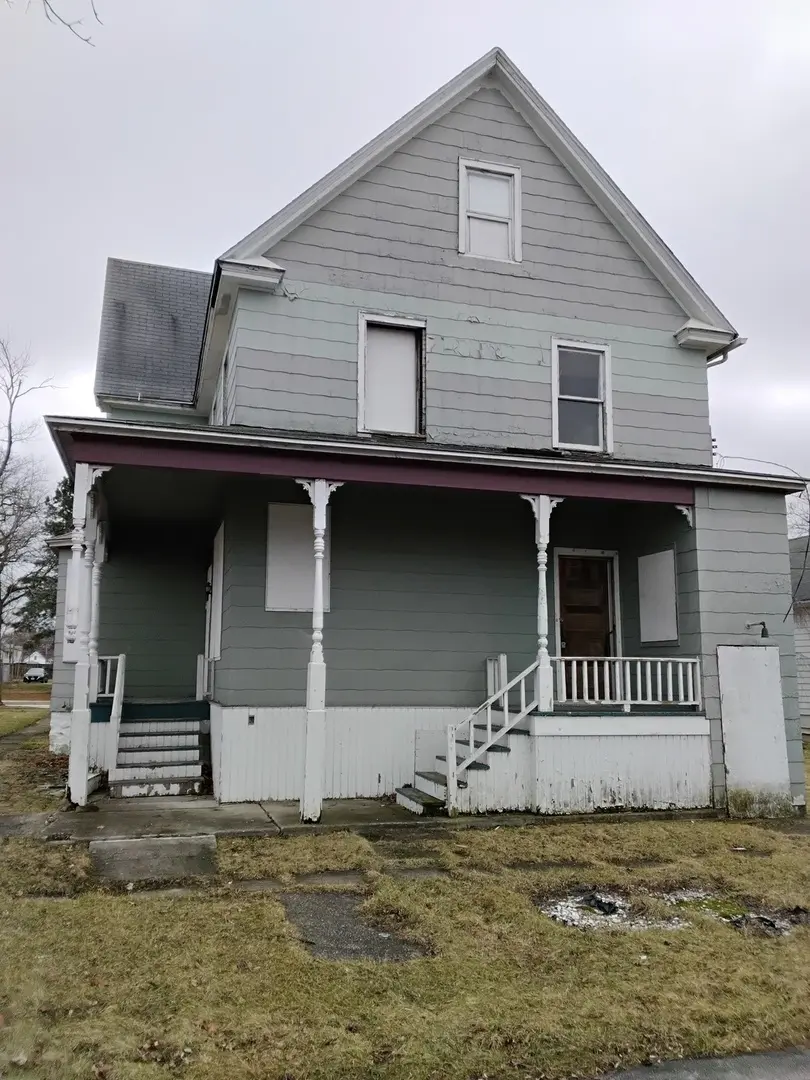
3704 214th Pl · Matteson, IL
Flood risk 1/10 · Minimal
- FEMA flood zone
- X (unshaded)
- Chance of flooding over 30 yrs
- 0.0%
- Est. flood insurance / yr
- $507 – $1,088
Fire risk 1/10 · Minimal
- Est. fire insurance / yr
- $804 – $1,492
Heat risk 3/10 · Minor
- Hot days now (above 101°F)
- 7 days/yr
- Hot days in 30 yrs
- 16 days/yr
Wind risk 2/10 · Minimal
- Chance of severe wind over 30 yrs
- —
Air-quality risk 2/10 · Minimal
- Unhealthy air days now
- 1 days/yr
- Unhealthy air days in 30 yrs
- 1 days/yr
Risk factors via First Street. Map © Google.
Why this score? — see what drove the B- grade
The composite is a weighted blend of 9 inputs, each scored 0–100. Each bar is that input's sub-score; the figure is the points it added to the 100-point composite (weight × sub-score).
- Cash flow +30.0/30.0
- 1% rule +10.0/10.0
- DSCR +10.0/10.0
- ARV discount +7.5/15.0
- Livability +3.4/5.0
- Rent growth +2.5/5.0
- Condition / age +2.5/5.0
- Schools +0.9/10.0
- Appreciation +0.0/10.0
$92,000
🖨 Deal sheet 📄 Offer letter ✓ Due diligence
Multi-family units
County records classify this as Multi-Family (2-4 Unit). Listing-text estimate: 1 unit. estimate disagrees with records
Listing remarks
This is a large two-story single-family home with more space than you'd expect. Inside, you'll find extra rooms, original woodwork, and hardwood floors that could really shine again. Although the home requires updates, it presents an ideal project for investors or owner occupants looking to restore a property and contribute to neighborhood revitalization. Bring your vision and be part of transforming this home into a valuable addition to the community. Be advised of the following: This is an AS-IS sale, all rooms/lot/dimension sizes are estimated, no termite, no survey provided, buyer responsible for all municipal repairs, and the property has to be listed for 10 days before any offers are
Key facts
- 2 garage spots
- Built 1901
- Listed 58 days
Property features AI
Finance
- Other: Possession at closing
- HOA & community: No master association fees required
Exterior
- Parking: Detached garage (2 garage spaces, 2 total parking spaces)
- Utilities: Public water; Public sewer
- Home design: Detached single-family home; 2 stories; Fee simple ownership; Built more than 100 years ago; Contains materials framed construction; Built before 1978
- Construction: Frame construction
- Exterior features: Lot less than 0.25 acre; Lot dimensions: 6600
Interior
- Kitchen: Kitchen on the main level (approx. 12 x 8); Pantry (approx. 5 x 4)
- Bedrooms: 3 bedrooms; Master bedroom on the main level (approx. 11 x 11); Second and third bedrooms on the second level (approx. 9 x 8 and 11 x 18)
- Bathrooms: 2 full bathrooms
- Heating & cooling: Radiant heating
- Interior features: 7 total rooms; Unfinished full basement
- Laundry & utility: Laundry room (level not specified)
Neighborhood map
What this means for you Summary
Snapshot
- This is a 4-bed/2.0-bath multifamily listed at $92k.
Deal economics
- At list price, monthly cash flow is $1k ($17k/yr) — positive.
- The deal already cash-flows at list — no discount required.
- Meets the 1% rule at list price ($3k rent vs $92k).
- Recommended offer: $89k (3.0% below list) — sets the bar for market timing.
- Cap rate 25.2% vs local median 6.2% in Matteson — top-decile yield for the area; either an underpriced asset or a hidden risk that comps aren't pricing in. Stress-test before assuming the spread holds.
Location & tenants
- Location reads 67/100 on livability (#525 in IL) — a middle-class / working-renter tenant base. Strengths: employment A+, housing A+, cost of living A; Watch: schools D+, amenities F, commute F.
- Rich Twp Hsd 227 (suburban): math 5% / reading 12% proficiency, ranked #577 of 620 in IL (top 93%) — low school quality limits family demand, transient renter base, plan for 1-2y turnover.
- Market conditions: 69 active listings in the ZIP; 2 comparable units currently listed for rent nearby; 6,272 units permitted in Cook County in 2024 (4,658 in 5+ unit buildings).
Forward outlook
- Local home prices are declining (-3.0%/yr); year-one equity from $636 of loan paydown is wiped out by about $3k of value loss. Plan a longer hold.
- At projected returns (-3.0% appreciation + 3.0% rent growth), your $26k cash investment doubles in ~2 years — after that, you're playing with house money.
Negotiation context
- It's been on market 58 days — a 3% lower offer ($89k) is reasonable based on typical stale-listing flexibility.
Risks & watch-outs
- Watch-outs: built in 1901 — expect roof / HVAC / electrical / plumbing capex.
Questions for the listing agent
- It's been on market 58 days. Have you received any prior offers? Is the seller open to a 3% concession, seller financing, or rate buy-down credit?
- Built in 1901 — when were the roof, HVAC, electrical panel, plumbing, and water heater last replaced?
- Is there a deadline driving the sale (1031 exchange, divorce, estate, relocation)? That informs how much negotiation room exists.
- Schools are D-rated, which usually means shorter tenancies and higher turnover. Who's the typical renter profile here, and what's been the actual vacancy rate?
- What's the average days-on-market for RENTAL listings here right now (not sales)? A rising rental-DOM trend means longer vacancies and softer asking-rent achievability than the comps imply.
- What's the recent tenant-quality profile in this submarket — average credit score on applications, eviction rate, late-payment / NSF rate, and stable-employment percentage? A property-management company in the area should have these aggregated.
- How much new apartment / multifamily construction is in the pipeline within 1–3 miles? Heavy new supply (>2% of stock underway) typically softens rents 12–24 months out; light construction supports rent growth.
Investment metrics
- 1% rule
- 2.86% ✓
- Cap rate
- 25.15%
- Cash-on-cash
- 67.35%
- DSCR
- 4.00
- GRM
- 2.9
CMA / ARV
No comps found within radius.
Projected returns pro-forma
-3.0% appreciation · 3.0% rent growth · sell at horizon
- IRR
- 66.7%
- Equity multiple
- 4.00×
- Total profit
- $77,217
- Equity at exit
- $13,717
- IRR
- 70.9%
- Equity multiple
- 8.22×
- Total profit
- $185,976
- Equity at exit
- $7,954
Cash invested: $25,760 (down + closing). Projections, not guarantees.
Landlord ↔ Tenant lean methodology
- Overall (STATE)
- 43 Moderately Tenant-Leaning
- State Illinois
- 43 Moderately Tenant-Leaning · D+7
- County
- — inherits STATE
- City
- — inherits STATE
ZIP-level market 60443
- Home prices YoY
- -32.6%
- Active inventory
- 69
- Price-to-rent
- 2.9×
Monthly cashflow live
- Estimated rent
- $2,635 medium interval (Pro) →
- Mortgage (P&I)
- −$482
- Tax est. 1.5%
- −$115 /mo · $1,380/yr
- Insurance
- −$38
- HOA
- −$0
- Vacancy / Maint / Mgmt
- −$553
- Net cashflow
- $1,446
Break-even live
UW: 25.0% down · 7.5% · 30yr · 1.5% tax · 5.0% vac · 8.0% maint · 8.0% mgmt
Financing live
Cash to close
- Down payment
- $23,000
- Closing costs
- $2,760
- Reserves months
- —
- Total cash needed
- —
Loan-product check · same deal, 3 products live
Conventional
25% down · 7.5% · 30yr
- Down + closing
- —
- Monthly P&I
- —
- Monthly cashflow
- —
- DSCR
- —
- Eligible?
- —
Personal DTI + credit; lowest rate.
DSCR
20% down · 8.5% · 30yr
- Down + closing
- —
- Monthly P&I
- —
- Monthly cashflow
- —
- DSCR
- —
- Eligible?
- —
No personal income docs; deal must DSCR.
Hard money
10% down · 12.0% · 12mo
- Down + closing
- —
- Monthly P&I
- —
- Monthly cashflow
- —
- DSCR
- —
- Eligible?
- —
Short-term bridge; refi at stabilization.
Rent comps 2 comps
| Address | Beds | Baths | Sqft | Rent | $/sqft | DOM | Units | Dist |
|---|---|---|---|---|---|---|---|---|
| 21015 London Dr Olympia Fields, IL | 4.0 | 3.0 | 2700 | $3,200 | $1.19 | 1d | 1 | 1.17mi |
| 4200 Arlington Dr Richton Park, IL | 3.0 | 2.0 | 1595 | $2,061 | $1.29 | 19d | 1 | 1.17mi |
Listing history 15 events
-
2026-06-18days on market $92,000 Active 58 DOM
-
2026-06-17days on market $92,000 Active 57 DOM
-
2026-06-16days on market $92,000 Active 56 DOM
-
2026-06-15days on market $92,000 Active 55 DOM
-
2026-06-13days on market $92,000 Active 53 DOM
-
2026-06-09days on market $92,000 Active 49 DOM
-
2026-06-08days on market $92,000 Active 48 DOM
-
2026-06-07days on market $92,000 Active 47 DOM
-
2026-06-04days on market $92,000 Active 44 DOM
-
2026-06-03days on market $92,000 Active 43 DOM
-
2026-06-02days on market $92,000 Active 42 DOM
-
2026-06-01days on market $92,000 Active 41 DOM
-
2026-05-31days on market $92,000 Active 40 DOM
-
2026-04-20$92,000 Active
-
2000-05-16soldstatus $103,000
ⓘ Source: listings_history table (triggers on properties + properties_extension) + one-shot
backfill from property_details.listing_events for pre-trigger history.
Climate risk First Street
- Flood 1/10 Low FEMA zone X (unshaded) · 0% chance over 30 yrs
- Wildfire 1/10 Low
- Heat 3/10 Moderate 7 d/yr ≥101°F today · 16 d/yr by 30 yrs out
- Wind 2/10 Low
- Air quality 2/10 Low 1 unhealthy d/yr today · 1 by 30 yrs out
Nearby sold comps map
Loading sold comps map…
Walkable amenities ~0.75 mi
Loading nearby amenities…
Taxation est. · year 1
- Rental income
- $31,620
- − Mortgage interest
- −$5,153
- − Property taxes
- −$1,380
- − Insurance
- −$460
- − Repairs & maintenance
- −$2,530
- − Management
- −$2,530
- − Depreciation
- −$2,676
- Taxable income
- $16,891
- Est. tax owed @ 24.0%
- −$4,054
- After-tax cash flow
- $13,296/yr
For passive investors: Depreciation is non-cash, so a rental often shows a tax loss while cash-flowing — sheltering income. Rental losses are passive: they offset passive income freely, and up to $25,000/yr can offset ordinary (W-2) income if you actively participate and your MAGI is under $100k (phasing out to $0 by $150k); unused losses carry forward. On sale, claimed depreciation is recaptured at up to 25%, and gains may owe capital-gains tax (a 1031 exchange can defer both). Figures are a year-1 estimate at your 24.0% rate — not tax advice; consult a CPA.
Schools (NCES district)
- District
- Rich Twp Hsd 227
- NCES district ID
- 1733420
- Math proficiency
- 5% ▼ -3.00%
- Reading proficiency
- 12% ▬ 0.00%
- Median HH income
- $56,056
- Composite
- 8.93/100
- National rank
- #9885
- State rank
- #577 of 620 in IL
Livability — Matteson
- Score
- 67/100
- State rank
- #525
- US rank
- #10883
Category grades
Schools grade is shown separately in the Schools card above.
Census & demographics
- Census place
- Matteson, IL
- City population
- 20,606
- Population (ZIP)
- 20,606
Population outlook (Cook County) Hauer SSP2
- Today (2025)
- 5,347,519 people
- By 2030
- 5,357,703 · +0.2%
- By 2040
- 5,324,924 · -0.4%
- By 2050
- 5,230,762 · -2.2%
- By 2075
- 4,785,735 · -10.5%
- By 2100
- 4,188,836 · -21.7%
Race, ethnicity, and origin ACS 2023
- Neighborhood character
- Predominantly Black (72%)
- Race & ethnicity
- Black 72% White 18% Two or more races 6% Hispanic / Latino 5% Asian 1%
- Hispanic origin (detail)
- Mexican 4%
- Common ancestry
- Romanian 2%
- Foreign-born
- 4% · Canada
- Languages at home
- 94% English-only · Spanish 4%
Political lean MEDSL · Cook
- 2024 margin
- Solid D (+42.0) · D 70.4% · R 28.4% · Other 1.2%
- 2008→2024 swing
- -11.4pp toward R · 2008: 53.4pp · 2024: 42.0pp
- All cycles
- 2024: D+42.0 2020: D+50.3 2016: D+53.0 2012: D+49.4 2008: D+53.4
Not yet ingested
- Civics
- —
Market trends
- HPI YoY
- ▼ -89.68%
- Current HPI
- 185.4404
- Rent YoY
- —
- Metro
- —
- State GDP YoY
- ▲ 1.59%
- F500 in state
- 60
Industry mix (Fortune 500 HQ in IL)
| Industry | F500 HQs | Revenue |
|---|---|---|
| Insurance | 4 | $201B |
|
||
| Consumer Goods | 4 | $87B |
|
||
| Industrial Machinery | 3 | $64B |
|
||
| Healthcare | 2 | $55B |
|
||
| Retail / Pharmacy | 1 | $148B |
|
||
| Agriculture / Food | 1 | $86B |
|
||
Price history
-10.7% since first listed2 events — show timeline
- 2026-04-20 Listed $92,000 MRED as Distributed by MLS Grid
- 2000-05-16 Sold (Public Records) $103,000 Public Records
Property tax history
+3.7%/yrLatest (2023): $6,069 · +15.8% YoY. Source: county tax records.
Cash-flow waterfall
monthlySold comps — $/sqft
last 12 mo · ≤1 miLoading sold comps…