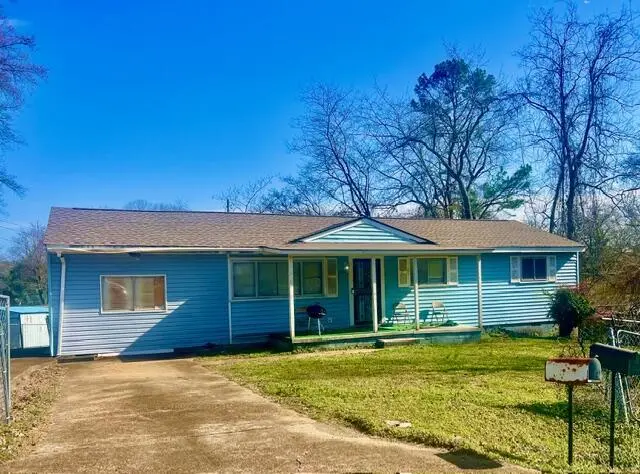
1608 Monterey Dr · Chattanooga, TN
Flood risk 1/10 · Minimal
- FEMA flood zone
- X (unshaded)
- Chance of flooding over 30 yrs
- 0.0%
- Est. flood insurance / yr
- $507 – $1,088
Fire risk 3/10 · Minor
- Est. fire insurance / yr
- $949 – $1,763
Heat risk 6/10 · Moderate
- Hot days now (above 105°F)
- 7 days/yr
- Hot days in 30 yrs
- 19 days/yr
Wind risk 4/10 · Minor
- Chance of severe wind over 30 yrs
- 10.0%
Air-quality risk 3/10 · Minor
- Unhealthy air days now
- 2 days/yr
- Unhealthy air days in 30 yrs
- 2 days/yr
Risk factors via First Street. Map © Google.
Why this score? — see what drove the D+ grade
The composite is a weighted blend of 9 inputs, each scored 0–100. Each bar is that input's sub-score; the figure is the points it added to the 100-point composite (weight × sub-score).
- Cash flow +15.5/30.0
- ARV discount +15.0/15.0
- DSCR +4.8/10.0
- Livability +3.9/5.0
- 1% rule +2.9/10.0
- Rent growth +2.7/5.0
- Schools +2.7/10.0
- Condition / age +2.5/5.0
- Appreciation +0.0/10.0
$194,000
🖨 Deal sheet (PDF) 📄 Offer letter ✓ Due diligence
Listing remarks
Do not miss this three bedroom one and a half bath home on a nice fenced lot. You will love the space in the large living room, den and separate dining room. .Home has a new roof and electric panel. Great investment opportunity.
Key facts
- Electric panel
- Fenced lot
- New roof
Tags
Property features AI
Exterior
- Parking: Off-street parking
- Utilities: Public water; Public sewer; Electricity connected; Phone available
- Home design: Single-family home; One story; Block foundation; Shingle roof; Residential property
- Construction: Built with other construction materials; Block foundation
- Exterior features: Covered porch; Fenced yard; Gentle sloping lot; Public maintained road
Interior
- Kitchen: Refrigerator; Free-standing electric range; Free-standing electric oven; Electric water heater
- Flooring: Hardwood; No flooring specified in some areas
- Bathrooms: 2 full bathrooms
- Heating & cooling: Central heating; Central air conditioning
- Interior features: Ceiling fans
- Laundry & utility: Washer hookup; Washer/dryer hookups for both electric and gas dryer; Laundry closet
Neighborhood map
What this means for you Summary
Snapshot
- This is a 3-bed/2.0-bath single-family listed at $194k.
Deal economics
- At list price, monthly cash flow is $78 ($933/yr) — positive.
- The deal already cash-flows at list — no discount required.
- To meet the 1% rule (rent ≥ 1% of price), the offer needs to be $154k (20.7% below list).
- Recommended offer: $154k (20.7% below list) — sets the bar for 1% rule.
- Cap rate 6.8% vs local median 3.4% in Chattanooga — top-decile yield for the area; either an underpriced asset or a hidden risk that comps aren't pricing in. Stress-test before assuming the spread holds.
Location & tenants
- Location reads 78/100 on livability (#3 in TN, #2,582 nationally) — a middle-class / working-renter tenant base. Strengths: amenities A+, commute A+, cost of living A+; Watch: employment D+, crime F.
- Hamilton County (urban): math 31% / reading 31% proficiency, ranked #42 of 139 in TN (top 30%) — families likely to look elsewhere, expect single-tenant / working-renter base with shorter leases.
- Zoned schools: Hardy Elementary School (math 8% / reading 2%, grade F, #896 of 952 statewide, top 96%, 435 students, 0% FRL); Dalewood Middle School (math 7% / reading 7%, grade F, #278 of 333 statewide, top 85%, 258 students, 0% FRL); Brainerd High School (math 2% / reading 12%, grade F, #294 of 332 statewide, top 91%, 635 students, 0% FRL) — zoned schools average 0% FRL vs 52% district-wide (52 pts lower); this property's tenant base skews higher-income than the district average.
- Zoned-school proficiency averages 6% at this address vs 31% district-wide (-25 pts) — the specific schools serving this property underperform the Hamilton County average; the district grade overstates school quality for this exact location.
- Market conditions: Rents flat; 129 active listings in the ZIP; 29 comparable units currently listed for rent nearby; rentals at typical pace (median 23d on market — plan ~3-4 weeks tenant-placement turnaround); 2,133 units permitted in Hamilton County in 2024 (405 in 5+ unit buildings).
- This rent runs 33% of the median local income ($57k/yr) — at the standard rent-burdened threshold; future hikes will face affordability resistance.
Forward outlook
- Local home prices are declining (-3.0%/yr); year-one equity from $1k of loan paydown is wiped out by about $6k of value loss. Plan a longer hold.
- Hamilton County population projected at +23% by 2050 — long-run rental-demand tailwind backs the buy-and-hold thesis.
Negotiation context
- It's been on market 121 days — a 12% lower offer ($171k) is reasonable based on typical stale-listing flexibility.
Risks & watch-outs
- Watch-outs: built in 1959 — expect roof / HVAC / electrical / plumbing capex.
- Climate carrying-cost: extreme-heat days projected 7→19/yr by 2055 (HVAC capex compounding) — expect insurance premiums to compound above CPI over the hold.
Questions for the listing agent
- It's been on market 121 days. Have you received any prior offers? Is the seller open to a 21% concession, seller financing, or rate buy-down credit?
- Built in 1959 — when were the roof, HVAC, electrical panel, plumbing, and water heater last replaced?
- Why hasn't it sold? Are there any deal-killer items the seller is aware of (foundation, flood, title, zoning, code violations)?
- Is there a deadline driving the sale (1031 exchange, divorce, estate, relocation)? That informs how much negotiation room exists.
- Schools are F-rated, which usually means shorter tenancies and higher turnover. Who's the typical renter profile here, and what's been the actual vacancy rate?
- Crime grade is F in this area — have there been break-ins, vandalism, or insurance claims at this property in the last 3 years? What carrier currently insures it and at what premium?
- The area grade is low — what's the realistic commute time and amenity access for the typical tenant pool here? Any planned neighborhood developments (good or bad) we should know about?
- What's the average days-on-market for RENTAL listings here right now (not sales)? A rising rental-DOM trend means longer vacancies and softer asking-rent achievability than the comps imply.
- What's the recent tenant-quality profile in this submarket — average credit score on applications, eviction rate, late-payment / NSF rate, and stable-employment percentage? A property-management company in the area should have these aggregated.
- How much new for-sale + rental construction is in the pipeline within 1–3 miles? Heavy new supply typically softens prices + rents 12–24 months out; constrained supply supports both.
Investment metrics
- 1% rule
- 0.79% ✗
- Cap rate
- 6.77%
- Cash-on-cash
- 1.72%
- DSCR
- 1.08
- GRM
- 10.5
CMA / ARV
- ARV (on-the-fly)
- $232,512
- Comps found
- 11
Show comp detail 11 sales within ~0.75 mi
| Address | Dist | Beds/Ba | Sqft | Sold | Price | $/sf | Match |
|---|---|---|---|---|---|---|---|
| 1860 Greenwood Rd | 0.37mi | 3/2.0 | 1,432 (+6%) | 12mo | $170,000 | $119 | 61 |
| 3403 Gay St | 0.53mi | 3/2.0 | 1,458 (+8%) | 1mo | $152,500 | $105 | 61 |
| 1212 Greenwood Rd | 0.47mi | 3/2.0 | 1,350 (+0%) | 22mo | $233,350 | $173 | 59 |
| 1121 Orangewood Ave | 0.53mi | 3/1.0 | 1,213 (-10%) | 6mo | $100,000 | $82 | 50 |
| 1532 Lillian Ln | 0.69mi | 3/1.0 | 1,352 (+1%) | 22mo | $259,900 | $192 | 44 |
| 3002 Peggy Ln | 0.58mi | 3/2.0 | 1,526 (+14%) | 10mo | $273,000 | $179 | 42 |
| 1905 Parkway Dr | 0.61mi | 3/2.5 | 1,267 (-6%) | 22mo | $250,000 | $197 | 41 |
| 3604 Wilcox Blvd | 0.70mi | 3/1.0 | 1,184 (-12%) | 4mo | $145,000 | $122 | 40 |
| 1918 N Chamberlain Ave | 0.59mi | 4/2.0 (+1) | 1,211 (-10%) | 14mo | $265,000 | $219 | 39 |
| 3012 Peggy Ln | 0.61mi | 3/1.0 | 1,500 (+12%) | 12mo | $282,000 | $188 | 38 |
| 1117 Belmeade Ave | 0.71mi | 2/1.0 (-1) | 1,167 (-13%) | 4mo | $185,000 | $159 | 33 |
Match score weights: distance 35% · size 25% · config 20% · recency 20%. Top-matched comps best support the ARV.
Projected returns pro-forma
-3.0% appreciation · 0.73% rent growth · sell at horizon
- IRR
- -15.8%
- Equity multiple
- 0.45×
- Total profit
- $-30,022
- Equity at exit
- $28,926
- IRR
- -11.3%
- Equity multiple
- 0.38×
- Total profit
- $-33,651
- Equity at exit
- $16,774
Cash invested: $54,320 (down + closing). Projections, not guarantees.
Landlord ↔ Tenant lean methodology
- Overall (STATE)
- 87 Strongly Landlord-Friendly
- State Tennessee
- 87 Strongly Landlord-Friendly · R+13
- County
- — inherits STATE
- City
- — inherits STATE
ZIP-level market 37411
- Rents YoY
- 0.7%
- Active inventory
- 129
- Price-to-rent
- 10.5×
Monthly cashflow live
- Estimated rent
- $1,539 high interval (Pro) →
- Mortgage (P&I)
- −$1,017
- Tax from tax record
- −$40 /mo · $474/yr
- Insurance
- −$81
- HOA
- −$0
- Vacancy / Maint / Mgmt
- −$323
- Net cashflow
- $78
Break-even live
Sensitivity live
| Price | -10% $188 | -5% $133 | +0% $78 | +5% $23 | +10% $-32 |
|---|---|---|---|---|---|
| Rent | -10% $-44 | -5% $17 | +0% $78 | +5% $139 | +10% $199 |
| Rate | -1.0pp $175 | -0.5pp $127 | base $78 | +0.5pp $27 | +1.0pp $-24 |
UW: 25.0% down · 7.5% · 30yr · 1.5% tax · 5.0% vac · 8.0% maint · 8.0% mgmt
Financing live
Cash to close
- Down payment
- $48,500
- Closing costs
- $5,820
- Reserves months
- —
- Total cash needed
- —
Loan-product check · same deal, 3 products live
Conventional
25% down · 7.5% · 30yr
- Down + closing
- —
- Monthly P&I
- —
- Monthly cashflow
- —
- DSCR
- —
- Eligible?
- —
Personal DTI + credit; lowest rate.
DSCR
20% down · 8.5% · 30yr
- Down + closing
- —
- Monthly P&I
- —
- Monthly cashflow
- —
- DSCR
- —
- Eligible?
- —
No personal income docs; deal must DSCR.
Hard money
10% down · 12.0% · 12mo
- Down + closing
- —
- Monthly P&I
- —
- Monthly cashflow
- —
- DSCR
- —
- Eligible?
- —
Short-term bridge; refi at stabilization.
Rent comps 29 comps
| Address | Beds | Baths | Sqft | Rent | $/sqft | DOM | Units | Dist |
|---|---|---|---|---|---|---|---|---|
| 1203 Rockway Dr Unit 2 Chattanooga, TN | 2.0 | 1.0 | 940 | $1,250 | $1.33 | 15d | 1 | 0.60mi |
| 1706 Wheeler Ave Chattanooga, TN | 3.0 | 1.0 | 1317 | $1,625 | $1.23 | 25d | 1 | 0.64mi |
| 1205 Tunnel Blvd Chattanooga, TN | 3.0 | 1.0 | 1044 | $1,350 | $1.29 | 25d | 1 | 0.73mi |
| 1601 Arlington Ave Chattanooga, TN | 3.0 | 1.0 | 1416 | $1,650 | $1.17 | 15d | 1 | 0.75mi |
| 1635 Dogwood Dr Chattanooga, TN | 3.0 | 1.0 | 1024 | $1,600 | $1.56 | 15d | 1 | 0.76mi |
| 2323 Green Forest Dr Chattanooga, TN | 2.0 | 2.5 | 1404 | $1,750 | $1.25 | 15d | 1 | 0.78mi |
| 2009 Taylor St Chattanooga, TN | 3.0 | 1.5 | 1800 | $1,950 | $1.08 | 25d | 1 | 0.83mi |
| 2400 Crutchfield St Chattanooga, TN | 3.0 | 1.0 | 984 | $1,200 | $1.22 | 23d | 1 | 0.84mi |
| 2709 Citico Ave Chattanooga, TN | 2.0–3.0 | 1.0 | 1038 | $1,400 | $1.35 | 25d | 1 | 0.89mi |
| 2009 Camden St Chattanooga, TN | 3.0 | 1.5 | 1148 | $1,450 | $1.26 | 25d | 1 | 1.00mi |
| 1409 Bradt St Chattanooga, TN | 3.0 | 1.0 | 960 | $1,275 | $1.33 | 25d | 1 | 1.01mi |
| 3715 Rollingwood Dr Chattanooga, TN | 3.0 | 1.5 | 1200 | $1,400 | $1.17 | 25d | 1 | 1.01mi |
| 3868 Mark Twain Cir Chattanooga, TN | 4.0 | 2.0 | 1841 | $1,775 | $0.96 | 25d | 1 | 1.06mi |
| 2512 Boone St Chattanooga, TN | 3.0 | 1.0 | 1060 | $1,150 | $1.08 | 15d | 1 | 1.11mi |
| 822 Gillespie Rd Chattanooga, TN | 2.0 | 1.0 | 1000 | $1,550 | $1.55 | 15d | 1 | 1.14mi |
| 2603 Dodson Ave Chattanooga, TN | 4.0 | 1.0 | 1104 | $1,250 | $1.13 | 23d | 1 | 1.17mi |
| 2105 Rawlings St Chattanooga, TN | 3.0 | 1.0 | 1064 | $1,300 | $1.22 | 15d | 1 | 1.20mi |
| 2011 Milne St Unit b Chattanooga, TN | 3.0 | 1.0 | 976 | $1,345 | $1.38 | 15d | 1 | 1.22mi |
| 1754 Ocoee St Chattanooga, TN | 3.0 | 1.5 | 1050 | $1,250 | $1.19 | 15d | 1 | 1.23mi |
| 2829 New Jersey Ave Chattanooga, TN | 3.0 | 2.0 | 1120 | $1,295 | $1.16 | 15d | 1 | 1.24mi |
| 907 Sylvan Dr Chattanooga, TN | 3.0 | 2.0 | 1248 | $1,495 | $1.20 | 25d | 1 | 1.24mi |
| 802 Aubrey Ave Unit 1 Chattanooga, TN | 3.0 | 1.5 | 1248 | $1,495 | $1.20 | 15d | 1 | 1.26mi |
| 3118 Noa St Chattanooga, TN | 3.0 | 2.5 | 1350 | $1,599 | $1.18 | 15d | 1 | 1.35mi |
| 619 Shannon Ave Chattanooga, TN | 2.0 | 1.0 | 962 | $1,250 | $1.30 | 25d | 1 | 1.36mi |
| 3911 Wilsonia Ave Chattanooga, TN | 3.0 | 1.5 | 1143 | $1,395 | $1.22 | 25d | 1 | 1.36mi |
| 1908 Robbins St Chattanooga, TN | 3.0 | 2.0 | 1783 | $1,750 | $0.98 | 15d | 1 | 1.38mi |
| 3916 Blanchard St Chattanooga, TN | 3.0 | 2.0 | 1056 | $1,445 | $1.37 | 25d | 1 | 1.38mi |
| 3518 Ridgeside Rd Chattanooga, TN | 4.0 | 2.0 | 1409 | $1,375 | $0.98 | 25d | 1 | 1.40mi |
| 409 Booth Rd Chattanooga, TN | 3.0 | 2.0 | 1530 | $1,695 | $1.11 | 25d | 1 | 1.46mi |
Listing history 20 events
-
2026-06-22days on market $194,000 Active 121 DOM
-
2026-06-18days on market $194,000 Active 118 DOM
-
2026-06-17days on market $194,000 Active 117 DOM
-
2026-06-16days on market $194,000 Active 116 DOM
-
2026-06-15days on market $194,000 Active 115 DOM
-
2026-06-14days on market $194,000 Active 113 DOM
-
2026-06-10days on market $194,000 Active 110 DOM
-
2026-06-09days on market $194,000 Active 109 DOM
-
2026-06-08days on market $194,000 Active 108 DOM
-
2026-06-07days on market $194,000 Active 107 DOM
-
2026-06-05days on market $194,000 Active 104 DOM
-
2026-06-03days on market $194,000 Active 103 DOM
-
2026-06-02days on market $194,000 Active 102 DOM
-
2026-06-01days on market $194,000 Active 101 DOM
-
2026-05-31days on market $194,000 Active 100 DOM
-
2026-05-30days on market $194,000 Active 99 DOM
-
2026-04-07price $194,000
-
2026-02-21$199,000 Active
-
2013-07-15soldstatus $3,727,608
-
2007-12-31soldstatus $98,000
ⓘ Source: listings_history table (triggers on properties + properties_extension) + one-shot
backfill from property_details.listing_events for pre-trigger history.
Tax reassessment forecast TN · Resets to sale price
- Current annual tax
- $474 · $40/mo
- Projected year-2 tax
- $1,377 · $115/mo
- Expected delta
- +$903/yr (+$75/mo · 190.6%)
ⓘ Screening estimate from a state-policy table — verify with the county assessor before closing.
Climate risk First Street
- Flood 1/10 Low FEMA zone X (unshaded) · 0% chance over 30 yrs
- Wildfire 3/10 Moderate
- Heat 6/10 Major 7 d/yr ≥105°F today · 19 d/yr by 30 yrs out
- Wind 4/10 Moderate 10% chance of damaging wind over 30 yrs
- Air quality 3/10 Moderate 2 unhealthy d/yr today · 2 by 30 yrs out
Nearby sold comps map
Loading sold comps map…
Walkable amenities ~0.75 mi
Loading nearby amenities…
Taxation est. · year 1
- Rental income
- $18,463
- − Mortgage interest
- −$10,867
- − Property taxes
- −$474
- − Insurance
- −$970
- − Repairs & maintenance
- −$1,477
- − Management
- −$1,477
- − Depreciation
- −$5,644
- Taxable loss
- −$2,446
- Est. tax savings @ 24.0%
- +$587
- After-tax cash flow
- $1,520/yr
For passive investors: Depreciation is non-cash, so a rental often shows a tax loss while cash-flowing — sheltering income. Rental losses are passive: they offset passive income freely, and up to $25,000/yr can offset ordinary (W-2) income if you actively participate and your MAGI is under $100k (phasing out to $0 by $150k); unused losses carry forward. On sale, claimed depreciation is recaptured at up to 25%, and gains may owe capital-gains tax (a 1031 exchange can defer both). Figures are a year-1 estimate at your 24.0% rate — not tax advice; consult a CPA.
Schools (NCES district)
- District
- Hamilton County
- NCES district ID
- 4701590
- Math proficiency
- 31% ▼ -10.00%
- Reading proficiency
- 31% ▼ -3.00%
- Median HH income
- $47,456
- Composite
- 26.8/100
- National rank
- #7122
- State rank
- #42 of 139 in TN
Livability — Chattanooga
- Score
- 78/100
- State rank
- #3
- US rank
- #2582
Category grades
Schools grade is shown separately in the Schools card above.
Census & demographics
- Census place
- Chattanooga, TN
- County
- Hamilton County · 312,777 people
- City population
- 131,999
- Metro
- Chattanooga, TN-GA
- Population (ZIP)
- 18,997
- Household income
- $56,579
- Rent vs Own
- Severe rent burden
- 685.0
Population outlook (Hamilton County) Hauer SSP2
- Today (2025)
- 393,784 people
- By 2030
- 412,983 · +4.9%
- By 2040
- 449,502 · +14.1%
- By 2050
- 484,341 · +23.0%
- By 2075
- 565,746 · +43.7%
- By 2100
- 618,394 · +57.0%
Race, ethnicity, and origin ACS 2023
- Neighborhood character
- Diverse neighborhood (Simpson 0.63)
- Race & ethnicity
- Black 48% White 37% Hispanic / Latino 8% Two or more races 7%
- Hispanic origin (detail)
- Mexican 3% Puerto Rican 2%
- Common ancestry
- Italian 2% Slovak 2% Romanian 1%
- Foreign-born
- 4% · Canada, Vietnam
- Languages at home
- 92% English-only · Spanish 6% Arabic 0%
Political lean MEDSL · Hamilton
- 2024 margin
- R (+13.1) · D 42.7% · R 55.7% · Other 1.6%
- 2008→2024 swing
- -1.2pp toward R · 2008: -11.8pp · 2024: -13.1pp
- All cycles
- 2024: R+13.1 2020: R+9.7 2016: R+16.6 2012: R+14.8 2008: R+11.8
Not yet ingested
- Civics
- —
Market trends
- HPI YoY
- ▼ -190.85%
- Current HPI
- 240.2557
- Rent YoY
- ▲ 0.73%
- Metro
- Chattanooga, TN-GA
- State GDP YoY
- ▲ 2.78%
- F500 in state
- 22
Industry mix (Fortune 500 HQ in TN)
| Industry | F500 HQs | Revenue |
|---|---|---|
| Healthcare | 3 | $91B |
|
||
| Retail | 3 | $72B |
|
||
| Transportation / Logistics | 1 | $88B |
|
||
| Paper / Packaging | 1 | $19B |
|
||
| Insurance | 1 | $13B |
|
||
| Energy | 1 | $12B |
|
||
Price history
+98.0% since first listed4 events — show timeline
- 2026-04-07 Price Changed $194,000 GCAR
- 2026-02-21 Listed $199,000 GCAR
- 2013-07-15 Sold (Public Records) $3,727,608 Public Records
- 2007-12-31 Sold (Public Records) $98,000 Public Records
Property tax history
-1.4%/yrLatest (2025): $474 · -1.3% YoY. Source: county tax records.
Cash-flow waterfall
monthlySold comps — $/sqft
last 12 mo · ≤1 miLoading sold comps…