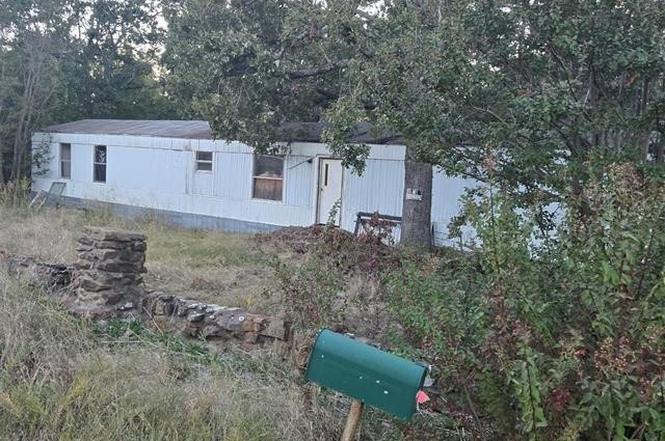
2003 Bristow Point Rd · Crowder, OK
Flood risk No data
- FEMA flood zone
- —
- Chance of flooding over 30 yrs
- —
- Est. flood insurance / yr
- —
Fire risk No data
- Est. fire insurance / yr
- —
Heat risk No data
- Hot days now (above threshold)
- —
- Hot days in 30 yrs
- —
Wind risk No data
- Chance of severe wind over 30 yrs
- —
Air-quality risk No data
- Unhealthy air days now
- —
- Unhealthy air days in 30 yrs
- —
Risk factors via First Street. Map © Google.
Why this score? — see what drove the B- grade
The composite is a weighted blend of 9 inputs, each scored 0–100. Each bar is that input's sub-score; the figure is the points it added to the 100-point composite (weight × sub-score).
- Cash flow +30.0/30.0
- 1% rule +10.0/10.0
- DSCR +10.0/10.0
- ARV discount +7.5/15.0
- Livability +3.1/5.0
- Rent growth +2.5/5.0
- Schools +2.5/10.0
- Condition / age +2.5/5.0
- Appreciation +0.0/10.0
$45,000
🖨 Deal sheet 📄 Offer letter ✓ Due diligence
Listing remarks
Interior lot w/ singlewide mobile home which has been almost gutted except electric stove, vent hood, & a double door refrigerator. The roof and the flooring appear to be solid condition but most of the flooring is down to subflooring. There is a half stone wall in front of the property and there are semicircular stone steps leading to the front door with railing nearby. (unattached) There is a nice bar dividing the kitchen & living room. There is a utility room near the backdoor. Backdoor leads onto a sturdy covered deck. The lot size is . 33 acres. The seller said his plumbing was completely redone before they were put into the nursing home. Seller is very motivated to sell.
Key facts
- Vent hood
- Bar dividing kitchen
- Electric stove
Tags
Property features AI
Finance
- Other: Located less than 5 miles from Eufaula Lake; Lot approximately 0.333 acres
- Financial info: Financial specifics not provided
- HOA & community: Pets allowed
Exterior
- Parking: Parking details not provided
- Security: No safety shelter
- Utilities: Rural water; Lagoon (sewer)
- Home design: Single-wide mobile home; 1 story; Faces east; Crawlspace foundation
- Construction: Aluminum siding; Metal roof; Built year from public records (year not specified)
- Exterior features: Deck; Storage structure; Partial barbed wire fencing; No other exterior features listed
Interior
- Kitchen: Electric oven; Range; Refrigerator
- Bedrooms: Great Room (first level)
- Flooring: Carpet; Laminate; Wood
- Bathrooms: 2 full bathrooms
- Heating & cooling: No heating or cooling details provided
- Interior features: Ceiling fan(s); Aluminum window frames; Electric oven and range connections; No additional interior features listed
- Laundry & utility: Washer hookup; Electric dryer hookup; Utility room (inside, first level)
Neighborhood map
What this means for you Summary
Snapshot
- This is a 3-bed/2.0-bath manufactured listed at $45k.
Deal economics
- At list price, monthly cash flow is $572 ($7k/yr) — positive.
- The deal already cash-flows at list — no discount required.
- Meets the 1% rule at list price ($1k rent vs $45k).
- Recommended offer: $40k (12.0% below list) — sets the bar for market timing.
Location & tenants
- Location reads 61/100 on livability (#298 in OK) — a middle-class / working-renter tenant base. Strengths: cost of living A+, housing A+; Watch: schools F, crime D-, amenities F.
- Crowder (rural): math 25% / reading 25% proficiency, ranked #328 of 513 in OK (top 64%) — low school quality limits family demand, transient renter base, plan for 1-2y turnover; 62% free/reduced lunch — lower-income household profile, screen leases tightly.
- Market conditions: 131 active listings in the ZIP; 46 units permitted in Pittsburg County in 2024 (0 in 5+ unit buildings).
Forward outlook
- Local home prices are declining (-3.0%/yr); year-one equity from $311 of loan paydown is wiped out by about $1k of value loss. Plan a longer hold.
- Pittsburg County population projected to shrink 7% by 2050 — rents likely to lag national; underwrite the cash flow, not the appreciation.
- At projected returns (-3.0% appreciation + 3.0% rent growth), your $13k cash investment doubles in ~3 years — after that, you're playing with house money.
Negotiation context
- It's been on market 238 days — a 12% lower offer ($40k) is reasonable based on typical stale-listing flexibility.
- 6 sale attempts since 12y ago with the ask held roughly flat each time — persistent listings suggest the price (not the market) is what's stuck; bring a comps-based counter.
- Current owner paid $15k; list at $45k implies a 200% gain — meaningful room to come down on a strong offer.
Questions for the listing agent
- It's been on market 238 days. Have you received any prior offers? Is the seller open to a 12% concession, seller financing, or rate buy-down credit?
- Why hasn't it sold? Are there any deal-killer items the seller is aware of (foundation, flood, title, zoning, code violations)?
- Is there a deadline driving the sale (1031 exchange, divorce, estate, relocation)? That informs how much negotiation room exists.
- Schools are F-rated, which usually means shorter tenancies and higher turnover. Who's the typical renter profile here, and what's been the actual vacancy rate?
- Crime grade is D in this area — have there been break-ins, vandalism, or insurance claims at this property in the last 3 years? What carrier currently insures it and at what premium?
- What's the average days-on-market for RENTAL listings here right now (not sales)? A rising rental-DOM trend means longer vacancies and softer asking-rent achievability than the comps imply.
- What's the recent tenant-quality profile in this submarket — average credit score on applications, eviction rate, late-payment / NSF rate, and stable-employment percentage? A property-management company in the area should have these aggregated.
- How much new for-sale + rental construction is in the pipeline within 1–3 miles? Heavy new supply typically softens prices + rents 12–24 months out; constrained supply supports both.
Investment metrics
- 1% rule
- 2.48% ✓
- Cap rate
- 21.56%
- Cash-on-cash
- 54.52%
- DSCR
- 3.43
- GRM
- 3.4
CMA / ARV
No comps found within radius.
Projected returns pro-forma
-3.0% appreciation · 3.0% rent growth · sell at horizon
- IRR
- 52.7%
- Equity multiple
- 3.32×
- Total profit
- $29,182
- Equity at exit
- $6,710
- IRR
- 58.0%
- Equity multiple
- 6.75×
- Total profit
- $72,424
- Equity at exit
- $3,891
Cash invested: $12,600 (down + closing). Projections, not guarantees.
Landlord ↔ Tenant lean methodology
- Overall (STATE)
- 83 Strongly Landlord-Friendly
- State Oklahoma
- 83 Strongly Landlord-Friendly · R+20
- County
- — inherits STATE
- City
- — inherits STATE
ZIP-level market 74501
- Home prices YoY
- -25.8%
- Active inventory
- 131
- Price-to-rent
- 3.4×
Monthly cashflow live
- Estimated rent
- $1,118 medium interval (Pro) →
- Mortgage (P&I)
- −$236
- Tax est. 1.5%
- −$56 /mo · $675/yr
- Insurance
- −$19
- HOA
- −$0
- Vacancy / Maint / Mgmt
- −$235
- Net cashflow
- $572
Break-even live
UW: 25.0% down · 7.5% · 30yr · 1.5% tax · 5.0% vac · 8.0% maint · 8.0% mgmt
Financing live
Cash to close
- Down payment
- $11,250
- Closing costs
- $1,350
- Reserves months
- —
- Total cash needed
- —
Loan-product check · same deal, 3 products live
Conventional
25% down · 7.5% · 30yr
- Down + closing
- —
- Monthly P&I
- —
- Monthly cashflow
- —
- DSCR
- —
- Eligible?
- —
Personal DTI + credit; lowest rate.
DSCR
20% down · 8.5% · 30yr
- Down + closing
- —
- Monthly P&I
- —
- Monthly cashflow
- —
- DSCR
- —
- Eligible?
- —
No personal income docs; deal must DSCR.
Hard money
10% down · 12.0% · 12mo
- Down + closing
- —
- Monthly P&I
- —
- Monthly cashflow
- —
- DSCR
- —
- Eligible?
- —
Short-term bridge; refi at stabilization.
Listing history 26 events
-
2026-06-18days on market $45,000 Active 238 DOM
-
2026-06-17days on market $45,000 Active 237 DOM
-
2026-06-16days on market $45,000 Active 236 DOM
-
2026-06-15days on market $45,000 Active 235 DOM
-
2026-06-13days on market $45,000 Active 233 DOM
-
2026-06-12days on market $45,000 Active 232 DOM
-
2026-06-09days on market $45,000 Active 229 DOM
-
2026-06-08days on market $45,000 Active 228 DOM
-
2026-06-08days on market $45,000 Active 227 DOM
-
2026-06-05days on market $45,000 Active 225 DOM
-
2026-06-04days on market $45,000 Active 223 DOM
-
2026-06-02days on market $45,000 Active 222 DOM
-
2026-06-01days on market $45,000 Active 221 DOM
-
2026-05-31days on market $45,000 Active 220 DOM
-
2026-01-12status Active
-
2025-12-28status Pending
-
2025-10-07$45,000 Active
-
2025-10-03historical
-
2025-09-26$59,900 Active
-
2025-09-03historical
-
2025-03-25price $59,900
-
2025-03-03$45,000 Active
-
2025-02-27historical
-
2024-10-18$97,000 Active
-
2014-09-15soldstatus $15,000
-
2014-07-21$15,000
ⓘ Source: listings_history table (triggers on properties + properties_extension) + one-shot
backfill from property_details.listing_events for pre-trigger history.
Nearby sold comps map
Loading sold comps map…
Walkable amenities ~0.75 mi
Loading nearby amenities…
Taxation est. · year 1
- Rental income
- $13,419
- − Mortgage interest
- −$2,521
- − Property taxes
- −$675
- − Insurance
- −$225
- − Repairs & maintenance
- −$1,073
- − Management
- −$1,073
- − Depreciation
- −$1,309
- Taxable income
- $6,542
- Est. tax owed @ 24.0%
- −$1,570
- After-tax cash flow
- $5,299/yr
For passive investors: Depreciation is non-cash, so a rental often shows a tax loss while cash-flowing — sheltering income. Rental losses are passive: they offset passive income freely, and up to $25,000/yr can offset ordinary (W-2) income if you actively participate and your MAGI is under $100k (phasing out to $0 by $150k); unused losses carry forward. On sale, claimed depreciation is recaptured at up to 25%, and gains may owe capital-gains tax (a 1031 exchange can defer both). Figures are a year-1 estimate at your 24.0% rate — not tax advice; consult a CPA.
Schools (NCES district)
- District
- Crowder
- NCES district ID
- 4009090
- Math proficiency
- 25% ▲ 4.00%
- Reading proficiency
- 25% ▼ -1.00%
- Median HH income
- $47,006
- Composite
- 24.81/100
- National rank
- #13013
- State rank
- #328 of 513 in OK
Livability — Crowder
- Score
- 61/100
- State rank
- #298
- US rank
- #17710
Category grades
Schools grade is shown separately in the Schools card above.
Census & demographics
- Population (ZIP)
- 28,687
Population outlook (Pittsburg County) Hauer SSP2
- Today (2025)
- 42,795 people
- By 2030
- 41,901 · -2.1%
- By 2040
- 40,680 · -4.9%
- By 2050
- 39,952 · -6.6%
- By 2075
- 38,858 · -9.2%
- By 2100
- 36,031 · -15.8%
Race, ethnicity, and origin ACS 2023
- Neighborhood character
- Diverse neighborhood (Simpson 0.55)
- Race & ethnicity
- White 67% Two or more races 17% Native American 9% Hispanic / Latino 6% Black 3%
- Hispanic origin (detail)
- Mexican 5%
- Common ancestry
- Iranian 2% Slovak 2% Romanian 1%
- Foreign-born
- 2% · Canada
- Languages at home
- 95% English-only · Spanish 3%
Political lean MEDSL · Pittsburg
- 2024 margin
- Solid R (+59.0) · D 19.8% · R 78.8% · Other 1.5%
- 2008→2024 swing
- -22.4pp toward R · 2008: -36.6pp · 2024: -59.0pp
- All cycles
- 2024: R+59.0 2020: R+56.3 2016: R+52.4 2012: R+38.3 2008: R+36.6
Not yet ingested
- Civics
- —
Market trends
- HPI YoY
- ▼ -74.14%
- Current HPI
- 212.9867
- Rent YoY
- —
- Metro
- —
- State GDP YoY
- ▲ 1.55%
- F500 in state
- 6
Industry mix (Fortune 500 HQ in OK)
| Industry | F500 HQs | Revenue |
|---|---|---|
| Energy | 3 | $48B |
|
||
Price history
+200.0% since first listed12 events — show timeline
- 2026-01-12 Relisted — MLS Technology, Inc.
- 2025-12-28 Pending — MLS Technology, Inc.
- 2025-10-07 Listed $45,000 MLS Technology, Inc.
- 2025-10-03 Listing Removed — MLS Technology, Inc.
- 2025-09-26 Listed $59,900 MLS Technology, Inc.
- 2025-09-03 Listing Removed — MLS Technology, Inc.
- 2025-03-25 Price Changed $59,900 MLS Technology, Inc.
- 2025-03-03 Listed $45,000 MLS Technology, Inc.
- 2025-02-27 Listing Removed — MLS Technology, Inc.
- 2024-10-18 Listed $97,000 MLS Technology, Inc.
- 2014-09-15 Sold (MLS) $15,000 MLS Technology, Inc.
- 2014-07-21 Listed $15,000 MLS Technology, Inc.
Cash-flow waterfall
monthlySold comps — $/sqft
last 12 mo · ≤1 miLoading sold comps…