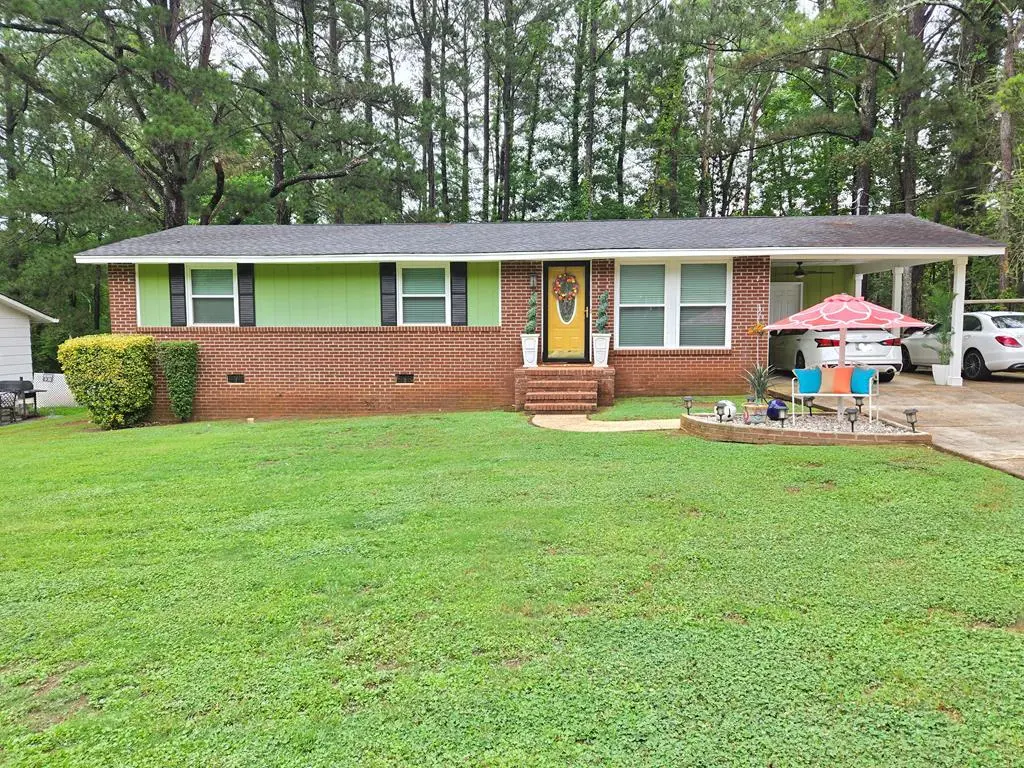
112 Sir Lancelot St · LaGrange, GA
Flood risk 1/10 · Minimal
- FEMA flood zone
- X (unshaded)
- Chance of flooding over 30 yrs
- 0.0%
- Est. flood insurance / yr
- $507 – $1,088
Fire risk 3/10 · Minor
- Est. fire insurance / yr
- $963 – $1,789
Heat risk 6/10 · Moderate
- Hot days now (above 105°F)
- 7 days/yr
- Hot days in 30 yrs
- 20 days/yr
Wind risk 6/10 · Moderate
- Chance of severe wind over 30 yrs
- 53.0%
Air-quality risk 4/10 · Minor
- Unhealthy air days now
- 4 days/yr
- Unhealthy air days in 30 yrs
- 5 days/yr
Risk factors via First Street. Map © Google.
Why this score? — see what drove the B- grade
The composite is a weighted blend of 9 inputs, each scored 0–100. Each bar is that input's sub-score; the figure is the points it added to the 100-point composite (weight × sub-score).
- Cash flow +25.0/30.0
- ARV discount +15.0/15.0
- DSCR +8.2/10.0
- 1% rule +5.8/10.0
- Rent growth +3.7/5.0
- Livability +3.0/5.0
- Condition / age +2.5/5.0
- Schools +2.3/10.0
- Appreciation +0.0/10.0
$150,000
🖨 Deal sheet (PDF) 📄 Offer letter ✓ Due diligence
Listing remarks
This charming 3 bedroom 2 bath home sits on a nice size . 32 acre lot. This home has a 1 car carport and a cozy family room with a breakfast area right off the kitchen. This home also has easy access to shopping and restaurants. The master bedroom bathroom does need some TLC.
Key facts
- Carport
- Family room
- Breakfast area
Tags
Property features AI
Finance
- Other: Directions available: Turn left onto US-29 S, turn right onto King Arthur Dr, then turn left onto Lady Elaine St.
- Financial info: Details not provided
- HOA & community: Subdivision: CAMELOT ESTATE
Exterior
- Parking: Details not provided
- Security: Details not provided
- Utilities: Public water; Public sewer
- Home design: Single-family residence; Residential property
- Construction: Brick construction; Details not provided for year built, roof, or foundation
- Exterior features: Level lot
Interior
- Kitchen: Details not provided
- Bedrooms: Details not provided
- Flooring: Details not provided
- Bathrooms: 2 full bathrooms
- Heating & cooling: Details not provided
- Interior features: Crawl space basement
- Laundry & utility: Laundry room
Neighborhood map
What this means for you Summary
Snapshot
- This is a 3-bed/1.5-bath single-family listed at $150k.
Deal economics
- At list price, monthly cash flow is $327 ($4k/yr) — positive.
- The deal already cash-flows at list — no discount required.
- Meets the 1% rule at list price ($2k rent vs $150k).
- Cap rate 8.9% vs local median 3.4% in LaGrange — top-decile yield for the area; either an underpriced asset or a hidden risk that comps aren't pricing in. Stress-test before assuming the spread holds.
Location & tenants
- Location reads 60/100 on livability (#393 in GA) — a middle-class / working-renter tenant base. Strengths: cost of living A+, housing A; Watch: crime F, amenities F, commute F.
- Troup County (rural): math 26% / reading 29% proficiency, ranked #109 of 174 in GA (top 63%) — low school quality limits family demand, transient renter base, plan for 1-2y turnover.
- Zoned schools: Callaway Elementary School (math 28% / reading 22%, grade F, #745 of 1,228 statewide, top 61%, 651 students, 72% FRL); Callaway Middle School (math 12% / reading 22%, grade F, #381 of 470 statewide, top 82%, 759 students, 94% FRL); Callaway High School (math 13% / reading 22%, grade F, #264 of 424 statewide, top 63%, 921 students, 94% FRL) — zoned schools average 87% FRL vs 58% district-wide (28 pts higher); higher-poverty schools than district average — tighter screening recommended.
- Market conditions: Rents rising fast (+5.0%/yr); 277 active listings in the ZIP; 7 comparable units currently listed for rent nearby; rentals lingering (median 46d on market — plan ~5-8 weeks vacancy on turnover, expect pricing pressure); 57% of comp listings sitting > 30 days — soft ceiling on asking rent; 474 units permitted in Troup County in 2024 (87 in 5+ unit buildings).
- This rent runs 40% of the median local income ($49k/yr) — at the standard rent-burdened threshold; future hikes will face affordability resistance.
Forward outlook
- Local home prices are declining (-3.0%/yr); year-one equity from $1k of loan paydown is wiped out by about $4k of value loss. Plan a longer hold.
- Troup County population projected at +15% by 2050 — long-run rental-demand tailwind backs the buy-and-hold thesis.
- At projected returns (-3.0% appreciation + 5.0% rent growth), your $42k cash investment doubles in ~10 years — after that, you're playing with house money.
Negotiation context
- Only 10 days on market — expect competitive offers; lowballing is unlikely to land.
Risks & watch-outs
- Climate carrying-cost: major wind risk, 53% chance of damaging wind over 30y; extreme-heat days projected 7→20/yr by 2055 (HVAC capex compounding) — expect insurance premiums to compound above CPI over the hold.
Questions for the listing agent
- Built in 1971 — when were the roof, HVAC, electrical panel, plumbing, and water heater last replaced?
- Is there a deadline driving the sale (1031 exchange, divorce, estate, relocation)? That informs how much negotiation room exists.
- Schools are D-rated, which usually means shorter tenancies and higher turnover. Who's the typical renter profile here, and what's been the actual vacancy rate?
- Crime grade is F in this area — have there been break-ins, vandalism, or insurance claims at this property in the last 3 years? What carrier currently insures it and at what premium?
- What's the average days-on-market for RENTAL listings here right now (not sales)? A rising rental-DOM trend means longer vacancies and softer asking-rent achievability than the comps imply.
- What's the recent tenant-quality profile in this submarket — average credit score on applications, eviction rate, late-payment / NSF rate, and stable-employment percentage? A property-management company in the area should have these aggregated.
- How much new for-sale + rental construction is in the pipeline within 1–3 miles? Heavy new supply typically softens prices + rents 12–24 months out; constrained supply supports both.
Investment metrics
- 1% rule
- 1.08% ✓
- Cap rate
- 8.91%
- Cash-on-cash
- 9.34%
- DSCR
- 1.42
- GRM
- 7.7
CMA / ARV
- ARV (on-the-fly)
- $191,250
- Comps found
- 7
Show comp detail 7 sales within ~0.75 mi
| Address | Dist | Beds/Ba | Sqft | Sold | Price | $/sf | Match |
|---|---|---|---|---|---|---|---|
| 105 Sir Lancelot Ave | 0.07mi | 4/1.0 (+1) | 1,175 (+4%) | 1mo | $203,500 | $173 | 81 |
| 106 King Arthur Dr | 0.12mi | 3/2.0 | 1,118 (-1%) | 21mo | $175,000 | $157 | 74 |
| 104 King Arthur Dr | 0.14mi | 3/2.0 | 1,188 (+6%) | 17mo | $184,950 | $156 | 68 |
| 219 Baileys Way | 0.54mi | 3/2.0 | 1,144 (+2%) | 9mo | $179,900 | $157 | 63 |
| 207 Baileys Way | 0.60mi | 3/2.0 | 1,088 (-3%) | 7mo | $185,000 | $170 | 59 |
| 500 Brookstone Dr | 0.39mi | 3/2.0 | 1,292 (+15%) | 14mo | $246,600 | $191 | 44 |
| 605 Brookstone Dr | 0.48mi | 3/2.0 | 1,222 (+9%) | 24mo | $249,900 | $205 | 42 |
Match score weights: distance 35% · size 25% · config 20% · recency 20%. Top-matched comps best support the ARV.
Projected returns pro-forma
-3.0% appreciation · 4.95% rent growth · sell at horizon
- IRR
- -0.2%
- Equity multiple
- 0.99×
- Total profit
- $-268
- Equity at exit
- $22,365
- IRR
- 11.3%
- Equity multiple
- 1.96×
- Total profit
- $40,336
- Equity at exit
- $12,969
Cash invested: $42,000 (down + closing). Projections, not guarantees.
Landlord ↔ Tenant lean methodology
- Overall (STATE)
- 90 Strongly Landlord-Friendly
- State Georgia
- 90 Strongly Landlord-Friendly · R+3
- County
- — inherits STATE
- City
- — inherits STATE
ZIP-level market 30241
- Home prices YoY
- -3.6%
- Rents YoY
- 5.0%
- Active inventory
- 277
- Price-to-rent
- 7.7×
Monthly cashflow live
- Estimated rent
- $1,624 high interval (Pro) →
- Mortgage (P&I)
- −$787
- Tax from tax record
- −$107 /mo · $1,280/yr
- Insurance
- −$62
- HOA
- −$0
- Vacancy / Maint / Mgmt
- −$341
- Net cashflow
- $327
Break-even live
Sensitivity live
| Price | -10% $412 | -5% $369 | +0% $327 | +5% $284 | +10% $242 |
|---|---|---|---|---|---|
| Rent | -10% $199 | -5% $263 | +0% $327 | +5% $391 | +10% $455 |
| Rate | -1.0pp $402 | -0.5pp $365 | base $327 | +0.5pp $288 | +1.0pp $248 |
UW: 25.0% down · 7.5% · 30yr · 1.5% tax · 5.0% vac · 8.0% maint · 8.0% mgmt
Financing live
Cash to close
- Down payment
- $37,500
- Closing costs
- $4,500
- Reserves months
- —
- Total cash needed
- —
Loan-product check · same deal, 3 products live
Conventional
25% down · 7.5% · 30yr
- Down + closing
- —
- Monthly P&I
- —
- Monthly cashflow
- —
- DSCR
- —
- Eligible?
- —
Personal DTI + credit; lowest rate.
DSCR
20% down · 8.5% · 30yr
- Down + closing
- —
- Monthly P&I
- —
- Monthly cashflow
- —
- DSCR
- —
- Eligible?
- —
No personal income docs; deal must DSCR.
Hard money
10% down · 12.0% · 12mo
- Down + closing
- —
- Monthly P&I
- —
- Monthly cashflow
- —
- DSCR
- —
- Eligible?
- —
Short-term bridge; refi at stabilization.
Rent comps 7 comps
| Address | Beds | Baths | Sqft | Rent | $/sqft | DOM | Units | Dist |
|---|---|---|---|---|---|---|---|---|
| 151 S Davis Rd LaGrange, GA | 3.0 | 1.0–2.0 | 940 | $1,887 | $2.01 | 0d | 30 | 0.51mi |
| 150 Mill Creek Pkwy LaGrange, GA | 1.0–2.0 | 1.0–2.0 | 954 | $1,465 | $1.53 | 46d | 11 | 0.53mi |
| 1235 Hogansville Rd LaGrange, GA | 3.0 | 2.0 | 1263 | $1,555 | $1.23 | 46d | 1 | 0.54mi |
| 140 N Davis Rd LaGrange, GA | 1.0–3.0 | 1.0–2.0 | 983 | $1,719 | $1.75 | 4d | 14 | 0.57mi |
| 102 Peachtree Ct Lagrange, GA | 2.0 | 1.0 | 1120 | $1,050 | $0.94 | 46d | 1 | 0.92mi |
| 1 Canopy Crest WAY LaGrange, GA | 2.0–4.0 | 2.5–3.0 | 1442 | $2,285 | $1.58 | 5d | 9 | 0.95mi |
| 55 Patillo Rd LaGrange, GA | 2.0 | 2.0 | 1250 | $1,050 | $0.84 | 46d | 1 | 1.37mi |
Listing history 9 events
-
2026-06-22days on market $150,000 Active 10 DOM
-
2026-06-21days on market $150,000 Active 9 DOM
-
2026-06-19days on market $150,000 Active 7 DOM
-
2026-06-18days on market $150,000 Active 6 DOM
-
2026-06-17days on market $150,000 Active 5 DOM
-
2026-06-16days on market $150,000 Active 4 DOM
-
2026-06-15days on market $150,000 Active 3 DOM
-
2026-06-12remarks 276-char remark
-
2026-06-12$150,000 Active 1 DOM
ⓘ Source: listings_history table (triggers on properties + properties_extension) + one-shot
backfill from property_details.listing_events for pre-trigger history.
Tax reassessment forecast GA · Resets to sale price
- Current annual tax
- $1,280 · $107/mo
- Projected year-2 tax
- $1,380 · $115/mo
- Expected delta
- +$100/yr (+$8/mo · 7.8%)
ⓘ Screening estimate from a state-policy table — verify with the county assessor before closing.
Climate risk First Street
- Flood 1/10 Low FEMA zone X (unshaded) · 0% chance over 30 yrs
- Wildfire 3/10 Moderate
- Heat 6/10 Major 7 d/yr ≥105°F today · 20 d/yr by 30 yrs out
- Wind 6/10 Major 53% chance of damaging wind over 30 yrs
- Air quality 4/10 Moderate 4 unhealthy d/yr today · 5 by 30 yrs out
Nearby sold comps map
Loading sold comps map…
Walkable amenities ~0.75 mi
Loading nearby amenities…
Taxation est. · year 1
- Rental income
- $19,483
- − Mortgage interest
- −$8,402
- − Property taxes
- −$1,280
- − Insurance
- −$750
- − Repairs & maintenance
- −$1,559
- − Management
- −$1,559
- − Depreciation
- −$4,364
- Taxable income
- $1,570
- Est. tax owed @ 24.0%
- −$377
- After-tax cash flow
- $3,545/yr
For passive investors: Depreciation is non-cash, so a rental often shows a tax loss while cash-flowing — sheltering income. Rental losses are passive: they offset passive income freely, and up to $25,000/yr can offset ordinary (W-2) income if you actively participate and your MAGI is under $100k (phasing out to $0 by $150k); unused losses carry forward. On sale, claimed depreciation is recaptured at up to 25%, and gains may owe capital-gains tax (a 1031 exchange can defer both). Figures are a year-1 estimate at your 24.0% rate — not tax advice; consult a CPA.
Schools (NCES district)
- District
- Troup County
- NCES district ID
- 1300001
- Math proficiency
- 26% ▼ -10.00%
- Reading proficiency
- 29% ▼ -4.00%
- Median HH income
- $41,354
- Composite
- 23.3/100
- National rank
- #7920
- State rank
- #109 of 174 in GA
Livability — LaGrange
- Score
- 60/100
- State rank
- #393
- US rank
- #19555
Category grades
Schools grade is shown separately in the Schools card above.
Census & demographics
- Census place
- LaGrange, GA
- County
- Troup County · 57,111 people
- City population
- 57,111
- Metro
- LaGrange, GA-AL
- Population (ZIP)
- 25,840
- Household income
- $49,053
- Rent vs Own
- Severe rent burden
- 1383.0
Population outlook (Troup County) Hauer SSP2
- Today (2025)
- 75,537 people
- By 2030
- 78,250 · +3.6%
- By 2040
- 83,184 · +10.1%
- By 2050
- 87,167 · +15.4%
- By 2075
- 95,643 · +26.6%
- By 2100
- 94,234 · +24.8%
Race, ethnicity, and origin ACS 2023
- Neighborhood character
- Diverse neighborhood (Simpson 0.58)
- Race & ethnicity
- Black 46% White 46% Hispanic / Latino 3% Asian 3% Two or more races 2%
- Common ancestry
- Lithuanian 1% Hispanic 1% Italian 1%
- Foreign-born
- 4% · South Korea, Canada
- Languages at home
- 93% English-only · Spanish 3% Korean 2% Other Indo-European 1%
Political lean MEDSL · Troup
- 2024 margin
- Strong R (+24.4) · D 37.6% · R 62.0%
- 2008→2024 swing
- -5.4pp toward R · 2008: -19.0pp · 2024: -24.4pp
- All cycles
- 2024: R+24.4 2020: R+21.9 2016: R+23.4 2012: R+17.8 2008: R+19.0
Not yet ingested
- Civics
- —
Market trends
- HPI YoY
- ▼ -10.51%
- Current HPI
- 277.9099
- Rent YoY
- ▲ 4.95%
- Metro
- LaGrange, GA-AL
- State GDP YoY
- ▲ 2.66%
- F500 in state
- 28
Industry mix (Fortune 500 HQ in GA)
| Industry | F500 HQs | Revenue |
|---|---|---|
| Paper / Packaging | 2 | $29B |
|
||
| Retail | 1 | $160B |
|
||
| Transportation / Logistics | 1 | $91B |
|
||
| Airlines | 1 | $62B |
|
||
| Consumer Goods | 1 | $47B |
|
||
| Utilities | 1 | $25B |
|
||
Price history
1 event — show timeline
- 2026-06-10 Listed $150,000 CBOR
Property tax history
+3.0%/yrLatest (2025): $1,280 · +20.7% YoY. Source: county tax records.
Cash-flow waterfall
monthlySold comps — $/sqft
last 12 mo · ≤1 miLoading sold comps…