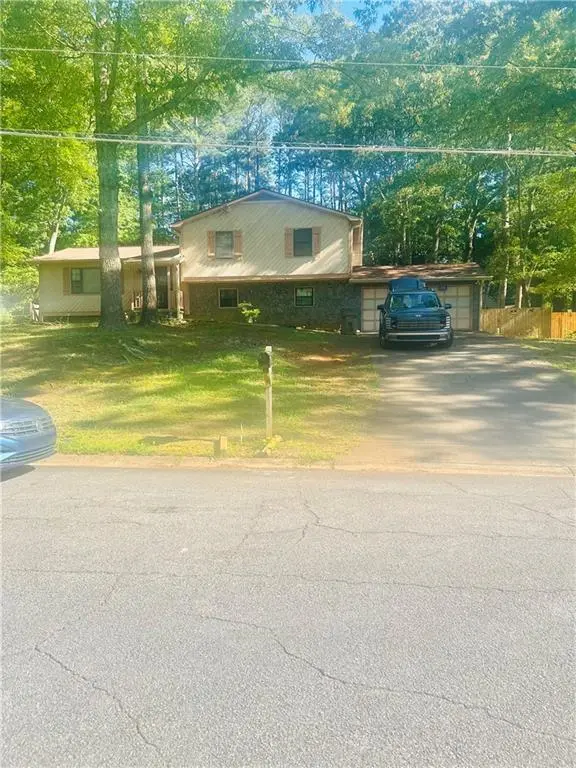
70 Hager Dr · Riverdale, GA
Flood risk 1/10 · Minimal
- FEMA flood zone
- X (unshaded)
- Chance of flooding over 30 yrs
- 0.0%
- Est. flood insurance / yr
- $507 – $1,088
Fire risk 3/10 · Minor
- Est. fire insurance / yr
- $963 – $1,789
Heat risk 5/10 · Moderate
- Hot days now (above 105°F)
- 5 days/yr
- Hot days in 30 yrs
- 13 days/yr
Wind risk 6/10 · Moderate
- Chance of severe wind over 30 yrs
- 27.0%
Air-quality risk 4/10 · Minor
- Unhealthy air days now
- 4 days/yr
- Unhealthy air days in 30 yrs
- 6 days/yr
Risk factors via First Street. Map © Google.
Why this score? — see what drove the C+ grade
The composite is a weighted blend of 9 inputs, each scored 0–100. Each bar is that input's sub-score; the figure is the points it added to the 100-point composite (weight × sub-score).
- Cash flow +24.6/30.0
- ARV discount +14.8/15.0
- DSCR +7.9/10.0
- 1% rule +5.1/10.0
- Livability +3.5/5.0
- Rent growth +2.8/5.0
- Condition / age +2.5/5.0
- Schools +1.3/10.0
- Appreciation +0.0/10.0
$170,000
🖨 Deal sheet (PDF) 📄 Offer letter ✓ Due diligence
Listing remarks
Investor special! Spacious Three Bedrooms and Two baths, Bonus Room Included. Bring your renovation ideas and transform this property into a profitable investment or beautiful home. Excellent opportunity to add value through repairs and improvements. Sold as-is
Key facts
- 0.57 acre lot
- 2 garage spots
- Built 1977
Property features AI
Finance
- Other: Lot about 0.57 acres
- Financial info: Listing offered As-Is; Acceptable financing: Cash or Conventional
- HOA & community: No HOA
Exterior
- Parking: Attached garage with room for 2 vehicles
- Security: Security system; Smoke detectors
- Utilities: Public water; Public sewer; 220 volt electric service; Cable, phone, and natural gas available; Underground utilities
- Home design: Single family house; Multi/split levels; Residential property; Built in 1977; Property listed in fixer condition
- Construction: Stone and wood siding exterior; Composition roof; Slab foundation
- Exterior features: Deck; Porch; Back yard fencing (chain link and wood); Sloped lot
Interior
- Kitchen: Dishwasher; Refrigerator; Gas water heater
- Bedrooms: 3 bedrooms
- Flooring: Carpet; Laminate; Vinyl
- Bathrooms: 2 full bathrooms
- Heating & cooling: Natural gas heating; Central air conditioning; Ceiling fans
- Interior features: Open living/dining combo; Bonus room; Gas log fireplace in family room; One fireplace in basement
- Laundry & utility: Laundry in basement
Neighborhood map
What this means for you Summary
Snapshot
- This is a 3-bed/2.0-bath single-family listed at $170k.
Deal economics
- At list price, monthly cash flow is $352 ($4k/yr) — positive.
- The deal already cash-flows at list — no discount required.
- Meets the 1% rule at list price ($2k rent vs $170k).
- Recommended offer: $167k (1.5% below list) — sets the bar for market timing.
- Cap rate 8.8% vs local median 5.5% in Riverdale — top-decile yield for the area; either an underpriced asset or a hidden risk that comps aren't pricing in. Stress-test before assuming the spread holds.
Location & tenants
- Location reads 70/100 on livability (#100 in GA) — a middle-class / working-renter tenant base. Strengths: cost of living A+, housing A+; Watch: crime D, amenities F, commute F.
- Clayton County (suburban): math 11% / reading 20% proficiency, ranked #155 of 174 in GA (top 89%) — low school quality limits family demand, transient renter base, plan for 1-2y turnover; 78% free/reduced lunch — lower-income household profile, screen leases tightly.
- Zoned schools: Callaway Elementary School (math 24% / reading 24%, grade F, #753 of 1,228 statewide, top 64%, 706 students, 90% FRL); Kendrick Middle School (math 17% / reading 27%, grade F, #333 of 470 statewide, top 72%, 696 students, 90% FRL); Riverdale High School (math 12% / reading 17%, grade F, #315 of 424 statewide, top 76%, 1,333 students, 90% FRL).
- Market conditions: Rents rising (+1.3%/yr); 189 active listings in the ZIP; 40 comparable units currently listed for rent nearby; rentals at typical pace (median 15d on market — plan ~3-4 weeks tenant-placement turnaround); 865 units permitted in Clayton County in 2024 (448 in 5+ unit buildings).
- This rent runs 40% of the median local income ($52k/yr) — at the standard rent-burdened threshold; future hikes will face affordability resistance.
Forward outlook
- Local home prices are declining (-3.0%/yr); year-one equity from $1k of loan paydown is wiped out by about $5k of value loss. Plan a longer hold.
- Clayton County population projected at +29% by 2050 — long-run rental-demand tailwind backs the buy-and-hold thesis.
Negotiation context
- It's been on market 16 days — a 2% lower offer ($167k) is reasonable based on typical stale-listing flexibility.
- Current owner paid $75k; list at $170k implies a 127% gain — meaningful room to come down on a strong offer.
Risks & watch-outs
- Climate carrying-cost: major wind risk, 27% chance of damaging wind over 30y; extreme-heat days projected 5→13/yr by 2055 (HVAC capex compounding) — expect insurance premiums to compound above CPI over the hold.
Questions for the listing agent
- Built in 1977 — when were the roof, HVAC, electrical panel, plumbing, and water heater last replaced?
- Is there a deadline driving the sale (1031 exchange, divorce, estate, relocation)? That informs how much negotiation room exists.
- Schools are D-rated, which usually means shorter tenancies and higher turnover. Who's the typical renter profile here, and what's been the actual vacancy rate?
- Crime grade is D in this area — have there been break-ins, vandalism, or insurance claims at this property in the last 3 years? What carrier currently insures it and at what premium?
- What's the average days-on-market for RENTAL listings here right now (not sales)? A rising rental-DOM trend means longer vacancies and softer asking-rent achievability than the comps imply.
- What's the recent tenant-quality profile in this submarket — average credit score on applications, eviction rate, late-payment / NSF rate, and stable-employment percentage? A property-management company in the area should have these aggregated.
- How much new for-sale + rental construction is in the pipeline within 1–3 miles? Heavy new supply typically softens prices + rents 12–24 months out; constrained supply supports both.
Investment metrics
- 1% rule
- 1.01% ✓
- Cap rate
- 8.77%
- Cash-on-cash
- 8.86%
- DSCR
- 1.39
- GRM
- 8.2
CMA / ARV
- ARV (on-the-fly)
- $203,100
- Comps found
- 12
Show comp detail 12 sales within ~0.75 mi
| Address | Dist | Beds/Ba | Sqft | Sold | Price | $/sf | Match |
|---|---|---|---|---|---|---|---|
| 245 Antebellum Cir | 0.25mi | 3/2.0 | 1,320 (-2%) | 3mo | $141,000 | $107 | 82 |
| 113 Hager Dr | 0.08mi | 3/2.5 | 1,274 (-6%) | 8mo | $260,000 | $204 | 77 |
| 7673 Cloverdale Ln | 0.24mi | 3/1.5 | 1,320 (-2%) | 8mo | $225,000 | $170 | 76 |
| 235 Montego Cir | 0.58mi | 3/2.0 | 1,348 (-0%) | 3mo | $195,900 | $145 | 70 |
| 182 Iris Ct | 0.51mi | 3/2.0 | 1,310 (-3%) | 4mo | $196,900 | $150 | 68 |
| 240 Chase Woods Cir | 0.56mi | 3/2.0 | 1,295 (-4%) | 1mo | $245,000 | $189 | 66 |
| 169 Sedgefield | 0.44mi | 3/2.0 | 1,300 (-4%) | 9mo | $215,200 | $166 | 65 |
| 7629 Park Ln | 0.63mi | 3/2.0 | 1,263 (-7%) | 11mo | $238,500 | $189 | 51 |
| 7582 Smith Ct | 0.60mi | 3/2.0 | 1,521 (+12%) | 2mo | $197,500 | $130 | 50 |
| 7755 Chase Woods Dr | 0.60mi | 3/3.0 | 1,479 (+9%) | 7mo | $119,000 | $80 | 47 |
| 194 Lexington Ct | 0.54mi | 4/1.5 (+1) | 1,536 (+13%) | 7mo | $215,000 | $140 | 39 |
| 161 Aaron Ct | 0.46mi | 4/1.5 (+1) | 1,158 (-14%) | 10mo | $170,000 | $147 | 38 |
Match score weights: distance 35% · size 25% · config 20% · recency 20%. Top-matched comps best support the ARV.
Projected returns pro-forma
-3.0% appreciation · 1.3% rent growth · sell at horizon
- IRR
- -4.6%
- Equity multiple
- 0.83×
- Total profit
- $-8,127
- Equity at exit
- $25,348
- IRR
- 3.1%
- Equity multiple
- 1.21×
- Total profit
- $9,972
- Equity at exit
- $14,698
Cash invested: $47,600 (down + closing). Projections, not guarantees.
Landlord ↔ Tenant lean methodology
- Overall (STATE)
- 90 Strongly Landlord-Friendly
- State Georgia
- 90 Strongly Landlord-Friendly · R+3
- County
- — inherits STATE
- City
- — inherits STATE
ZIP-level market 30274
- Home prices YoY
- -19.6%
- Rents YoY
- 1.3%
- Active inventory
- 189
- Price-to-rent
- 8.2×
Monthly cashflow live
- Estimated rent
- $1,719 high interval (Pro) →
- Mortgage (P&I)
- −$891
- Tax from tax record
- −$44 /mo · $526/yr
- Insurance
- −$71
- HOA
- −$0
- Vacancy / Maint / Mgmt
- −$361
- Net cashflow
- $352
Break-even live
Sensitivity live
| Price | -10% $448 | -5% $400 | +0% $352 | +5% $303 | +10% $255 |
|---|---|---|---|---|---|
| Rent | -10% $216 | -5% $284 | +0% $352 | +5% $419 | +10% $487 |
| Rate | -1.0pp $437 | -0.5pp $395 | base $352 | +0.5pp $307 | +1.0pp $263 |
UW: 25.0% down · 7.5% · 30yr · 1.5% tax · 5.0% vac · 8.0% maint · 8.0% mgmt
Financing live
Cash to close
- Down payment
- $42,500
- Closing costs
- $5,100
- Reserves months
- —
- Total cash needed
- —
Loan-product check · same deal, 3 products live
Conventional
25% down · 7.5% · 30yr
- Down + closing
- —
- Monthly P&I
- —
- Monthly cashflow
- —
- DSCR
- —
- Eligible?
- —
Personal DTI + credit; lowest rate.
DSCR
20% down · 8.5% · 30yr
- Down + closing
- —
- Monthly P&I
- —
- Monthly cashflow
- —
- DSCR
- —
- Eligible?
- —
No personal income docs; deal must DSCR.
Hard money
10% down · 12.0% · 12mo
- Down + closing
- —
- Monthly P&I
- —
- Monthly cashflow
- —
- DSCR
- —
- Eligible?
- —
Short-term bridge; refi at stabilization.
Rent comps 40 comps
| Address | Beds | Baths | Sqft | Rent | $/sqft | DOM | Units | Dist |
|---|---|---|---|---|---|---|---|---|
| 7 Old Roundtree Rd Riverdale, GA | 3.0 | 2.5 | 1620 | $1,840 | $1.14 | 12d | 1 | 0.30mi |
| 269 Highway 138 SW Riverdale, GA | 1.0–2.0 | 1.0–2.0 | 995 | $1,405 | $1.41 | 0d | 37 | 0.31mi |
| 233 Lucan Way Riverdale, GA | 3.0 | 2.0 | 1201 | $1,665 | $1.39 | 6d | 1 | 0.43mi |
| 164 Meadowlark Ln Jonesboro, GA | 3.0 | 1.5 | 1056 | $1,630 | $1.54 | 0d | 1 | 0.48mi |
| 289 Montego Cir Riverdale, GA | 3.0 | 2.0 | 1254 | $1,768 | $1.41 | 45d | 1 | 0.48mi |
| 7560 Taylor Rd #26 Riverdale, GA | 2.0 | 1.0 | 1158 | $1,250 | $1.08 | 45d | 1 | 0.53mi |
| 234 Montego Cir Riverdale, GA | 3.0 | 2.0 | 1122 | $1,615 | $1.44 | 26d | 1 | 0.56mi |
| 45 Christopher Pl Riverdale, GA | 3.0 | 2.5 | 1576 | $1,955 | $1.24 | 22d | 1 | 0.59mi |
| 7767 Park Ln Jonesboro, GA | 3.0 | 1.5 | 1065 | $1,660 | $1.56 | 45d | 1 | 0.69mi |
| 7799 Park Ln Jonesboro, GA | 3.0 | 1.5 | 1112 | $1,500 | $1.35 | 6d | 1 | 0.72mi |
| 7725 Newbury Dr Jonesboro, GA | 4.0 | 2.5 | 1844 | $1,800 | $0.98 | 45d | 1 | 0.73mi |
| 7943 Taylor Cir Riverdale, GA | 3.0 | 2.0 | 1344 | $1,665 | $1.24 | 45d | 1 | 0.75mi |
| 7800 Park Ln Jonesboro, GA | 3.0 | 1.5 | 1036 | $1,723 | $1.66 | 45d | 1 | 0.75mi |
| 206 Red Oak Dr Riverdale, GA | 3.0 | 2.0 | 1463 | $1,691 | $1.16 | 17d | 1 | 0.77mi |
| 8038 Flamingo Dr Jonesboro, GA | 3.0 | 1.5 | 1178 | $1,553 | $1.32 | 26d | 1 | 0.82mi |
| 14 Cardinal Ln Jonesboro, GA | 3.0 | 2.0 | 1118 | $1,446 | $1.29 | 0d | 1 | 0.83mi |
| 7432 Meadows Dr Riverdale, GA | 3.0 | 2.0 | 1640 | $1,716 | $1.05 | 7d | 1 | 0.88mi |
| 53 Skylark Ln Jonesboro, GA | 3.0 | 1.5 | 1176 | $1,595 | $1.36 | 26d | 1 | 0.88mi |
| 8150 Flamingo Dr Jonesboro, GA | 3.0 | 2.0 | 1092 | $1,615 | $1.48 | 0d | 1 | 0.91mi |
| 8050 Taylor Rd Riverdale, GA | 1.0–3.0 | 1.0–2.0 | 944 | $1,319 | $1.40 | 0d | 12 | 0.92mi |
| 7282 Williamsburg Dr Riverdale, GA | 3.0 | 2.5 | 1183 | $1,915 | $1.62 | 0d | 1 | 0.95mi |
| 100 Riverview Pl Jonesboro, GA | 1.0–3.0 | 1.0–2.0 | 1153 | $2,002 | $1.74 | 0d | 15 | 1.02mi |
| 8066 Woodlake Dr Riverdale, GA | 2.0 | 2.5 | 1280 | $1,505 | $1.18 | 5d | 1 | 1.03mi |
| 8147 Mountain Pass Riverdale, GA | 3.0 | 2.0 | 1432 | $1,935 | $1.35 | 0d | 1 | 1.05mi |
| 7438 Mockingbird Trl Riverdale, GA | 4.0 | 3.0 | 1784 | $1,925 | $1.08 | 26d | 1 | 1.05mi |
| 8078 Woodlake Dr Riverdale, GA | 2.0 | 2.5 | 1280 | $1,445 | $1.13 | 3d | 1 | 1.05mi |
| 8062 Creekstone Way Riverdale, GA | 2.0 | 2.5 | 1232 | $1,286 | $1.04 | 45d | 1 | 1.06mi |
| 537 Fielding Cir Riverdale, GA | 3.0 | 1.0 | 1025 | $1,465 | $1.43 | 26d | 1 | 1.09mi |
| 7074 Williamsburg Dr Riverdale, GA | 2.0 | 2.0 | 1032 | $1,461 | $1.42 | 4d | 1 | 1.10mi |
| 8183 Rhodes Way Riverdale, GA | 3.0 | 2.5 | 1650 | $1,945 | $1.18 | 21d | 1 | 1.12mi |
| 7016 Sun Valley Way Riverdale, GA | 3.0 | 2.0 | 950 | $1,456 | $1.53 | 14d | 1 | 1.12mi |
| 7157 Williamsburg Dr Riverdale, GA | 3.0 | 2.0 | 1374 | $1,700 | $1.24 | 6d | 1 | 1.13mi |
| 8195 Rhodes Way Riverdale, GA | 3.0 | 2.0 | 1546 | $2,090 | $1.35 | 26d | 1 | 1.15mi |
| 8194 Canyon Forge Dr Riverdale, GA | 3.0 | 2.5 | 1488 | $1,555 | $1.05 | 6d | 1 | 1.16mi |
| 8104 Webb Rd Riverdale, GA | 1.0–2.0 | 1.0–2.0 | 890 | $1,481 | $1.66 | 0d | 18 | 1.17mi |
| 8206 Huntington Dr Jonesboro, GA | 3.0 | 2.0 | 1275 | $1,520 | $1.19 | 0d | 1 | 1.18mi |
| 8226 Canyon Forge Dr Riverdale, GA | 3.0 | 2.5 | 1512 | $1,631 | $1.08 | 14d | 1 | 1.18mi |
| 7016 Adel Ln Riverdale, GA | 3.0 | 1.0 | 1092 | $1,500 | $1.37 | 45d | 1 | 1.19mi |
| 8238 Canyon Forge Dr Riverdale, GA | 2.0 | 2.5 | 1246 | $1,400 | $1.12 | 6d | 1 | 1.20mi |
| 394 Queen Aliese Ln Jonesboro, GA | 3.0 | 1.0 | 1350 | $1,550 | $1.15 | 45d | 1 | 1.21mi |
Listing history 12 events
-
2026-06-21statusdays on market $170,000 Active Under Contract 16 DOM
-
2026-06-18days on market $170,000 Active 13 DOM
-
2026-06-17days on market $170,000 Active 12 DOM
-
2026-06-16days on market $170,000 Active 11 DOM
-
2026-06-15days on market $170,000 Active 10 DOM
-
2026-06-13days on market $170,000 Active 8 DOM
-
2026-06-09days on market $170,000 Active 4 DOM
-
2026-06-08days on market $170,000 Active 3 DOM
-
2026-06-07statusdays on market $170,000 Active 2 DOM
-
2026-06-03$170,000 Coming Soon 1 DOM
-
2026-06-01remarks 261-char remark
-
2026-06-01$170,000 Coming Soon 1 DOM
ⓘ Source: listings_history table (triggers on properties + properties_extension) + one-shot
backfill from property_details.listing_events for pre-trigger history.
Tax reassessment forecast GA · Resets to sale price
- Current annual tax
- $526 · $44/mo
- Projected year-2 tax
- $1,564 · $130/mo
- Expected delta
- +$1,038/yr (+$86/mo · 197.1%)
ⓘ Screening estimate from a state-policy table — verify with the county assessor before closing.
Climate risk First Street
- Flood 1/10 Low FEMA zone X (unshaded) · 0% chance over 30 yrs
- Wildfire 3/10 Moderate
- Heat 5/10 Major 5 d/yr ≥105°F today · 13 d/yr by 30 yrs out
- Wind 6/10 Major 27% chance of damaging wind over 30 yrs
- Air quality 4/10 Moderate 4 unhealthy d/yr today · 6 by 30 yrs out
Nearby sold comps map
Loading sold comps map…
Walkable amenities ~0.75 mi
Loading nearby amenities…
Taxation est. · year 1
- Rental income
- $20,624
- − Mortgage interest
- −$9,523
- − Property taxes
- −$526
- − Insurance
- −$850
- − Repairs & maintenance
- −$1,650
- − Management
- −$1,650
- − Depreciation
- −$4,945
- Taxable income
- $1,479
- Est. tax owed @ 24.0%
- −$355
- After-tax cash flow
- $3,863/yr
For passive investors: Depreciation is non-cash, so a rental often shows a tax loss while cash-flowing — sheltering income. Rental losses are passive: they offset passive income freely, and up to $25,000/yr can offset ordinary (W-2) income if you actively participate and your MAGI is under $100k (phasing out to $0 by $150k); unused losses carry forward. On sale, claimed depreciation is recaptured at up to 25%, and gains may owe capital-gains tax (a 1031 exchange can defer both). Figures are a year-1 estimate at your 24.0% rate — not tax advice; consult a CPA.
Schools (NCES district)
- District
- Clayton County
- NCES district ID
- 1301230
- Math proficiency
- 11% ▼ -13.00%
- Reading proficiency
- 20% ▼ -9.00%
- Median HH income
- $42,266
- Composite
- 13.41/100
- National rank
- #9527
- State rank
- #155 of 174 in GA
Livability — Riverdale
- Score
- 70/100
- State rank
- #100
- US rank
- #7907
Category grades
Schools grade is shown separately in the Schools card above.
Census & demographics
- County
- Clayton County · 230,153 people
- City population
- 61,126
- Metro
- Atlanta-Sandy Springs-Alpharetta, GA
- Population (ZIP)
- 34,081
- Household income
- $52,209
- Rent vs Own
- Severe rent burden
- 2586.0
Population outlook (Clayton County) Hauer SSP2
- Today (2025)
- 310,777 people
- By 2030
- 329,762 · +6.1%
- By 2040
- 368,052 · +18.4%
- By 2050
- 401,196 · +29.1%
- By 2075
- 472,488 · +52.0%
- By 2100
- 500,446 · +61.0%
Race, ethnicity, and origin ACS 2023
- Neighborhood character
- Predominantly Black (76%)
- Race & ethnicity
- Black 76% Hispanic / Latino 14% Two or more races 5% Asian 5% White 5%
- Hispanic origin (detail)
- Mexican 9% Puerto Rican 1%
- Foreign-born
- 15% · Canada, Vietnam
- Languages at home
- 80% English-only · Spanish 12% Vietnamese 2% Other Asian/Pacific 2%
Political lean MEDSL · Clayton
- 2024 margin
- Solid D (+69.2) · D 84.3% · R 15.1%
- 2008→2024 swing
- +2.8pp toward D · 2008: 66.4pp · 2024: 69.2pp
- All cycles
- 2024: D+69.2 2020: D+70.9 2016: D+71.9 2012: D+70.1 2008: D+66.4
Not yet ingested
- Civics
- —
Market trends
- HPI YoY
- ▼ -57.82%
- Current HPI
- 236.3592
- Rent YoY
- ▲ 1.30%
- Metro
- Atlanta-Sandy Springs-Alpharetta, GA
- State GDP YoY
- ▲ 2.66%
- F500 in state
- 28
Industry mix (Fortune 500 HQ in GA)
| Industry | F500 HQs | Revenue |
|---|---|---|
| Paper / Packaging | 2 | $29B |
|
||
| Retail | 1 | $160B |
|
||
| Transportation / Logistics | 1 | $91B |
|
||
| Airlines | 1 | $62B |
|
||
| Consumer Goods | 1 | $47B |
|
||
| Utilities | 1 | $25B |
|
||
Price history
+127.1% since first listed2 events — show timeline
- 2026-06-01 Coming Soon $170,000 GAMLS
- 1993-02-02 Sold (Public Records) $74,866 Public Records
Property tax history
-5.0%/yrLatest (2025): $526 · +1.9% YoY. Source: county tax records.
Cash-flow waterfall
monthlySold comps — $/sqft
last 12 mo · ≤1 miLoading sold comps…