 Triplex
401 2nd Ave NE · Steele, ND
Flood risk No data
- FEMA flood zone
- —
- Chance of flooding over 30 yrs
- —
- Est. flood insurance / yr
- —
Fire risk No data
- Est. fire insurance / yr
- —
Heat risk No data
- Hot days now (above threshold)
- —
- Hot days in 30 yrs
- —
Wind risk No data
- Chance of severe wind over 30 yrs
- —
Air-quality risk No data
- Unhealthy air days now
- —
- Unhealthy air days in 30 yrs
- —
Risk factors via First Street. Map © Google.
Why this score? — see what drove the D+ grade
The composite is a weighted blend of 9 inputs, each scored 0–100. Each bar is that input's sub-score; the figure is the points it added to the 100-point composite (weight × sub-score).
- Cash flow +13.9/30.0
- Appreciation +8.9/10.0
- ARV discount +7.5/15.0
- DSCR +4.2/10.0
- 1% rule +3.9/10.0
- Schools +3.5/10.0
- Livability +3.4/5.0
- Rent growth +2.5/5.0
- Condition / age +2.2/5.0
$400,000
🖨 Deal sheet 📄 Offer letter ✓ Due diligence
Multi-family units
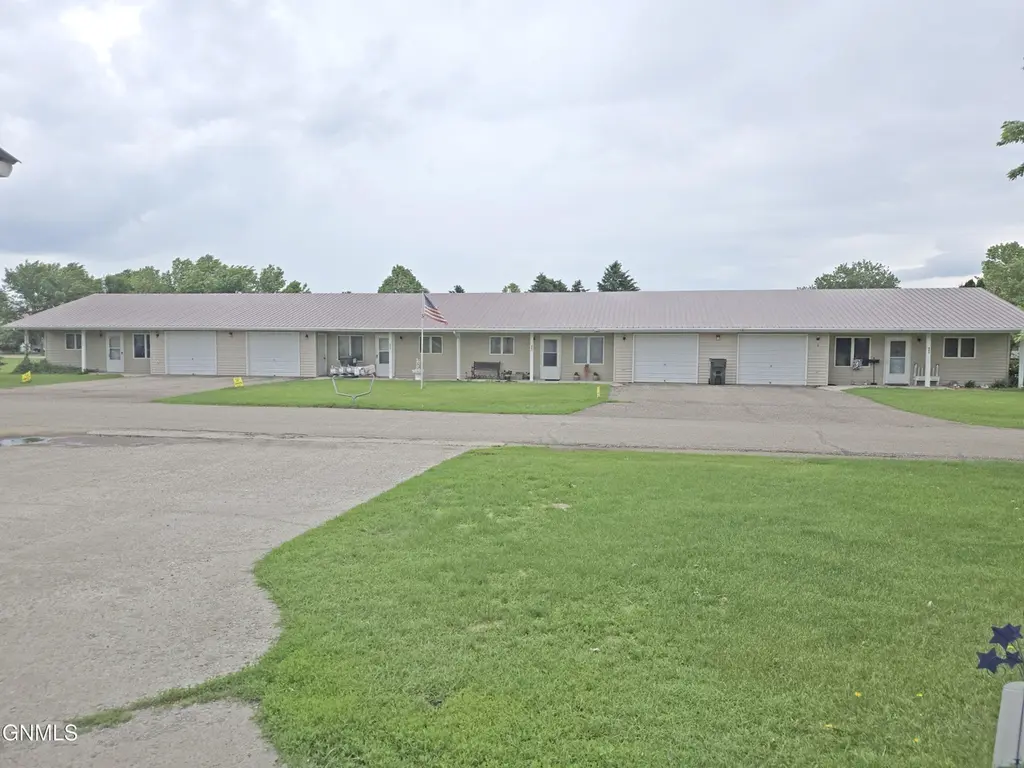
County records classify this as Multi-Family (2-4 Unit). Listing-text estimate: 3 units. confirmed
Key facts
- Individual garages
- Vinyl siding
- Newer metal roof
Tags
Property features AI
Exterior
- Parking: Attached garage with 4 spaces
- Utilities: Public water; Public sewer; Natural gas available; Electricity connected
- Home design: One-story quadruplex (residential income property)
- Construction: Vinyl siding; Slab foundation; Built as a residential income quadruplex
- Exterior features: Metal roof; Rectangular lot; Paved city street frontage; Publicly maintained road
Interior
- Kitchen: Range; Refrigerator
- Bedrooms: 7 total rooms (includes bedrooms and living areas)
- Flooring: Vinyl; Carpet; Laminate
- Bathrooms: 4 full bathrooms
- Heating & cooling: Forced air heating (natural gas); Wall/window cooling units
- Interior features: Range; Refrigerator; Rain gutters
- Laundry & utility: Natural gas available; Electricity connected; Water connected; Sewer connected
Neighborhood map
What this means for you Summary
Snapshot
- This is a 3 × 3-bed/1.3-bath units multifamily listed at $400k. Condition is rated fair.
Deal economics
- At list price, monthly cash flow is $43 ($511/yr) — positive. Per door: $14/mo.
- The deal already cash-flows at list — no discount required.
- To meet the 1% rule (rent ≥ 1% of price), the offer needs to be $355k (11.2% below list).
- Recommended offer: $355k (11.2% below list) — sets the bar for 1% rule.
Location & tenants
- Location reads 68/100 on livability (#109 in ND) — a middle-class / working-renter tenant base. Strengths: crime A+, cost of living A+, housing A-; Watch: schools D+, amenities F, commute F.
- Kidder County 1 (rural): math 35% / reading 40% proficiency, ranked #117 of 169 in ND (top 69%) — families likely to look elsewhere, expect single-tenant / working-renter base with shorter leases.
- Market conditions: 2 active listings in the ZIP.
Forward outlook
- In year one you build about $34k of equity ($3k loan paydown + $31k appreciation (7.8% local appreciation)).
- Kidder County population projected to shrink 8% by 2050 — rents likely to lag national; underwrite the cash flow, not the appreciation.
- At projected returns (7.8% appreciation + 3.0% rent growth), your $112k cash investment doubles in ~3 years — after that, you're playing with house money.
- By year 2, paydown + projected appreciation supports a ~$55k cash-out refi (75% LTV) — recoverable capital for the next deal without selling this one.
Negotiation context
- Only 6 days on market — expect competitive offers; lowballing is unlikely to land.
Questions for the listing agent
- Can we see the unit-by-unit rent roll, current vacancy, and any below-market leases? What's the average tenancy length?
- What capital expenditures (roof, boiler, parking lot, exteriors) have been made in the last 5 years, and what's planned in the next 2?
- Have any recent inspections been done? Can we get a copy of the seller's disclosures and any deferred-maintenance estimates?
- Is there a deadline driving the sale (1031 exchange, divorce, estate, relocation)? That informs how much negotiation room exists.
- Schools are D-rated, which usually means shorter tenancies and higher turnover. Who's the typical renter profile here, and what's been the actual vacancy rate?
- The area grade is low — what's the realistic commute time and amenity access for the typical tenant pool here? Any planned neighborhood developments (good or bad) we should know about?
- What's the average days-on-market for RENTAL listings here right now (not sales)? A rising rental-DOM trend means longer vacancies and softer asking-rent achievability than the comps imply.
- What's the recent tenant-quality profile in this submarket — average credit score on applications, eviction rate, late-payment / NSF rate, and stable-employment percentage? A property-management company in the area should have these aggregated.
- How much new apartment / multifamily construction is in the pipeline within 1–3 miles? Heavy new supply (>2% of stock underway) typically softens rents 12–24 months out; light construction supports rent growth.
Investment metrics
- 1% rule
- 0.89% ✗
- Cap rate
- 6.42%
- Cash-on-cash
- 0.46%
- DSCR
- 1.02
- GRM
- 9.4
CMA / ARV
No comps found within radius.
Projected returns pro-forma
7.83% appreciation · 3.0% rent growth · sell at horizon
- IRR
- 20.0%
- Equity multiple
- 2.46×
- Total profit
- $163,239
- Equity at exit
- $299,314
- IRR
- 18.6%
- Equity multiple
- 5.21×
- Total profit
- $471,596
- Equity at exit
- $589,822
Cash invested: $112,000 (down + closing). Projections, not guarantees.
Landlord ↔ Tenant lean methodology
- Overall (STATE)
- 82 Strongly Landlord-Friendly
- State North Dakota
- 82 Strongly Landlord-Friendly · R+20
- County
- — inherits STATE
- City
- — inherits STATE
ZIP-level market 58482
- Home prices YoY
- 5.7%
- Active inventory
- 2
- Price-to-rent
- 28.1×
Monthly cashflow live
- Estimated rent
- $3,553 medium interval (Pro) →
- Mortgage (P&I)
- −$2,098
- Tax est. 1.5%
- −$500 /mo · $6,000/yr
- Insurance
- −$167
- HOA
- −$0
- Vacancy / Maint / Mgmt
- −$746
- Net cashflow
- $43
Break-even live
3-unit breakdown (identical units grouped — click to expand)
| Units | Beds | Baths | Est. rent |
|---|---|---|---|
| 3× units | 3 | 1.3 | $3,552 |
| #1 | 3 | 1.3 | $1,184 |
| #2 | 3 | 1.3 | $1,184 |
| #3 | 3 | 1.3 | $1,184 |
| Total (3 units) | $3,553 | ||
UW: 25.0% down · 7.5% · 30yr · 1.5% tax · 5.0% vac · 8.0% maint · 8.0% mgmt
Financing live
Cash to close
- Down payment
- $100,000
- Closing costs
- $12,000
- Reserves months
- —
- Total cash needed
- —
Loan-product check · same deal, 3 products live
Conventional
25% down · 7.5% · 30yr
- Down + closing
- —
- Monthly P&I
- —
- Monthly cashflow
- —
- DSCR
- —
- Eligible?
- —
Personal DTI + credit; lowest rate.
DSCR
20% down · 8.5% · 30yr
- Down + closing
- —
- Monthly P&I
- —
- Monthly cashflow
- —
- DSCR
- —
- Eligible?
- —
No personal income docs; deal must DSCR.
Hard money
10% down · 12.0% · 12mo
- Down + closing
- —
- Monthly P&I
- —
- Monthly cashflow
- —
- DSCR
- —
- Eligible?
- —
Short-term bridge; refi at stabilization.
Listing history 5 events
-
2026-06-18days on market $400,000 Active 6 DOM
-
2026-06-17days on market $400,000 Active 5 DOM
-
2026-06-16days on market $400,000 Active 4 DOM
-
2026-06-15days on market $400,000 Active 3 DOM
-
2026-06-13$400,000 Active 1 DOM
ⓘ Source: listings_history table (triggers on properties + properties_extension) + one-shot
backfill from property_details.listing_events for pre-trigger history.
Nearby sold comps map
Loading sold comps map…
Walkable amenities ~0.75 mi
Loading nearby amenities…
Taxation est. · year 1
- Rental income
- $42,636
- − Mortgage interest
- −$22,406
- − Property taxes
- −$6,000
- − Insurance
- −$2,000
- − Repairs & maintenance
- −$3,411
- − Management
- −$3,411
- − Depreciation
- −$11,636
- Taxable loss
- −$6,228
- Est. tax savings @ 24.0%
- +$1,495
- After-tax cash flow
- $2,006/yr
For passive investors: Depreciation is non-cash, so a rental often shows a tax loss while cash-flowing — sheltering income. Rental losses are passive: they offset passive income freely, and up to $25,000/yr can offset ordinary (W-2) income if you actively participate and your MAGI is under $100k (phasing out to $0 by $150k); unused losses carry forward. On sale, claimed depreciation is recaptured at up to 25%, and gains may owe capital-gains tax (a 1031 exchange can defer both). Figures are a year-1 estimate at your 24.0% rate — not tax advice; consult a CPA.
Condition & rehab AI · 12 photos
This multi-family property requires moderate renovations to update the kitchen and bathrooms, and improve the exterior and landscaping. These updates will significantly increase its resale and rental value.
Repairs flagged
- Moderate kitchen cabinets — dated and in need of replacement
- Moderate kitchen appliances — dated and in need of replacement
- Moderate kitchen flooring — dated and in need of replacement
- Moderate bathroom fixtures — basic and in need of replacement
- Moderate exterior siding — moderate wear
Value-add opportunities
- Both update kitchen with new cabinets and appliances — modern kitchen will attract more buyers and renters
- Both update bathrooms with new fixtures and decor — modern bathrooms will attract more buyers and renters
- Both landscape and improve curb appeal — improved curb appeal will attract more buyers and renters
Renovation cost estimate screening
| Repair item | Severity | Est. cost |
|---|---|---|
| kitchen cabinets · dated and in need of replacement | Moderate | $3,000–15,000 |
| kitchen appliances · dated and in need of replacement | Moderate | $3,000–15,000 |
| kitchen flooring · dated and in need of replacement | Moderate | $3,000–15,000 |
| bathroom fixtures · basic and in need of replacement | Moderate | $3,000–15,000 |
| exterior siding · moderate wear | Moderate | $3,000–15,000 |
| Total estimated repair cost · 5 items | $15,000–75,000 |
Value-add ROI direction
- Both update kitchen with new cabinets and appliances — modern kitchen will attract more buyers and renters ↑
- Both update bathrooms with new fixtures and decor — modern bathrooms will attract more buyers and renters ↑
- Both landscape and improve curb appeal — improved curb appeal will attract more buyers and renters ↑
ⓘ Cost ranges are severity-bucket heuristics (US national rule-of-thumb). Get contractor quotes + a written scope before underwriting a rehab budget.
Schools (NCES district)
- District
- Kidder County 1
- NCES district ID
- 3800389
- Math proficiency
- 35% ▼ -5.00%
- Reading proficiency
- 40% ▬ 0.00%
- Median HH income
- $47,134
- Composite
- 34.67/100
- National rank
- #10068
- State rank
- #117 of 169 in ND
Livability — Steele
- Score
- 68/100
- State rank
- #109
- US rank
- #9477
Category grades
Schools grade is shown separately in the Schools card above.
Census & demographics
- Census place
- Steele, ND
- Population (ZIP)
- 892
Population outlook (Kidder County) Hauer SSP2
- Today (2025)
- 2,373 people
- By 2030
- 2,333 · -1.7%
- By 2040
- 2,232 · -5.9%
- By 2050
- 2,181 · -8.1%
- By 2075
- 2,206 · -7.0%
- By 2100
- 2,357 · -0.7%
Race, ethnicity, and origin ACS 2023
- Neighborhood character
- Predominantly White (94%)
- Race & ethnicity
- White 94% Hispanic / Latino 4% Two or more races 2%
- Common ancestry
- Portuguese 18% Scotch-Irish 6% Romanian 2%
- Foreign-born
- 1% · Canada
- Languages at home
- 97% English-only · Spanish 2%
Political lean MEDSL · Kidder
- 2024 margin
- Solid R (+64.6) · D 17.1% · R 81.7% · Other 1.1%
- 2008→2024 swing
- -37.8pp toward R · 2008: -26.9pp · 2024: -64.6pp
- All cycles
- 2024: R+64.6 2020: R+68.1 2016: R+68.3 2012: R+36.4 2008: R+26.9
Not yet ingested
- Civics
- —
Market trends
- HPI YoY
- ▲ 7.83%
- Current HPI
- 146.3512
- Rent YoY
- —
- Metro
- —
- State GDP YoY
- ▲ 2.09%
- F500 in state
- 2
Industry mix (Fortune 500 HQ in ND)
| Industry | F500 HQs | Revenue |
|---|---|---|
| Utilities / Construction | 1 | $6B |
|
||
Price history
1 event — show timeline
- 2026-06-12 Listed $400,000 GNMLS
Cash-flow waterfall
monthlySold comps — $/sqft
last 12 mo · ≤1 miLoading sold comps…