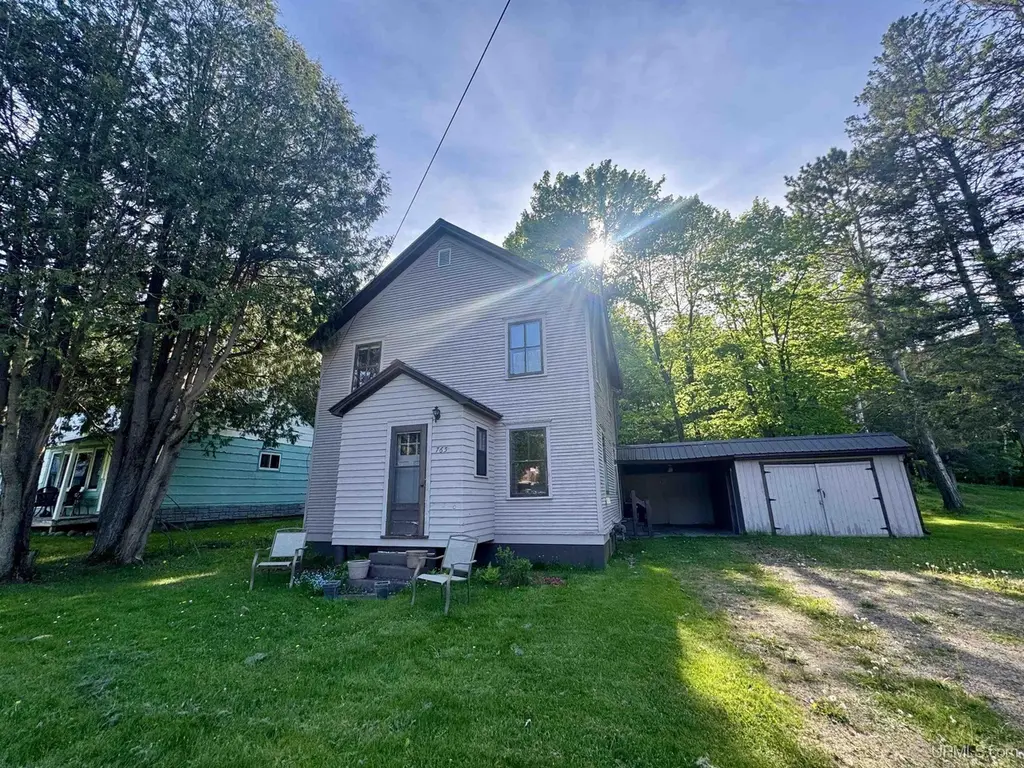
765 W Ice Lake Rd · Iron River, MI
Flood risk No data
- FEMA flood zone
- —
- Chance of flooding over 30 yrs
- —
- Est. flood insurance / yr
- —
Fire risk No data
- Est. fire insurance / yr
- —
Heat risk No data
- Hot days now (above threshold)
- —
- Hot days in 30 yrs
- —
Wind risk No data
- Chance of severe wind over 30 yrs
- —
Air-quality risk No data
- Unhealthy air days now
- —
- Unhealthy air days in 30 yrs
- —
Risk factors via First Street. Map © Google.
Why this score? — see what drove the B+ grade
The composite is a weighted blend of 9 inputs, each scored 0–100. Each bar is that input's sub-score; the figure is the points it added to the 100-point composite (weight × sub-score).
- Cash flow +30.0/30.0
- ARV discount +15.0/15.0
- 1% rule +10.0/10.0
- DSCR +10.0/10.0
- Livability +3.7/5.0
- Schools +3.5/10.0
- Rent growth +2.5/5.0
- Condition / age +2.5/5.0
- Appreciation +0.0/10.0
$64,500
🖨 Deal sheet (PDF) 📄 Offer letter ✓ Due diligence
Listing remarks
Welcome to this solid 3-bedroom, 2-bath home in a great location near the hospital and other local amenities. This home has a poured concrete foundation and a metal roof. It offers a blend of old character and some modern updates. The main floor features a spacious living room, a full bathroom, and a bedroom for easy one-level living. Upstairs, you'll find two additional bedrooms, a 3/4 bathroom, and a large landing area that provides the perfect space for a home office or playroom. The kitchen comes equipped with brand-new appliances, while tasteful modern touches throughout the home add to its appeal. Outside, you'll appreciate the detached garage with an attached carport area, offering
Key facts
- Large landing area
- Brand new appliances
- Spacious living room
Tags
Property features AI
Finance
- Other: Lot approx. 0.51 acre (frontage approx. 100')
Exterior
- Parking: Detached garage and carport; Garage with 1 parking space; Additional parking for 2 vehicles
- Utilities: 100 amp electric service; Natural gas available; natural gas water heater; Public water; Public sanitary sewer; Electricity, natural gas, sewer and water available
- Home design: Residential 1.5-story home; Built in 1920; Entry facing road
- Construction: Poured foundation; Built 1920; Wood construction
- Exterior features: Wood exterior; Property within city limits; Rural view; Frontage on road; Outbuildings: garage(s); Year-round city/county roads
Interior
- Kitchen: Range/Oven; Refrigerator; Kitchen on main level (approx. 13 x 10)
- Bedrooms: Main-level bedroom (10 x 9); Upper-level bedroom (10 x 12); Upper-level bedroom (approx. 10 wide)
- Bathrooms: Two total bathrooms (1 full); Main-level lavatory approx. 7 x 4; Upper-level bathroom approx. 8 x 7
- Heating & cooling: Forced air heating; No central cooling
- Interior features: Furnished; Has basement (poured foundation)
- Laundry & utility: Basement provides utility space
Neighborhood map
What this means for you Summary
Snapshot
- This is a 3-bed/1.5-bath single-family listed at $64k.
Deal economics
- At list price, monthly cash flow is $360 ($4k/yr) — positive.
- The deal already cash-flows at list — no discount required.
- Meets the 1% rule at list price ($1k rent vs $64k).
- Recommended offer: $64k (1.5% below list) — sets the bar for market timing.
- Cap rate 13.0% vs local median 5.6% in Iron River — top-decile yield for the area; either an underpriced asset or a hidden risk that comps aren't pricing in. Stress-test before assuming the spread holds.
Location & tenants
- Location reads 73/100 on livability (#206 in MI) — a middle-class / working-renter tenant base. Strengths: cost of living A+, housing A+, health & safety A+; Watch: schools D, amenities F, commute F.
- West Iron County Public Schools (town): math 38% / reading 46% proficiency, ranked #204 of 540 in MI (top 38%) — families likely to look elsewhere, expect single-tenant / working-renter base with shorter leases.
- Market conditions: 133 active listings in the ZIP; 156 units permitted in Iron County in 2024 (0 in 5+ unit buildings).
Forward outlook
- Local home prices are declining (-3.0%/yr); year-one equity from $446 of loan paydown is wiped out by about $2k of value loss. Plan a longer hold.
- Iron County population projected at -26% by 2050 — secular population decline; favor cash flow + early exit over multi-decade hold.
- At projected returns (-3.0% appreciation + 3.0% rent growth), your $18k cash investment doubles in ~6 years — after that, you're playing with house money.
Negotiation context
- It's been on market 16 days — a 2% lower offer ($64k) is reasonable based on typical stale-listing flexibility.
- 5 sale attempts since 5y ago with the ask held roughly flat each time — persistent listings suggest the price (not the market) is what's stuck; bring a comps-based counter.
- Current owner paid $11k; list at $64k implies a 486% gain — meaningful room to come down on a strong offer.
Risks & watch-outs
- Watch-outs: built in 1920 — expect roof / HVAC / electrical / plumbing capex.
Questions for the listing agent
- Built in 1920 — when were the roof, HVAC, electrical panel, plumbing, and water heater last replaced?
- Is there a deadline driving the sale (1031 exchange, divorce, estate, relocation)? That informs how much negotiation room exists.
- Schools are D-rated, which usually means shorter tenancies and higher turnover. Who's the typical renter profile here, and what's been the actual vacancy rate?
- What's the average days-on-market for RENTAL listings here right now (not sales)? A rising rental-DOM trend means longer vacancies and softer asking-rent achievability than the comps imply.
- What's the recent tenant-quality profile in this submarket — average credit score on applications, eviction rate, late-payment / NSF rate, and stable-employment percentage? A property-management company in the area should have these aggregated.
- How much new for-sale + rental construction is in the pipeline within 1–3 miles? Heavy new supply typically softens prices + rents 12–24 months out; constrained supply supports both.
Investment metrics
- 1% rule
- 1.66% ✓
- Cap rate
- 12.98%
- Cash-on-cash
- 23.89%
- DSCR
- 2.06
- GRM
- 5.0
CMA / ARV
- ARV (on-the-fly)
- $115,758
- Comps found
- 7
Show comp detail 7 sales within ~0.75 mi
| Address | Dist | Beds/Ba | Sqft | Sold | Price | $/sf | Match |
|---|---|---|---|---|---|---|---|
| 110 W Hunter Rd | 0.48mi | 3/2.5 | 1,104 (+4%) | 10mo | $185,000 | $168 | 59 |
| 604 Cherry St | 0.74mi | 3/1.5 | 1,104 (+4%) | 8mo | $185,000 | $168 | 52 |
| 133 E Hunter Rd | 0.48mi | 3/1.5 | 988 (-7%) | 20mo | $142,500 | $144 | 50 |
| 111 E Hunter Rd | 0.51mi | 4/1.0 (+1) | 918 (-14%) | 7mo | $100,000 | $109 | 41 |
| 413 Blossom St | 0.70mi | 3/1.0 | 1,120 (+6%) | 20mo | $80,000 | $71 | 39 |
| 416 Amber St | 0.67mi | 4/1.0 (+1) | 1,155 (+9%) | 16mo | $21,000 | $18 | 33 |
| 416 Amber St | 0.67mi | 4/1.0 (+1) | 1,155 (+9%) | 16mo | $21,000 | $18 | 33 |
Match score weights: distance 35% · size 25% · config 20% · recency 20%. Top-matched comps best support the ARV.
Projected returns pro-forma
-3.0% appreciation · 3.0% rent growth · sell at horizon
- IRR
- 17.1%
- Equity multiple
- 1.69×
- Total profit
- $12,489
- Equity at exit
- $9,617
- IRR
- 25.7%
- Equity multiple
- 3.24×
- Total profit
- $40,527
- Equity at exit
- $5,577
Cash invested: $18,060 (down + closing). Projections, not guarantees.
Landlord ↔ Tenant lean methodology
- Overall (STATE)
- 62 Landlord-Friendly
- State Michigan
- 62 Landlord-Friendly · EVEN
- County
- — inherits STATE
- City
- — inherits STATE
ZIP-level market 49935
- Home prices YoY
- -28.7%
- Active inventory
- 133
- Price-to-rent
- 5.0×
Monthly cashflow live
- Estimated rent
- $1,069 medium interval (Pro) →
- Mortgage (P&I)
- −$338
- Tax from tax record
- −$120 /mo · $1,440/yr
- Insurance
- −$27
- HOA
- −$0
- Vacancy / Maint / Mgmt
- −$225
- Net cashflow
- $360
Break-even live
Sensitivity live
| Price | -10% $396 | -5% $378 | +0% $360 | +5% $341 | +10% $323 |
|---|---|---|---|---|---|
| Rent | -10% $275 | -5% $317 | +0% $360 | +5% $402 | +10% $444 |
| Rate | -1.0pp $392 | -0.5pp $376 | base $360 | +0.5pp $343 | +1.0pp $326 |
UW: 25.0% down · 7.5% · 30yr · 1.5% tax · 5.0% vac · 8.0% maint · 8.0% mgmt
Financing live
Cash to close
- Down payment
- $16,125
- Closing costs
- $1,935
- Reserves months
- —
- Total cash needed
- —
Loan-product check · same deal, 3 products live
Conventional
25% down · 7.5% · 30yr
- Down + closing
- —
- Monthly P&I
- —
- Monthly cashflow
- —
- DSCR
- —
- Eligible?
- —
Personal DTI + credit; lowest rate.
DSCR
20% down · 8.5% · 30yr
- Down + closing
- —
- Monthly P&I
- —
- Monthly cashflow
- —
- DSCR
- —
- Eligible?
- —
No personal income docs; deal must DSCR.
Hard money
10% down · 12.0% · 12mo
- Down + closing
- —
- Monthly P&I
- —
- Monthly cashflow
- —
- DSCR
- —
- Eligible?
- —
Short-term bridge; refi at stabilization.
Listing history 12 events
-
2026-06-21days on market $64,500 Active 16 DOM
-
2026-06-18days on market $64,500 Active 14 DOM
-
2026-06-17days on market $64,500 Active 13 DOM
-
2026-06-16days on market $64,500 Active 12 DOM
-
2026-06-15days on market $64,500 Active 11 DOM
-
2026-06-13days on market $64,500 Active 9 DOM
-
2026-06-12days on market $64,500 Active 8 DOM
-
2026-06-09days on market $64,500 Active 5 DOM
-
2026-06-08days on market $64,500 Active 4 DOM
-
2026-06-07days on market $64,500 Active 3 DOM
-
2026-06-07remarks 699-char remark
-
2026-06-07$64,500 Active 2 DOM
ⓘ Source: listings_history table (triggers on properties + properties_extension) + one-shot
backfill from property_details.listing_events for pre-trigger history.
Tax reassessment forecast MI · Partial reset (capped growth)
- Current annual tax
- $1,440 · $120/mo
- Projected year-2 tax
- $1,440 · $120/mo
- Expected delta
- $0/yr ($0/mo · 0.0%)
ⓘ Screening estimate from a state-policy table — verify with the county assessor before closing.
Nearby sold comps map
Loading sold comps map…
Walkable amenities ~0.75 mi
Loading nearby amenities…
Taxation est. · year 1
- Rental income
- $12,831
- − Mortgage interest
- −$3,613
- − Property taxes
- −$1,440
- − Insurance
- −$322
- − Repairs & maintenance
- −$1,026
- − Management
- −$1,026
- − Depreciation
- −$1,876
- Taxable income
- $3,526
- Est. tax owed @ 24.0%
- −$846
- After-tax cash flow
- $3,468/yr
For passive investors: Depreciation is non-cash, so a rental often shows a tax loss while cash-flowing — sheltering income. Rental losses are passive: they offset passive income freely, and up to $25,000/yr can offset ordinary (W-2) income if you actively participate and your MAGI is under $100k (phasing out to $0 by $150k); unused losses carry forward. On sale, claimed depreciation is recaptured at up to 25%, and gains may owe capital-gains tax (a 1031 exchange can defer both). Figures are a year-1 estimate at your 24.0% rate — not tax advice; consult a CPA.
Schools (NCES district)
- District
- West Iron County Public Schools
- NCES district ID
- 2632910
- Math proficiency
- 38% ▲ 2.00%
- Reading proficiency
- 46% ▲ 1.00%
- Median HH income
- $33,390
- Composite
- 34.54/100
- National rank
- #5175
- State rank
- #204 of 540 in MI
Livability — Iron River
- Score
- 73/100
- State rank
- #206
- US rank
- #5207
Category grades
Schools grade is shown separately in the Schools card above.
Census & demographics
- Census place
- Iron River, MI
- Population (ZIP)
- 5,969
Population outlook (Iron County) Hauer SSP2
- Today (2025)
- 10,485 people
- By 2030
- 9,914 · -5.4%
- By 2040
- 8,698 · -17.0%
- By 2050
- 7,742 · -26.2%
- By 2075
- 6,485 · -38.1%
- By 2100
- 5,396 · -48.5%
Race, ethnicity, and origin ACS 2023
- Neighborhood character
- Predominantly White (94%)
- Race & ethnicity
- White 94% Hispanic / Latino 2% Two or more races 2% Native American 1%
- Common ancestry
- Romanian 10% Lithuanian 6% Portuguese 5%
- Foreign-born
- 1% · Canada, Jamaica, China
- Languages at home
- 98% English-only · Spanish 1%
Political lean MEDSL · Iron
- 2024 margin
- Strong R (+29.3) · D 34.7% · R 64.0% · Other 1.2%
- 2008→2024 swing
- -31.5pp toward R · 2008: 2.1pp · 2024: -29.3pp
- All cycles
- 2024: R+29.3 2020: R+25.4 2016: R+28.3 2012: R+9.0 2008: D+2.1
Not yet ingested
- Civics
- —
Market trends
- HPI YoY
- ▼ -90.38%
- Current HPI
- 224.8101
- Rent YoY
- —
- Metro
- —
- State GDP YoY
- ▲ 1.37%
- F500 in state
- 28
Industry mix (Fortune 500 HQ in MI)
| Industry | F500 HQs | Revenue |
|---|---|---|
| Automotive Parts | 3 | $48B |
|
||
| Automotive | 2 | $372B |
|
||
| Chemicals | 1 | $45B |
|
||
| Automotive Retail | 1 | $29B |
|
||
| Healthcare / Medical Devices | 1 | $23B |
|
||
| Automotive Technology | 1 | $20B |
|
||
Price history
+545.0% since first listed10 events — show timeline
- 2026-06-03 Listed $64,500 MiRealSource-MiMLS
- 2026-03-13 Listing Removed — REALCOMP
- 2026-03-13 Listing Removed — MiRealSource-MiMLS
- 2025-09-15 Listed $79,900 REALCOMP
- 2025-09-15 Listed $79,900 MiRealSource-MiMLS
- 2021-11-05 Sold (MLS) $11,000 UPAR
- 2021-11-05 Sold (MLS) $11,000 MiRealSource-MiMLS
- 2021-11-02 Sold (Public Records) $11,000 Public Records
- 2021-10-11 Listed $10,000 UPAR
- 2021-10-11 Listed $10,000 MiRealSource-MiMLS
Property tax history
+7.3%/yrLatest (2025): $1,440 · +14.9% YoY. Source: county tax records.
Cash-flow waterfall
monthlySold comps — $/sqft
last 12 mo · ≤1 miLoading sold comps…