 Triplex
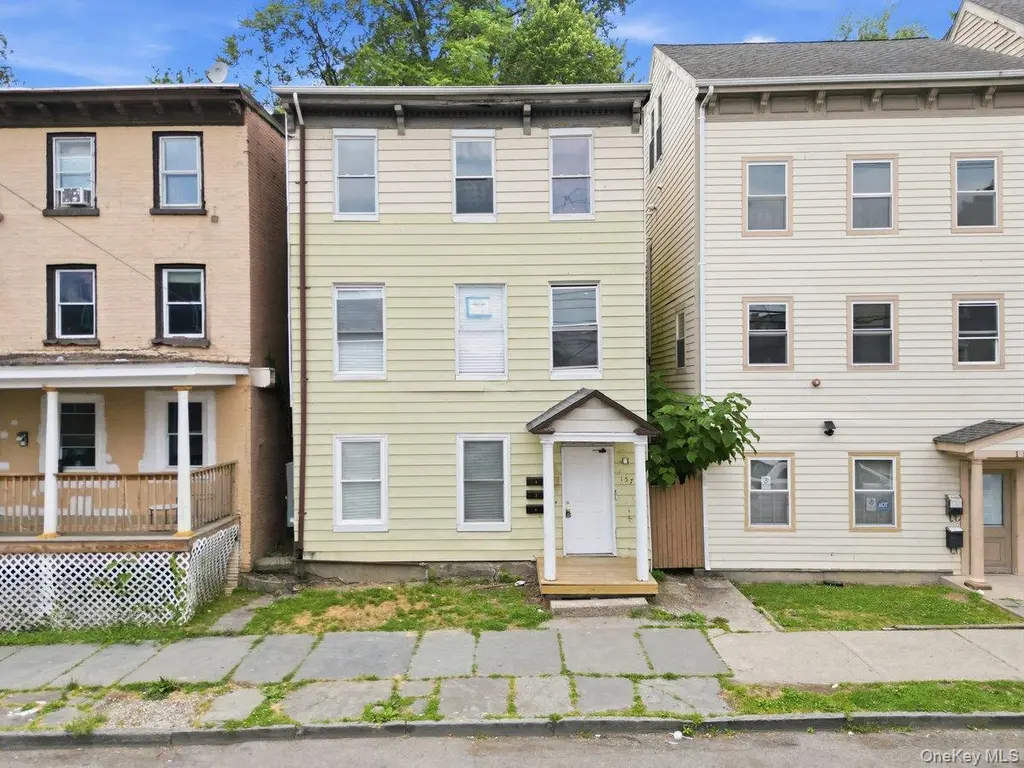
157 Chambers St · Newburgh, NY
Flood risk 1/10 · Minimal
- FEMA flood zone
- X (unshaded)
- Chance of flooding over 30 yrs
- 0.0%
- Est. flood insurance / yr
- $473 – $860
Fire risk 2/10 · Minimal
- Est. fire insurance / yr
- $691 – $1,283
Heat risk 5/10 · Moderate
- Hot days now (above 100°F)
- 7 days/yr
- Hot days in 30 yrs
- 16 days/yr
Wind risk 4/10 · Minor
- Chance of severe wind over 30 yrs
- 13.0%
Air-quality risk 3/10 · Minor
- Unhealthy air days now
- 2 days/yr
- Unhealthy air days in 30 yrs
- 3 days/yr
Risk factors via First Street. Map © Google.
Why this score? — see what drove the D+ grade
The composite is a weighted blend of 9 inputs, each scored 0–100. Each bar is that input's sub-score; the figure is the points it added to the 100-point composite (weight × sub-score).
- Cash flow +23.6/30.0
- DSCR +7.6/10.0
- 1% rule +6.2/10.0
- Schools +3.5/10.0
- Livability +3.1/5.0
- Rent growth +2.7/5.0
- Condition / age +2.5/5.0
- ARV discount +0.0/15.0
- Appreciation +0.0/10.0
$499,000
🖨 Deal sheet (PDF) 📄 Offer letter ✓ Due diligence
Multi-family units
County records classify this as Multi-Family (2-4 Unit). Listing-text estimate: 3 units. confirmed
Listing remarks MLS
Attention investors! Three unit home in city of Newburgh near most shopping, schools and amenities! House needs extensive work throughout; but outstanding opportunity for rehab. SOLD AS-IS. BUYER TO PAY NYS TRANSFER TAX. CASH OFFERS ONLY W/ PROOF OF FUNDS. * * * USE SHOWING ASSIST FOR ACCESS/SHOWING INFO. OR SEE MEMBER'S REMARKS, BELOW. * * *
Key facts
- Stylish cabinetry
- Quartz countertops
- Historic east end
Tags
Property features AI
Exterior
- Parking: No designated parking or carport
- Utilities: Electricity connected (Orange & Rockland); Natural gas connected; Public sewer; Water connected
- Home design: Triplex; Actual condition reported
- Construction: Stone construction; Stone foundation
- Exterior features: Back yard
Interior
- Kitchen: Chef's kitchen; Breakfast bar
- Bedrooms: Three 2-bedroom units
- Flooring: Carpet; Laminate
- Bathrooms: Three full bathrooms
- Heating & cooling: Natural gas heating; Wall/window air conditioning units
- Interior features: First-floor bedroom; First-floor full bathroom; Breakfast bar; Chef's kitchen; Aluminum-framed windows; Bilco door(s) to crawl space basement
- Laundry & utility: Washer hookup; Gas dryer hookup
Neighborhood map
What this means for you Summary
Snapshot
- This is a 3 × 2-bed/1.0-bath units multifamily listed at $499k.
Deal economics
- At list price, monthly cash flow is $938 ($11k/yr) — positive. Per door: $313/mo.
- The deal already cash-flows at list — no discount required.
- Meets the 1% rule at list price ($6k rent vs $499k).
- Cap rate 8.5% vs local median 4.4% in Newburgh — top-decile yield for the area; either an underpriced asset or a hidden risk that comps aren't pricing in. Stress-test before assuming the spread holds.
Location & tenants
- Location reads 62/100 on livability (#878 in NY) — a middle-class / working-renter tenant base. Strengths: health & safety A+, housing B+, cost of living B; Watch: employment D+, crime F, amenities F.
- Newburgh City School District (suburban): math 33% / reading 48% proficiency, ranked #500 of 590 in NY (top 85%) — families likely to look elsewhere, expect single-tenant / working-renter base with shorter leases; 61% free/reduced lunch — lower-income household profile, screen leases tightly.
- Zoned schools: Newburgh Free Academy (math 76% / reading 85%, grade A, #506 of 1,100 statewide, top 46%, 3,433 students, 56% FRL).
- Zoned-school proficiency averages 80% at this address vs 40% district-wide (+40 pts) — the actual schools serving this property are materially stronger than the Newburgh City School District average implies; a family-tenant draw the district grade alone would hide.
- Market conditions: Rents flat; 383 active listings in the ZIP; 1 comparable units currently listed for rent nearby; solid renter incomes; 1,746 units permitted in Orange County in 2024 (1,265 in 5+ unit buildings).
- At $5,595/mo this rent would consume 78% of the median local household income ($86k/yr) (locally 2412% of renters already pay >50% of income on rent) — very limited rent-growth headroom before tenants either downsize or default.
Forward outlook
- Local home prices are declining (-3.0%/yr); year-one equity from $3k of loan paydown is wiped out by about $15k of value loss. Plan a longer hold.
Negotiation context
- Only 9 days on market — expect competitive offers; lowballing is unlikely to land.
- 2 sale attempts since 16y ago with the ask held roughly flat each time — persistent listings suggest the price (not the market) is what's stuck; bring a comps-based counter.
- Current owner paid $275k; list at $499k implies a 81% gain — meaningful room to come down on a strong offer.
Risks & watch-outs
- Watch-outs: built in 1900 — expect roof / HVAC / electrical / plumbing capex.
- Climate carrying-cost: extreme-heat days projected 7→16/yr by 2055 (HVAC capex compounding) — expect insurance premiums to compound above CPI over the hold.
Questions for the listing agent
- Can we see the unit-by-unit rent roll, current vacancy, and any below-market leases? What's the average tenancy length?
- What capital expenditures (roof, boiler, parking lot, exteriors) have been made in the last 5 years, and what's planned in the next 2?
- Built in 1900 — when were the roof, HVAC, electrical panel, plumbing, and water heater last replaced?
- Is there a deadline driving the sale (1031 exchange, divorce, estate, relocation)? That informs how much negotiation room exists.
- Schools are D-rated, which usually means shorter tenancies and higher turnover. Who's the typical renter profile here, and what's been the actual vacancy rate?
- Crime grade is F in this area — have there been break-ins, vandalism, or insurance claims at this property in the last 3 years? What carrier currently insures it and at what premium?
- The area grade is low — what's the realistic commute time and amenity access for the typical tenant pool here? Any planned neighborhood developments (good or bad) we should know about?
- What's the average days-on-market for RENTAL listings here right now (not sales)? A rising rental-DOM trend means longer vacancies and softer asking-rent achievability than the comps imply.
- What's the recent tenant-quality profile in this submarket — average credit score on applications, eviction rate, late-payment / NSF rate, and stable-employment percentage? A property-management company in the area should have these aggregated.
- How much new apartment / multifamily construction is in the pipeline within 1–3 miles? Heavy new supply (>2% of stock underway) typically softens rents 12–24 months out; light construction supports rent growth.
Investment metrics
- 1% rule
- 1.12% ✓
- Cap rate
- 8.55%
- Cash-on-cash
- 8.05%
- DSCR
- 1.36
- GRM
- 7.4
CMA / ARV
- ARV (on-the-fly)
- $401,280
- Comps found
- 9
Show comp detail 9 sales within ~0.75 mi
| Address | Dist | Beds/Ba | Sqft | Sold | Price | $/sf | Match |
|---|---|---|---|---|---|---|---|
| 298 Liberty St | 0.08mi | 6/3.0 | 2,573 (-2%) | 20mo | $370,000 | $144 | 75 |
| 60 Johnston St | 0.28mi | 6/2.0 | 2,625 (-1%) | 18mo | $298,000 | $114 | 67 |
| 17 Lutheran St | 0.46mi | 6/2.0 | 2,670 (+1%) | 15mo | $285,000 | $107 | 60 |
| 16 Lutheran St | 0.45mi | 6/2.0 | 2,508 (-5%) | 13mo | $380,000 | $152 | 56 |
| 181 First St | 0.29mi | 5/2.0 (-1) | 2,450 (-7%) | 15mo | $335,000 | $137 | 53 |
| 52 Benkard Ave | 0.73mi | 6/3.0 | 2,400 (-9%) | 5mo | $375,000 | $156 | 47 |
| 57 Carpenter Ave | 0.43mi | 7/3.0 (+1) | 3,000 (+14%) | 8mo | $460,000 | $153 | 46 |
| 189 Liberty St | 0.29mi | 7/5.0 (+1) | 2,927 (+11%) | 16mo | $565,000 | $193 | 42 |
| 15 E Parmenter St | 0.59mi | 5/2.5 (-1) | 2,468 (-6%) | 24mo | $555,000 | $225 | 35 |
Match score weights: distance 35% · size 25% · config 20% · recency 20%. Top-matched comps best support the ARV.
Projected returns pro-forma
-3.0% appreciation · 0.63% rent growth · sell at horizon
- IRR
- -6.8%
- Equity multiple
- 0.76×
- Total profit
- $-34,065
- Equity at exit
- $74,403
- IRR
- -0.4%
- Equity multiple
- 0.98×
- Total profit
- $-3,334
- Equity at exit
- $43,144
Cash invested: $139,720 (down + closing). Projections, not guarantees.
Landlord ↔ Tenant lean methodology
- Overall (STATE)
- 15 Strongly Tenant-Friendly
- State New York
- 15 Strongly Tenant-Friendly · D+10
- County
- — inherits STATE
- City
- — inherits STATE
ZIP-level market 12550
- Home prices YoY
- -33.3%
- Rents YoY
- 0.6%
- Active inventory
- 383
- Price-to-rent
- 22.3×
Monthly cashflow live
- Estimated rent
- $5,595 high interval (Pro) →
- Mortgage (P&I)
- −$2,617
- Tax from tax record
- −$658 /mo · $7,891/yr
- Insurance
- −$208
- HOA
- −$0
- Vacancy / Maint / Mgmt
- −$1,175
- Net cashflow
- $938
Break-even live
Sensitivity live
| Price | -10% $1,220 | -5% $1,079 | +0% $938 | +5% $796 | +10% $655 |
|---|---|---|---|---|---|
| Rent | -10% $496 | -5% $717 | +0% $938 | +5% $1,159 | +10% $1,380 |
| Rate | -1.0pp $1,189 | -0.5pp $1,065 | base $938 | +0.5pp $808 | +1.0pp $677 |
3-unit breakdown (identical units grouped — click to expand)
| Units | Beds | Baths | Est. rent |
|---|---|---|---|
| 3× units | 2 | 1 | $5,595 |
| #1 | 2 | 1 | $1,865 |
| #2 | 2 | 1 | $1,865 |
| #3 | 2 | 1 | $1,865 |
| Total (3 units) | $5,595 | ||
UW: 25.0% down · 7.5% · 30yr · 1.5% tax · 5.0% vac · 8.0% maint · 8.0% mgmt
Financing live
Cash to close
- Down payment
- $124,750
- Closing costs
- $14,970
- Reserves months
- —
- Total cash needed
- —
Loan-product check · same deal, 3 products live
Conventional
25% down · 7.5% · 30yr
- Down + closing
- —
- Monthly P&I
- —
- Monthly cashflow
- —
- DSCR
- —
- Eligible?
- —
Personal DTI + credit; lowest rate.
DSCR
20% down · 8.5% · 30yr
- Down + closing
- —
- Monthly P&I
- —
- Monthly cashflow
- —
- DSCR
- —
- Eligible?
- —
No personal income docs; deal must DSCR.
Hard money
10% down · 12.0% · 12mo
- Down + closing
- —
- Monthly P&I
- —
- Monthly cashflow
- —
- DSCR
- —
- Eligible?
- —
Short-term bridge; refi at stabilization.
Rent comps 1 comps
| Address | Beds | Baths | Sqft | Rent | $/sqft | DOM | Units | Dist |
|---|---|---|---|---|---|---|---|---|
| 87 Ellis Ave Newburgh, NY | 5.0 | 2.5 | 2172 | $2,500 | $1.15 | 44d | 1 | 1.40mi |
Listing history 8 events
-
2026-06-18days on market $499,000 Active 9 DOM
-
2026-06-17days on market $499,000 Active 8 DOM
-
2026-06-16days on market $499,000 Active 7 DOM
-
2026-06-15days on market $499,000 Active 6 DOM
-
2026-06-14days on market $499,000 Active 4 DOM
-
2026-06-13days on market $499,000 Active 3 DOM
-
2026-06-09remarks 699-char remark
-
2026-06-09$499,000 Active 1 DOM
ⓘ Source: listings_history table (triggers on properties + properties_extension) + one-shot
backfill from property_details.listing_events for pre-trigger history.
Tax reassessment forecast NY · Partial reset (capped growth)
- Current annual tax
- $7,891 · $658/mo
- Projected year-2 tax
- $8,162 · $680/mo
- Expected delta
- +$271/yr (+$23/mo · 3.4%)
ⓘ Screening estimate from a state-policy table — verify with the county assessor before closing.
Climate risk First Street
- Flood 1/10 Low FEMA zone X (unshaded) · 0% chance over 30 yrs
- Wildfire 2/10 Low
- Heat 5/10 Major 7 d/yr ≥100°F today · 16 d/yr by 30 yrs out
- Wind 4/10 Moderate 13% chance of damaging wind over 30 yrs
- Air quality 3/10 Moderate 2 unhealthy d/yr today · 3 by 30 yrs out
Nearby sold comps map
Loading sold comps map…
Walkable amenities ~0.75 mi
Loading nearby amenities…
Taxation est. · year 1
- Rental income
- $67,140
- − Mortgage interest
- −$27,952
- − Property taxes
- −$7,891
- − Insurance
- −$2,495
- − Repairs & maintenance
- −$5,371
- − Management
- −$5,371
- − Depreciation
- −$14,516
- Taxable income
- $3,543
- Est. tax owed @ 24.0%
- −$850
- After-tax cash flow
- $10,402/yr
For passive investors: Depreciation is non-cash, so a rental often shows a tax loss while cash-flowing — sheltering income. Rental losses are passive: they offset passive income freely, and up to $25,000/yr can offset ordinary (W-2) income if you actively participate and your MAGI is under $100k (phasing out to $0 by $150k); unused losses carry forward. On sale, claimed depreciation is recaptured at up to 25%, and gains may owe capital-gains tax (a 1031 exchange can defer both). Figures are a year-1 estimate at your 24.0% rate — not tax advice; consult a CPA.
Schools (NCES district)
- District
- Newburgh City School District
- NCES district ID
- 3620700
- Math proficiency
- 33% ▼ -8.00%
- Reading proficiency
- 48% ▲ 10.00%
- Median HH income
- $56,387
- Composite
- 35.46/100
- National rank
- #4927
- State rank
- #500 of 590 in NY
Livability — Newburgh
- Score
- 62/100
- State rank
- #878
- US rank
- #17021
Category grades
Schools grade is shown separately in the Schools card above.
Census & demographics
- Census place
- Newburgh, NY
- County
- Orange County · 267,004 people
- City population
- 55,152
- Metro
- Poughkeepsie-Newburgh-Middletown, NY
- Population (ZIP)
- 55,152
- Household income
- $85,697
- Rent vs Own
- Severe rent burden
- 2412.0
Population outlook (Orange County) Hauer SSP2
- Today (2025)
- 379,830 people
- By 2030
- 378,955 · -0.2%
- By 2040
- 375,444 · -1.2%
- By 2050
- 369,311 · -2.8%
- By 2075
- 354,233 · -6.7%
- By 2100
- 318,150 · -16.2%
Race, ethnicity, and origin ACS 2023
- Neighborhood character
- Diverse neighborhood (Simpson 0.68)
- Race & ethnicity
- Hispanic / Latino 39% White 36% Black 20% Two or more races 12% Asian 2%
- Hispanic origin (detail)
- Mexican 14% Puerto Rican 10% Dominican 2%
- Common ancestry
- Romanian 2% Hispanic 1% Lithuanian 1%
- Foreign-born
- 18% · Canada, Dominican Republic
- Languages at home
- 64% English-only · Spanish 30% French/Haitian/Cajun 1% Other Indo-European 1%
Political lean MEDSL · Orange
- 2024 margin
- Lean R (+8.4) · D 45.8% · R 54.2%
- 2008→2024 swing
- -12.5pp toward R · 2008: 4.1pp · 2024: -8.4pp
- All cycles
- 2024: R+8.4 2020: R+0.2 2016: R+6.5 2012: D+5.2 2008: D+4.1
Not yet ingested
- Civics
- —
Market trends
- HPI YoY
- ▼ -151.93%
- Current HPI
- 304.1046
- Rent YoY
- ▲ 0.63%
- Metro
- Poughkeepsie-Newburgh-Middletown, NY
- State GDP YoY
- ▲ 2.60%
- F500 in state
- 92
Industry mix (Fortune 500 HQ in NY)
| Industry | F500 HQs | Revenue |
|---|---|---|
| Financial Services | 10 | $950B |
|
||
| Consumer Goods | 9 | $162B |
|
||
| Insurance | 4 | $225B |
|
||
| Telecommunications | 2 | $144B |
|
||
| Pharmaceuticals | 2 | $112B |
|
||
| Media / Entertainment | 2 | $69B |
|
||
Price history
+1286.1% since first listed5 events — show timeline
- 2026-06-09 Listed $499,000 OneKey® MLS as Distributed by MLS Grid
- 2024-07-09 Sold (Public Records) $275,000 Public Records
- 2010-05-18 Sold (MLS) $36,000 HGMLS
- 2010-04-10 Delisted — HGMLS
- 2010-02-23 Listed $36,000 HGMLS
Property tax history
+6.3%/yrLatest (2025): $7,891 · +1.4% YoY. Source: county tax records.
Cash-flow waterfall
monthlySold comps — $/sqft
last 12 mo · ≤1 miLoading sold comps…