2500 Centennial Rd · Bismarck, ND
Flood risk No data
- FEMA flood zone
- —
- Chance of flooding over 30 yrs
- —
- Est. flood insurance / yr
- —
Fire risk No data
- Est. fire insurance / yr
- —
Heat risk No data
- Hot days now (above threshold)
- —
- Hot days in 30 yrs
- —
Wind risk No data
- Chance of severe wind over 30 yrs
- —
Air-quality risk No data
- Unhealthy air days now
- —
- Unhealthy air days in 30 yrs
- —
Risk factors via First Street. Map © Google.
Why this score? — see what drove the B+ grade
The composite is a weighted blend of 9 inputs, each scored 0–100. Each bar is that input's sub-score; the figure is the points it added to the 100-point composite (weight × sub-score).
- Cash flow +30.0/30.0
- ARV discount +13.4/15.0
- 1% rule +10.0/10.0
- DSCR +10.0/10.0
- Rent growth +5.0/5.0
- Livability +4.0/5.0
- Schools +3.7/10.0
- Condition / age +2.5/5.0
- Appreciation +0.0/10.0
$46,000
🖨 Deal sheet (PDF) 📄 Offer letter ✓ Due diligence
Listing remarks MLS
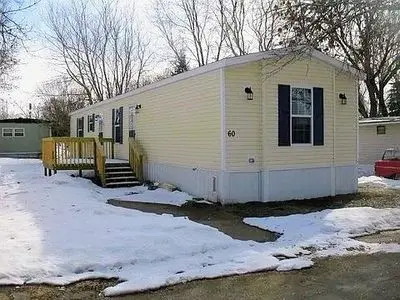
Very clean, new shingles 7/99, large master bedroom with master bath w/ french door. 195 Skyline 16 x 80 $200.00 lot rent. Basement - NONE.
Key facts
- Open living room
- Lots of cabinets
- Full bathroom
Tags
Neighborhood map
What this means for you Summary
Snapshot
- This is a 3-bed/2.0-bath manufactured listed at $46k.
Deal economics
- At list price, monthly cash flow is $1k ($14k/yr) — positive.
- The deal already cash-flows at list — no discount required.
- Meets the 1% rule at list price ($2k rent vs $46k).
- Recommended offer: $45k (3.0% below list) — sets the bar for market timing.
- Cap rate 37.2% vs local median 3.1% in Bismarck — top-decile yield for the area; either an underpriced asset or a hidden risk that comps aren't pricing in. Stress-test before assuming the spread holds.
Location & tenants
- Location reads 79/100 on livability (#5 in ND, #2,213 nationally) — a middle-class / working-renter tenant base. Strengths: housing A+, health & safety A+, cost of living A; Watch: crime C-, amenities D+, commute F.
- Bismarck 1 (urban): math 41% / reading 42% proficiency, ranked #25 of 53 in ND (top 47%) — families likely to look elsewhere, expect single-tenant / working-renter base with shorter leases; only 19% free/reduced lunch — higher-income household profile.
- Zoned schools: Robert Place Miller Elementary School (math 42% / reading 37%, grade F, #137 of 236 statewide, top 63%, 479 students, 36% FRL); Simle Middle School (math 34% / reading 39%, grade F, #22 of 35 statewide, top 62%, 1,040 students, 20% FRL); South Central Alternative High School (94 students, 100% FRL) — zoned schools average 52% FRL vs 19% district-wide (33 pts higher); higher-poverty schools than district average — tighter screening recommended.
- Market conditions: Rents rising fast (+11.8%/yr); 486 active listings in the ZIP; 3 comparable units currently listed for rent nearby; rentals at typical pace (median 23d on market — plan ~3-4 weeks tenant-placement turnaround); solid renter incomes; 259 units permitted in Burleigh County in 2024 (0 in 5+ unit buildings).
Forward outlook
- Local home prices are declining (-3.0%/yr); year-one equity from $318 of loan paydown is wiped out by about $1k of value loss. Plan a longer hold.
- Burleigh County population projected at +61% by 2050 — long-run rental-demand tailwind backs the buy-and-hold thesis.
- At projected returns (-3.0% appreciation + 8.0% rent growth), your $13k cash investment doubles in ~1 year — after that, you're playing with house money.
Negotiation context
- It's been on market 40 days — a 3% lower offer ($45k) is reasonable based on typical stale-listing flexibility.
- 50 sale attempts since 33y ago; this cycle's ask is 31% above the opening price — seller raised mid-cycle; expect resistance to lowballs.
Questions for the listing agent
- It's been on market 40 days. Have you received any prior offers? Is the seller open to a 3% concession, seller financing, or rate buy-down credit?
- Is there a deadline driving the sale (1031 exchange, divorce, estate, relocation)? That informs how much negotiation room exists.
- Schools are B-rated — typically a magnet for longer-tenancy family renters. What's the average tenant stay here, and is there a school-zone premium baked into asking?
- What's the average days-on-market for RENTAL listings here right now (not sales)? A rising rental-DOM trend means longer vacancies and softer asking-rent achievability than the comps imply.
- What's the recent tenant-quality profile in this submarket — average credit score on applications, eviction rate, late-payment / NSF rate, and stable-employment percentage? A property-management company in the area should have these aggregated.
- How much new for-sale + rental construction is in the pipeline within 1–3 miles? Heavy new supply typically softens prices + rents 12–24 months out; constrained supply supports both.
Investment metrics
- 1% rule
- 4.13% ✓
- Cap rate
- 37.17%
- Cash-on-cash
- 110.27%
- DSCR
- 5.91
- GRM
- 2.0
CMA / ARV
- ARV (on-the-fly)
- $52,992
- Comps found
- 12
Show comp detail 12 sales within ~0.75 mi
| Address | Dist | Beds/Ba | Sqft | Sold | Price | $/sf | Match |
|---|---|---|---|---|---|---|---|
| 4206 Patriot Dr | 0.30mi | 3/2.0 | 1,216 (+6%) | 2mo | $79,900 | $66 | 75 |
| 2500 Centennial Rd Lot 240 | 0.22mi | 3/2.0 | 1,280 (+11%) | 2mo | $45,900 | $36 | 69 |
| 4117 W Arlington Dr | 0.27mi | 3/2.0 | 1,280 (+11%) | 1mo | $49,900 | $39 | 68 |
| 2500 Centennial Rd #232 | 0.00mi | 2/1.0 (-1) | 1,020 (-12%) | 6mo | $17,900 | $18 | 67 |
| 4202 Patriot Dr | 0.37mi | 3/2.0 | 1,216 (+6%) | 11mo | $65,000 | $53 | 64 |
| 4303 Patriot Dr | 0.34mi | 3/2.0 | 1,280 (+11%) | 4mo | $64,900 | $51 | 62 |
| 2500 Centennial Rd #11 | 0.00mi | 2/1.0 (-1) | 980 (-15%) | 10mo | $12,000 | $12 | 58 |
| 4755 British Dr | 0.69mi | 3/2.0 | 1,216 (+6%) | 1mo | $54,000 | $44 | 58 |
| 4773 British Dr | 0.70mi | 3/2.0 | 1,216 (+6%) | 8mo | $115,000 | $95 | 52 |
| 4731 British Dr | 0.69mi | 3/2.0 | 1,216 (+6%) | 11mo | $55,000 | $45 | 50 |
| 5051 Redcoat Dr | 0.75mi | 3/2.0 | 1,216 (+6%) | 10mo | $56,000 | $46 | 48 |
| 4539 Lafayette Dr | 0.55mi | 3/2.0 | 1,280 (+11%) | 12mo | $74,900 | $59 | 46 |
Match score weights: distance 35% · size 25% · config 20% · recency 20%. Top-matched comps best support the ARV.
Projected returns pro-forma
-3.0% appreciation · 8.0% rent growth · sell at horizon
- IRR
- —
- Equity multiple
- 7.06×
- Total profit
- $78,003
- Equity at exit
- $6,859
- IRR
- —
- Equity multiple
- 17.37×
- Total profit
- $210,826
- Equity at exit
- $3,977
Cash invested: $12,880 (down + closing). Projections, not guarantees.
Landlord ↔ Tenant lean methodology
- Overall (STATE)
- 82 Strongly Landlord-Friendly
- State North Dakota
- 82 Strongly Landlord-Friendly · R+20
- County
- — inherits STATE
- City
- — inherits STATE
ZIP-level market 58503
- Home prices YoY
- -25.6%
- Rents YoY
- 11.8%
- Active inventory
- 486
- Price-to-rent
- 2.0×
Monthly cashflow live
- Estimated rent
- $1,901 medium interval (Pro) →
- Mortgage (P&I)
- −$241
- Tax est. 1.5%
- −$58 /mo · $690/yr
- Insurance
- −$19
- HOA
- −$0
- Vacancy / Maint / Mgmt
- −$399
- Net cashflow
- $1,184
Break-even live
Sensitivity live
| Price | -10% $1,215 | -5% $1,199 | +0% $1,184 | +5% $1,168 | +10% $1,152 |
|---|---|---|---|---|---|
| Rent | -10% $1,033 | -5% $1,109 | +0% $1,184 | +5% $1,259 | +10% $1,334 |
| Rate | -1.0pp $1,207 | -0.5pp $1,195 | base $1,184 | +0.5pp $1,172 | +1.0pp $1,160 |
UW: 25.0% down · 7.5% · 30yr · 1.5% tax · 5.0% vac · 8.0% maint · 8.0% mgmt
Financing live
Cash to close
- Down payment
- $11,500
- Closing costs
- $1,380
- Reserves months
- —
- Total cash needed
- —
Loan-product check · same deal, 3 products live
Conventional
25% down · 7.5% · 30yr
- Down + closing
- —
- Monthly P&I
- —
- Monthly cashflow
- —
- DSCR
- —
- Eligible?
- —
Personal DTI + credit; lowest rate.
DSCR
20% down · 8.5% · 30yr
- Down + closing
- —
- Monthly P&I
- —
- Monthly cashflow
- —
- DSCR
- —
- Eligible?
- —
No personal income docs; deal must DSCR.
Hard money
10% down · 12.0% · 12mo
- Down + closing
- —
- Monthly P&I
- —
- Monthly cashflow
- —
- DSCR
- —
- Eligible?
- —
Short-term bridge; refi at stabilization.
Rent comps 3 comps
| Address | Beds | Baths | Sqft | Rent | $/sqft | DOM | Units | Dist |
|---|---|---|---|---|---|---|---|---|
| 3504 French St Bismarck, ND | 2.0 | 1.5 | 966 | $1,795 | $1.86 | 22d | 1 | 0.60mi |
| 3103 E Calgary Ave Bismarck, ND | 1.0–3.0 | 1.0–2.0 | 1079 | $1,860 | $1.72 | 22d | 6 | 0.93mi |
| 3009 43rd Ave NE Bismarck, ND | 3.0 | 1.0–2.0 | 1051 | $2,024 | $1.93 | 22d | 22 | 1.34mi |
Listing history 50 events
-
2026-06-21days on market $46,000 Active 40 DOM
-
2026-06-19days on market $46,000 Active 38 DOM
-
2026-06-18days on market $46,000 Active 37 DOM
-
2026-06-17days on market $46,000 Active 36 DOM
-
2026-06-16pricedays on market $46,000 Active 35 DOM
-
2026-06-15days on market $48,000 Active 34 DOM
-
2026-06-14days on market $48,000 Active 32 DOM
-
2026-06-13days on market $48,000 Active 31 DOM
-
2026-06-10days on market $48,000 Active 29 DOM
-
2026-06-09days on market $48,000 Active 28 DOM
-
2026-06-08days on market $48,000 Active 27 DOM
-
2026-06-07days on market $48,000 Active 26 DOM
-
2026-06-05days on market $48,000 Active 23 DOM
-
2026-06-03days on market $48,000 Active 22 DOM
-
2026-06-02days on market $48,000 Active 21 DOM
-
2026-06-01days on market $48,000 Active 20 DOM
-
2026-05-31days on market $48,000 Active 19 DOM
-
2026-05-30days on market $48,000 Active 18 DOM
-
2022-06-22price $1,050
-
2001-02-01soldstatus 139-char remark
Show marketing remark (139 chars)
Very clean, new shingles 7/99, large master bedroom with master bath w/ french door. 195 Skyline 16 x 80 $200.00 lot rent. Basement - NONE.
-
2001-01-03$35,000 139-char remark
Show marketing remark (139 chars)
Very clean, new shingles 7/99, large master bedroom with master bath w/ french door. 195 Skyline 16 x 80 $200.00 lot rent. Basement - NONE.
-
2000-07-14soldstatus 210-char remark
Show marketing remark (210 chars)
NEW WATER HEATER- WASHER/DRYER 1999-REFRIGERATOR & STOVE 1997-LIVING ROOM & DINING AREA SHEET ROCKED & INSULATED W/ NEW WINDOWS!CARPORT & STORAGE SHED HAVE TO BE REMOVED Basement - NONE.
-
2000-06-01soldstatus
-
2000-04-11$26,900
-
2000-04-07soldstatus
-
2000-04-03$10,000 210-char remark
Show marketing remark (210 chars)
NEW WATER HEATER- WASHER/DRYER 1999-REFRIGERATOR & STOVE 1997-LIVING ROOM & DINING AREA SHEET ROCKED & INSULATED W/ NEW WINDOWS!CARPORT & STORAGE SHED HAVE TO BE REMOVED Basement - NONE.
-
2000-03-13$43,000
-
2000-03-09soldstatus
-
2000-03-01soldstatus
-
2000-02-08soldstatus
-
1999-12-28$14,900
-
1999-12-06$26,000
-
1999-12-03$23,900
-
1999-11-17soldstatus
-
1999-10-29soldstatus
-
1999-09-28soldstatus
-
1999-09-23$18,900
-
1999-07-09soldstatus
-
1999-06-16soldstatus
-
1999-05-28soldstatus
-
1999-05-20soldstatus
-
1999-04-23$13,500
-
1999-04-22$8,900
-
1999-04-14$30,000
-
1999-03-19soldstatus
-
1999-03-12$35,500
-
1999-03-12soldstatus
-
1999-03-12$34,900
-
1999-02-20$39,900
-
1999-02-03$37,500
ⓘ Source: listings_history table (triggers on properties + properties_extension) + one-shot
backfill from property_details.listing_events for pre-trigger history.
Nearby sold comps map
Loading sold comps map…
Walkable amenities ~0.75 mi
Loading nearby amenities…
Taxation est. · year 1
- Rental income
- $22,808
- − Mortgage interest
- −$2,577
- − Property taxes
- −$690
- − Insurance
- −$230
- − Repairs & maintenance
- −$1,825
- − Management
- −$1,825
- − Depreciation
- −$1,338
- Taxable income
- $14,323
- Est. tax owed @ 24.0%
- −$3,438
- After-tax cash flow
- $10,766/yr
For passive investors: Depreciation is non-cash, so a rental often shows a tax loss while cash-flowing — sheltering income. Rental losses are passive: they offset passive income freely, and up to $25,000/yr can offset ordinary (W-2) income if you actively participate and your MAGI is under $100k (phasing out to $0 by $150k); unused losses carry forward. On sale, claimed depreciation is recaptured at up to 25%, and gains may owe capital-gains tax (a 1031 exchange can defer both). Figures are a year-1 estimate at your 24.0% rate — not tax advice; consult a CPA.
Schools (NCES district)
- District
- Bismarck 1
- NCES district ID
- 3800014
- Math proficiency
- 41% ▼ -5.00%
- Reading proficiency
- 42% ▼ -6.00%
- Median HH income
- $60,649
- Composite
- 36.76/100
- National rank
- #4577
- State rank
- #25 of 53 in ND
Livability — Bismarck
- Score
- 79/100
- State rank
- #5
- US rank
- #2213
Category grades
Schools grade is shown separately in the Schools card above.
Census & demographics
- Census place
- Bismarck, ND
- County
- Burleigh County · 97,300 people
- City population
- 97,300
- Metro
- Bismarck, ND
- Population (ZIP)
- 37,683
- Household income
- $102,333
- Rent vs Own
- Severe rent burden
- 814.0
Population outlook (Burleigh County) Hauer SSP2
- Today (2025)
- 119,359 people
- By 2030
- 133,047 · +11.5%
- By 2040
- 161,545 · +35.3%
- By 2050
- 191,960 · +60.8%
- By 2075
- 274,569 · +130.0%
- By 2100
- 350,910 · +194.0%
Race, ethnicity, and origin ACS 2023
- Neighborhood character
- Predominantly White (89%)
- Race & ethnicity
- White 89% Two or more races 6% Hispanic / Latino 2% Asian 2% Black 1%
- Common ancestry
- Portuguese 17% Scotch-Irish 4% Scottish 2%
- Foreign-born
- 3% · Canada
- Languages at home
- 95% English-only · German/W. Germanic 2% Spanish 1% Tagalog/Filipino 1%
Political lean MEDSL · Burleigh
- 2024 margin
- Solid R (+43.2) · D 27.5% · R 70.7% · Other 1.8%
- 2008→2024 swing
- -19.7pp toward R · 2008: -23.6pp · 2024: -43.2pp
- All cycles
- 2024: R+43.2 2020: R+40.2 2016: R+46.1 2012: R+32.1 2008: R+23.6
Not yet ingested
- Civics
- —
Market trends
- HPI YoY
- ▼ -76.96%
- Current HPI
- 223.9683
- Rent YoY
- ▲ 11.79%
- Metro
- Bismarck, ND
- State GDP YoY
- ▲ 2.09%
- F500 in state
- 2
Industry mix (Fortune 500 HQ in ND)
| Industry | F500 HQs | Revenue |
|---|---|---|
| Utilities / Construction | 1 | $6B |
|
||
Price history
-93.4% since first listed101 events — show timeline
- 2022-06-22 Price Changed $1,050 RENT.
- 2001-02-01 Sold (MLS) — GNMLS
- 2001-01-03 Listed $35,000 GNMLS
- 2000-07-14 Sold (MLS) — GNMLS
- 2000-06-01 Sold (MLS) — GNMLS
- 2000-04-11 Listed $26,900 GNMLS
- 2000-04-07 Sold (MLS) — GNMLS
- 2000-04-03 Listed $10,000 GNMLS
- 2000-03-13 Listed $43,000 GNMLS
- 2000-03-09 Sold (MLS) — GNMLS
- 2000-03-01 Sold (MLS) — GNMLS
- 2000-02-08 Sold (MLS) — GNMLS
- 1999-12-28 Listed $14,900 GNMLS
- 1999-12-06 Listed $26,000 GNMLS
- 1999-12-03 Listed $23,900 GNMLS
- 1999-11-17 Sold (MLS) — GNMLS
- 1999-10-29 Sold (MLS) — GNMLS
- 1999-09-28 Sold (MLS) — GNMLS
- 1999-09-23 Listed $18,900 GNMLS
- 1999-07-09 Sold (MLS) — GNMLS
- 1999-06-16 Sold (MLS) — GNMLS
- 1999-05-28 Sold (MLS) — GNMLS
- 1999-05-20 Sold (MLS) — GNMLS
- 1999-04-23 Listed $13,500 GNMLS
- 1999-04-22 Listed $8,900 GNMLS
- 1999-04-14 Listed $30,000 GNMLS
- 1999-03-19 Sold (MLS) — GNMLS
- 1999-03-12 Listed $35,500 GNMLS
- 1999-03-12 Listed $34,900 GNMLS
- 1999-03-12 Sold (MLS) — GNMLS
- 1999-02-20 Listed $39,900 GNMLS
- 1999-02-03 Listed $37,500 GNMLS
- 1999-02-01 Sold (MLS) — GNMLS
- 1999-01-29 Listed $15,000 GNMLS
- 1999-01-27 Sold (MLS) — GNMLS
- 1998-12-14 Listed $6,800 GNMLS
- 1998-11-02 Listed $29,900 GNMLS
- 1998-09-01 Sold (MLS) — GNMLS
- 1998-07-31 Listed $16,000 GNMLS
- 1998-07-31 Sold (MLS) — GNMLS
- 1998-07-31 Sold (MLS) — GNMLS
- 1998-06-15 Listed $15,400 GNMLS
- 1998-05-01 Sold (MLS) — GNMLS
- 1998-04-14 Listed $13,500 GNMLS
- 1998-04-10 Sold (MLS) — GNMLS
- 1998-03-03 Listed $24,900 GNMLS
- 1998-02-19 Sold (MLS) — GNMLS
- 1998-01-27 Listed $14,900 GNMLS
- 1998-01-10 Listed $28,000 GNMLS
- 1997-12-31 Sold (MLS) — GNMLS
- 1997-11-14 Sold (MLS) — GNMLS
- 1997-10-31 Sold (MLS) — GNMLS
- 1997-09-26 Sold (MLS) — GNMLS
- 1997-09-08 Listed $18,500 GNMLS
- 1997-08-27 Listed $13,900 GNMLS
- 1997-07-26 Listed $16,900 GNMLS
- 1997-07-11 Sold (MLS) — GNMLS
- 1997-07-11 Sold (MLS) — GNMLS
- 1997-06-25 Sold (MLS) — GNMLS
- 1997-05-13 Listed $14,900 GNMLS
- 1997-05-12 Listed $13,900 GNMLS
- 1997-05-07 Listed $34,900 GNMLS
- 1997-05-03 Listed $39,900 GNMLS
- 1997-04-15 Sold (MLS) — GNMLS
- 1997-03-28 Sold (MLS) — GNMLS
- 1997-03-26 Sold (MLS) — GNMLS
- 1997-03-24 Sold (MLS) — GNMLS
- 1997-02-15 Listed $17,500 GNMLS
- 1997-02-08 Listed $29,900 GNMLS
- 1997-02-07 Sold (MLS) — GNMLS
- 1997-01-29 Listed $13,400 GNMLS
- 1996-12-04 Listed $6,500 GNMLS
- 1996-11-22 Listed $10,000 GNMLS
- 1996-11-14 Sold (MLS) — GNMLS
- 1996-09-27 Sold (MLS) — GNMLS
- 1996-09-20 Listed $17,000 GNMLS
- 1996-09-18 Sold (MLS) — GNMLS
- 1996-08-23 Listed $10,900 GNMLS
- 1996-08-23 Sold (MLS) — GNMLS
- 1996-07-18 Listed $8,900 GNMLS
- 1996-07-10 Sold (MLS) — GNMLS
- 1996-07-09 Listed $16,500 GNMLS
- 1996-05-20 Listed $24,900 GNMLS
- 1996-05-01 Sold (MLS) — GNMLS
- 1996-01-16 Listed $39,900 GNMLS
- 1995-07-17 Sold (MLS) — GNMLS
- 1995-06-07 Listed $15,900 GNMLS
- 1995-06-02 Sold (MLS) — GNMLS
- 1995-05-26 Sold (MLS) — GNMLS
- 1995-04-15 Listed $11,000 GNMLS
- 1995-04-05 Listed $6,000 GNMLS
- 1994-09-23 Sold (MLS) — GNMLS
- 1994-06-20 Listed $35,000 GNMLS
- 1994-05-06 Sold (MLS) — GNMLS
- 1994-03-31 Listed $12,500 GNMLS
- 1993-12-20 Sold (MLS) — GNMLS
- 1993-09-13 Listed $11,500 GNMLS
- 1993-06-10 Sold (MLS) — GNMLS
- 1993-04-27 Listed $16,000 GNMLS
- 1993-03-15 Sold (MLS) — GNMLS
- 1993-02-20 Listed $16,000 GNMLS
Cash-flow waterfall
monthlySold comps — $/sqft
last 12 mo · ≤1 miLoading sold comps…