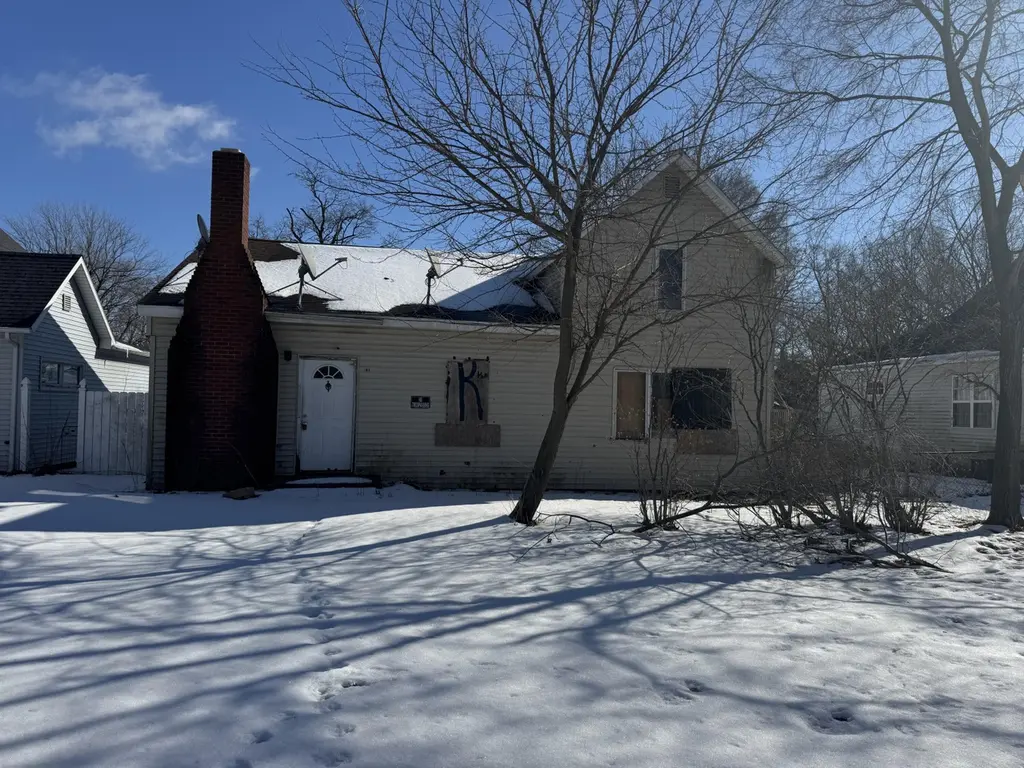
101 Hamlet St · Hamlet, IN
Flood risk 1/10 · Minimal
- FEMA flood zone
- X (unshaded)
- Chance of flooding over 30 yrs
- 0.0%
- Est. flood insurance / yr
- $507 – $1,088
Fire risk 1/10 · Minimal
- Est. fire insurance / yr
- $717 – $1,331
Heat risk 2/10 · Minimal
- Hot days now (above 101°F)
- 7 days/yr
- Hot days in 30 yrs
- 16 days/yr
Wind risk 2/10 · Minimal
- Chance of severe wind over 30 yrs
- —
Air-quality risk 2/10 · Minimal
- Unhealthy air days now
- 1 days/yr
- Unhealthy air days in 30 yrs
- 1 days/yr
Risk factors via First Street. Map © Google.
Why this score? — see what drove the B grade
The composite is a weighted blend of 9 inputs, each scored 0–100. Each bar is that input's sub-score; the figure is the points it added to the 100-point composite (weight × sub-score).
- Cash flow +30.0/30.0
- 1% rule +10.0/10.0
- DSCR +10.0/10.0
- ARV discount +7.5/15.0
- Appreciation +3.6/10.0
- Livability +3.0/5.0
- Rent growth +2.5/5.0
- Condition / age +2.5/5.0
- Schools +2.3/10.0
$64,000
🖨 Deal sheet (PDF) 📄 Offer letter ✓ Due diligence
Listing remarks MLS
Great opportunity for investors or buyers looking for their next project! This 1.5-story home offers 3 bedrooms and 1 full bath with plenty of potential to add value. Property requires significant repairs and updates and is being sold as-is. Seller financing available, providing flexible options for the right buyer. Bring your vision and tools-this one is ready for transformation.
Key facts
- 6,098 sq ft lot
- Built 1960
- Listed 120 days
Neighborhood map
What this means for you Summary
Snapshot
- This is a 3-bed/1.0-bath single-family listed at $64k.
Deal economics
- At list price, monthly cash flow is $575 ($7k/yr) — positive.
- The deal already cash-flows at list — no discount required.
- Meets the 1% rule at list price ($1k rent vs $64k).
- Recommended offer: $56k (12.0% below list) — sets the bar for market timing.
Location & tenants
- Location reads 59/100 on livability (#572 in IN) — a working-class tenant base; expect higher turnover. Strengths: cost of living A+, housing A+; Watch: employment D+, crime D, schools F.
- Oregon-Davis School Corporation (rural): math 19% / reading 34% proficiency, ranked #257 of 301 in IN (top 85%) — low school quality limits family demand, transient renter base, plan for 1-2y turnover.
- Market conditions: 11 active listings in the ZIP; 58 units permitted in Starke County in 2024 (0 in 5+ unit buildings).
Forward outlook
- Local home prices are declining (-2.9%/yr); year-one equity from $442 of loan paydown is wiped out by about $2k of value loss. Plan a longer hold.
- Starke County population projected at -23% by 2050 — secular population decline; favor cash flow + early exit over multi-decade hold.
- At projected returns (-2.9% appreciation + 3.0% rent growth), your $18k cash investment doubles in ~4 years — after that, you're playing with house money.
Negotiation context
- It's been on market 121 days — a 12% lower offer ($56k) is reasonable based on typical stale-listing flexibility.
- 2 sale attempts; this cycle's ask has dropped $6k (9%) from the opening price — seller is motivated, your offer sets the floor, not the list.
Questions for the listing agent
- It's been on market 121 days. Have you received any prior offers? Is the seller open to a 12% concession, seller financing, or rate buy-down credit?
- Built in 1960 — when were the roof, HVAC, electrical panel, plumbing, and water heater last replaced?
- Why hasn't it sold? Are there any deal-killer items the seller is aware of (foundation, flood, title, zoning, code violations)?
- Is there a deadline driving the sale (1031 exchange, divorce, estate, relocation)? That informs how much negotiation room exists.
- Schools are F-rated, which usually means shorter tenancies and higher turnover. Who's the typical renter profile here, and what's been the actual vacancy rate?
- Crime grade is D in this area — have there been break-ins, vandalism, or insurance claims at this property in the last 3 years? What carrier currently insures it and at what premium?
- What's the average days-on-market for RENTAL listings here right now (not sales)? A rising rental-DOM trend means longer vacancies and softer asking-rent achievability than the comps imply.
- What's the recent tenant-quality profile in this submarket — average credit score on applications, eviction rate, late-payment / NSF rate, and stable-employment percentage? A property-management company in the area should have these aggregated.
- How much new for-sale + rental construction is in the pipeline within 1–3 miles? Heavy new supply typically softens prices + rents 12–24 months out; constrained supply supports both.
Investment metrics
- 1% rule
- 1.91% ✓
- Cap rate
- 17.07%
- Cash-on-cash
- 38.48%
- DSCR
- 2.71
- GRM
- 4.4
CMA / ARV
- ARV (median comp)
- $186,912
- List price
- $64,000
- Delta
- -65.76%
- Verdict
- UNDERPRICED
- Comps
- 20 within 1.0 mi
Show comp detail 5 sales within ~0.75 mi
| Address | Dist | Beds/Ba | Sqft | Sold | Price | $/sf | Match |
|---|---|---|---|---|---|---|---|
| 113 Division St | 0.08mi | 2/1.0 (-1) | 1,608 (+3%) | 5mo | $159,000 | $99 | 82 |
| 8 W Madison St | 0.14mi | 3/1.0 | 1,682 (+8%) | 6mo | $124,900 | $74 | 75 |
| 506 W Pearl St | 0.20mi | 4/1.0 (+1) | 1,449 (-7%) | 12mo | $160,000 | $110 | 64 |
| 500 E Oak St | 0.52mi | 3/2.0 | 1,662 (+6%) | 2mo | $270,000 | $162 | 59 |
| 60 S Jefferson St | 0.35mi | 3/2.0 | 1,415 (-9%) | 12mo | $250,500 | $177 | 54 |
Match score weights: distance 35% · size 25% · config 20% · recency 20%. Top-matched comps best support the ARV.
Projected returns pro-forma
-2.85% appreciation · 3.0% rent growth · sell at horizon
- IRR
- 34.8%
- Equity multiple
- 2.49×
- Total profit
- $26,616
- Equity at exit
- $9,966
- IRR
- 41.5%
- Equity multiple
- 4.94×
- Total profit
- $70,595
- Equity at exit
- $6,264
Cash invested: $17,920 (down + closing). Projections, not guarantees.
Landlord ↔ Tenant lean methodology
- Overall (STATE)
- 90 Strongly Landlord-Friendly
- State Indiana
- 90 Strongly Landlord-Friendly · R+11
- County
- — inherits STATE
- City
- — inherits STATE
ZIP-level market 46532
- Home prices YoY
- -1.2%
- Active inventory
- 11
- Price-to-rent
- 4.4×
Monthly cashflow live
- Estimated rent
- $1,224 medium interval (Pro) →
- Mortgage (P&I)
- −$336
- Tax from tax record
- −$30 /mo · $356/yr
- Insurance
- −$27
- HOA
- −$0
- Vacancy / Maint / Mgmt
- −$257
- Net cashflow
- $575
Break-even live
Sensitivity live
| Price | -10% $611 | -5% $593 | +0% $575 | +5% $557 | +10% $538 |
|---|---|---|---|---|---|
| Rent | -10% $478 | -5% $526 | +0% $575 | +5% $623 | +10% $671 |
| Rate | -1.0pp $607 | -0.5pp $591 | base $575 | +0.5pp $558 | +1.0pp $541 |
UW: 25.0% down · 7.5% · 30yr · 1.5% tax · 5.0% vac · 8.0% maint · 8.0% mgmt
Financing live
Cash to close
- Down payment
- $16,000
- Closing costs
- $1,920
- Reserves months
- —
- Total cash needed
- —
Loan-product check · same deal, 3 products live
Conventional
25% down · 7.5% · 30yr
- Down + closing
- —
- Monthly P&I
- —
- Monthly cashflow
- —
- DSCR
- —
- Eligible?
- —
Personal DTI + credit; lowest rate.
DSCR
20% down · 8.5% · 30yr
- Down + closing
- —
- Monthly P&I
- —
- Monthly cashflow
- —
- DSCR
- —
- Eligible?
- —
No personal income docs; deal must DSCR.
Hard money
10% down · 12.0% · 12mo
- Down + closing
- —
- Monthly P&I
- —
- Monthly cashflow
- —
- DSCR
- —
- Eligible?
- —
Short-term bridge; refi at stabilization.
Listing history 21 events
-
2026-06-19days on market $64,000 Active 121 DOM
-
2026-06-18days on market $64,000 Active 120 DOM
-
2026-06-17days on market $64,000 Active 119 DOM
-
2026-06-16days on market $64,000 Active 118 DOM
-
2026-06-15days on market $64,000 Active 117 DOM
-
2026-06-14days on market $64,000 Active 115 DOM
-
2026-06-12days on market $64,000 Active 114 DOM
-
2026-06-09days on market $64,000 Active 111 DOM
-
2026-06-08days on market $64,000 Active 110 DOM
-
2026-06-07days on market $64,000 Active 109 DOM
-
2026-06-07days on market $64,000 Active 108 DOM
-
2026-06-03days on market $64,000 Active 105 DOM
-
2026-06-02days on market $64,000 Active 104 DOM
-
2026-06-01days on market $64,000 Active 103 DOM
-
2026-05-31days on market $64,000 Active 102 DOM
-
2026-05-31days on market $64,000 Active 101 DOM
-
2026-04-16price $64,000 383-char remark
Show marketing remark (383 chars)
Great opportunity for investors or buyers looking for their next project! This 1.5-story home offers 3 bedrooms and 1 full bath with plenty of potential to add value. Property requires significant repairs and updates and is being sold as-is. Seller financing available, providing flexible options for the right buyer. Bring your vision and tools-this one is ready for transformation.
-
2026-02-16$70,000 Active 383-char remark
Show marketing remark (383 chars)
Great opportunity for investors or buyers looking for their next project! This 1.5-story home offers 3 bedrooms and 1 full bath with plenty of potential to add value. Property requires significant repairs and updates and is being sold as-is. Seller financing available, providing flexible options for the right buyer. Bring your vision and tools-this one is ready for transformation.
-
2025-06-18price $67,500
-
2025-05-19price $75,000
-
2025-04-15$80,000 Active
ⓘ Source: listings_history table (triggers on properties + properties_extension) + one-shot
backfill from property_details.listing_events for pre-trigger history.
Tax reassessment forecast IN · Partial reset (capped growth)
- Current annual tax
- $356 · $30/mo
- Projected year-2 tax
- $450 · $38/mo
- Expected delta
- +$94/yr (+$8/mo · 26.3%)
ⓘ Screening estimate from a state-policy table — verify with the county assessor before closing.
Climate risk First Street
- Flood 1/10 Low FEMA zone X (unshaded) · 0% chance over 30 yrs
- Wildfire 1/10 Low
- Heat 2/10 Low 7 d/yr ≥101°F today · 16 d/yr by 30 yrs out
- Wind 2/10 Low
- Air quality 2/10 Low 1 unhealthy d/yr today · 1 by 30 yrs out
Nearby sold comps map
Loading sold comps map…
Walkable amenities ~0.75 mi
Loading nearby amenities…
Taxation est. · year 1
- Rental income
- $14,684
- − Mortgage interest
- −$3,585
- − Property taxes
- −$356
- − Insurance
- −$320
- − Repairs & maintenance
- −$1,175
- − Management
- −$1,175
- − Depreciation
- −$1,862
- Taxable income
- $6,211
- Est. tax owed @ 24.0%
- −$1,491
- After-tax cash flow
- $5,405/yr
For passive investors: Depreciation is non-cash, so a rental often shows a tax loss while cash-flowing — sheltering income. Rental losses are passive: they offset passive income freely, and up to $25,000/yr can offset ordinary (W-2) income if you actively participate and your MAGI is under $100k (phasing out to $0 by $150k); unused losses carry forward. On sale, claimed depreciation is recaptured at up to 25%, and gains may owe capital-gains tax (a 1031 exchange can defer both). Figures are a year-1 estimate at your 24.0% rate — not tax advice; consult a CPA.
Schools (NCES district)
- District
- Oregon-Davis School Corporation
- NCES district ID
- 1808460
- Math proficiency
- 19% ▼ -13.00%
- Reading proficiency
- 34% ▼ -5.00%
- Median HH income
- $46,674
- Composite
- 22.93/100
- National rank
- #7991
- State rank
- #257 of 301 in IN
Livability — Hamlet
- Score
- 59/100
- State rank
- #572
- US rank
- #20445
Category grades
Schools grade is shown separately in the Schools card above.
Census & demographics
- Census place
- Hamlet, IN
- Population (ZIP)
- 1,628
Population outlook (Starke County) Hauer SSP2
- Today (2025)
- 21,860 people
- By 2030
- 21,024 · -3.8%
- By 2040
- 19,041 · -12.9%
- By 2050
- 16,881 · -22.8%
- By 2075
- 11,880 · -45.7%
- By 2100
- 7,217 · -67.0%
Race, ethnicity, and origin ACS 2023
- Neighborhood character
- Predominantly White (97%)
- Race & ethnicity
- White 97% Two or more races 3% Hispanic / Latino 2%
- Common ancestry
- Romanian 5% Danish 1% Iranian 1%
- Foreign-born
- 1%
Political lean MEDSL · Starke
- 2024 margin
- Solid R (+52.0) · D 23.2% · R 75.3% · Other 1.5%
- 2008→2024 swing
- -55.3pp toward R · 2008: 3.2pp · 2024: -52.0pp
- All cycles
- 2024: R+52.0 2020: R+46.8 2016: R+42.0 2012: R+10.6 2008: D+3.2
Not yet ingested
- Civics
- —
Market trends
- HPI YoY
- ▼ -2.85%
- Current HPI
- 238.8515
- Rent YoY
- —
- Metro
- —
- State GDP YoY
- ▲ 2.90%
- F500 in state
- 18
Industry mix (Fortune 500 HQ in IN)
| Industry | F500 HQs | Revenue |
|---|---|---|
| Industrial Machinery | 2 | $37B |
|
||
| Healthcare | 1 | $177B |
|
||
| Pharmaceuticals | 1 | $45B |
|
||
| Metals / Steel | 1 | $18B |
|
||
| Agriculture | 1 | $17B |
|
||
| Packaging | 1 | $12B |
|
||
Price history
-20.0% since first listed5 events — show timeline
- 2026-04-16 Price Changed $64,000 NIRA MLS as Distributed by MLS Grid
- 2026-02-16 Listed $70,000 NIRA MLS as Distributed by MLS Grid
- 2025-06-18 Price Changed $67,500 IRMLS
- 2025-05-19 Price Changed $75,000 IRMLS
- 2025-04-15 Listed $80,000 IRMLS
Property tax history
+5.5%/yrLatest (2024): $356 · -1.4% YoY. Source: county tax records.
Cash-flow waterfall
monthlySold comps — $/sqft
last 12 mo · ≤1 miLoading sold comps…