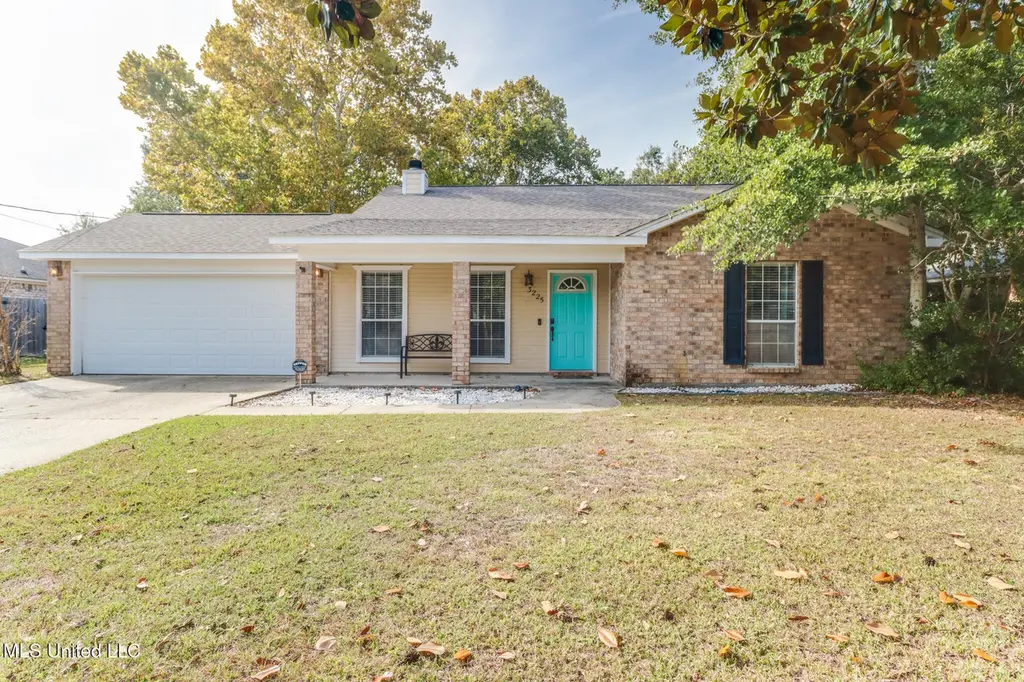
3225 N 5th St · Gulf Park Estates, MS
Flood risk 3/10 · Minor
- FEMA flood zone
- X (shaded)
- Chance of flooding over 30 yrs
- 0.12%
- Est. flood insurance / yr
- $507 – $1,088
Fire risk 3/10 · Minor
- Est. fire insurance / yr
- $1,241 – $2,305
Heat risk 10/10 · Severe
- Hot days now (above 106°F)
- 7 days/yr
- Hot days in 30 yrs
- 24 days/yr
Wind risk 9/10 · Severe
- Chance of severe wind over 30 yrs
- 99.0%
Air-quality risk 2/10 · Minimal
- Unhealthy air days now
- 1 days/yr
- Unhealthy air days in 30 yrs
- 2 days/yr
Risk factors via First Street. Map © Google.
Why this score? — see what drove the C- grade
The composite is a weighted blend of 9 inputs, each scored 0–100. Each bar is that input's sub-score; the figure is the points it added to the 100-point composite (weight × sub-score).
- Cash flow +21.8/30.0
- DSCR +7.0/10.0
- Schools +5.3/10.0
- ARV discount +5.1/15.0
- 1% rule +4.6/10.0
- Livability +3.5/5.0
- Rent growth +2.8/5.0
- Condition / age +2.5/5.0
- Appreciation +0.0/10.0
$264,999
🖨 Deal sheet 📄 Offer letter ✓ Due diligence
Listing remarks
Highly sought-after Ocean Springs home. Updated kitchen and bathrooms, oversized main bedroom, generous secondary bedrooms, with an expansive back yard. All in Ocean Spring school district! Roof is only 3 years old!!
Key facts
- Expansive back yard
- Updated bathrooms
- Updated kitchen
Tags
Neighborhood map
What this means for you Summary
Snapshot
- This is a 3-bed/2.0-bath single-family listed at $265k.
Deal economics
- At list price, monthly cash flow is $412 ($5k/yr) — positive.
- The deal already cash-flows at list — no discount required.
- To meet the 1% rule (rent ≥ 1% of price), the offer needs to be $254k (4.2% below list).
- Recommended offer: $233k (12.0% below list) — sets the bar for market timing.
- Cap rate 8.2% vs local median 5.2% in Gulf Park Estates — top-decile yield for the area; either an underpriced asset or a hidden risk that comps aren't pricing in. Stress-test before assuming the spread holds.
Location & tenants
- Location reads 70/100 on livability (#43 in MS) — a middle-class / working-renter tenant base. Strengths: crime A+, cost of living A+, housing A+; Watch: schools D+, health & safety D+, amenities F.
- Ocean Springs School District (suburban): math 64% / reading 59% proficiency, ranked #1 of 130 in MS (top 1%) — acceptable for families but not a draw, mixed tenant base, ~2y average lease.
- Market conditions: Rents rising (+1.3%/yr); 714 active listings in the ZIP; 3 comparable units currently listed for rent nearby; rentals leasing fast (median 14d on market — plan ~1-2 weeks tenant-placement turnaround); solid renter incomes; 516 units permitted in Jackson County in 2024 (6 in 5+ unit buildings).
- This rent runs 39% of the median local income ($79k/yr) — at the standard rent-burdened threshold; future hikes will face affordability resistance.
Forward outlook
- Local home prices are declining (-3.0%/yr); year-one equity from $2k of loan paydown is wiped out by about $8k of value loss. Plan a longer hold.
Negotiation context
- It's been on market 207 days — a 12% lower offer ($233k) is reasonable based on typical stale-listing flexibility.
- 2 sale attempts since 10y ago; this cycle's ask has dropped $15k (5%) from the opening price — seller is motivated, your offer sets the floor, not the list.
Risks & watch-outs
- Climate carrying-cost: severe wind risk, 99% chance of damaging wind over 30y; extreme-heat days projected 7→24/yr by 2055 (HVAC capex compounding) — expect insurance premiums to compound above CPI over the hold.
Questions for the listing agent
- It's been on market 207 days. Have you received any prior offers? Is the seller open to a 12% concession, seller financing, or rate buy-down credit?
- Why hasn't it sold? Are there any deal-killer items the seller is aware of (foundation, flood, title, zoning, code violations)?
- Is there a deadline driving the sale (1031 exchange, divorce, estate, relocation)? That informs how much negotiation room exists.
- Schools are D-rated, which usually means shorter tenancies and higher turnover. Who's the typical renter profile here, and what's been the actual vacancy rate?
- What's the average days-on-market for RENTAL listings here right now (not sales)? A rising rental-DOM trend means longer vacancies and softer asking-rent achievability than the comps imply.
- What's the recent tenant-quality profile in this submarket — average credit score on applications, eviction rate, late-payment / NSF rate, and stable-employment percentage? A property-management company in the area should have these aggregated.
- How much new for-sale + rental construction is in the pipeline within 1–3 miles? Heavy new supply typically softens prices + rents 12–24 months out; constrained supply supports both.
Investment metrics
- 1% rule
- 0.96% ✗
- Cap rate
- 8.16%
- Cash-on-cash
- 6.66%
- DSCR
- 1.30
- GRM
- 8.7
CMA / ARV
- ARV (median comp)
- $251,622
- List price
- $264,999
- Delta
- 5.32%
- Verdict
- FAIR
- Comps
- 20 within 1.0 mi
Show comp detail 12 sales within ~0.75 mi
| Address | Dist | Beds/Ba | Sqft | Sold | Price | $/sf | Match |
|---|---|---|---|---|---|---|---|
| 9321 Coconut Dr | 0.27mi | 3/3.0 | 1,836 (+0%) | 1mo | $270,000 | $147 | 82 |
| 3212 N 5th St | 0.05mi | 3/2.0 | 1,641 (-10%) | 0mo | $249,900 | $152 | 80 |
| 3300 N 9th St | 0.37mi | 3/2.0 | 1,858 (+2%) | 2mo | $315,000 | $170 | 78 |
| 3524 N 8th St | 0.42mi | 4/2.0 (+1) | 1,835 (+0%) | 2mo | $275,000 | $150 | 73 |
| 9504 Live Oak Ave | 0.43mi | 3/2.0 | 1,761 (-4%) | 5mo | $224,900 | $128 | 70 |
| 3717 Tangerine St | 0.50mi | 3/2.0 | 1,752 (-4%) | 2mo | $250,000 | $143 | 68 |
| 3301 Pineridge Dr | 0.28mi | 3/2.0 | 2,048 (+12%) | 0mo | $349,000 | $170 | 66 |
| 3425 Beachview Dr | 0.23mi | 4/2.0 (+1) | 1,993 (+9%) | 5mo | $279,900 | $140 | 65 |
| 2804 Beachview Dr | 0.50mi | 4/2.5 (+1) | 1,798 (-2%) | 4mo | $235,000 | $131 | 64 |
| 2621 Beachview Dr | 0.62mi | 3/2.0 | 1,752 (-4%) | 4mo | $179,500 | $102 | 61 |
| 2808 Hickory Ln | 0.46mi | 3/2.5 | 2,073 (+14%) | 1mo | $269,000 | $130 | 54 |
| 2713 N 6th St | 0.54mi | 3/2.0 | 1,560 (-15%) | 2mo | $205,000 | $131 | 49 |
Match score weights: distance 35% · size 25% · config 20% · recency 20%. Top-matched comps best support the ARV.
Projected returns pro-forma
-3.0% appreciation · 1.31% rent growth · sell at horizon
- IRR
- -7.8%
- Equity multiple
- 0.72×
- Total profit
- $-21,058
- Equity at exit
- $39,512
- IRR
- -0.4%
- Equity multiple
- 0.98×
- Total profit
- $-1,831
- Equity at exit
- $22,912
Cash invested: $74,200 (down + closing). Projections, not guarantees.
Landlord ↔ Tenant lean methodology
- Overall (STATE)
- 90 Strongly Landlord-Friendly
- State Mississippi
- 90 Strongly Landlord-Friendly · R+11
- County
- — inherits STATE
- City
- — inherits STATE
ZIP-level market 39564
- Home prices YoY
- -26.8%
- Rents YoY
- 1.3%
- Active inventory
- 714
- Price-to-rent
- 8.7×
Monthly cashflow live
- Estimated rent
- $2,539 medium interval (Pro) →
- Mortgage (P&I)
- −$1,390
- Tax from tax record
- −$94 /mo · $1,125/yr
- Insurance
- −$110
- HOA
- −$0
- Vacancy / Maint / Mgmt
- −$533
- Net cashflow
- $412
Break-even live
UW: 25.0% down · 7.5% · 30yr · 1.5% tax · 5.0% vac · 8.0% maint · 8.0% mgmt
Financing live
Cash to close
- Down payment
- $66,250
- Closing costs
- $7,950
- Reserves months
- —
- Total cash needed
- —
Loan-product check · same deal, 3 products live
Conventional
25% down · 7.5% · 30yr
- Down + closing
- —
- Monthly P&I
- —
- Monthly cashflow
- —
- DSCR
- —
- Eligible?
- —
Personal DTI + credit; lowest rate.
DSCR
20% down · 8.5% · 30yr
- Down + closing
- —
- Monthly P&I
- —
- Monthly cashflow
- —
- DSCR
- —
- Eligible?
- —
No personal income docs; deal must DSCR.
Hard money
10% down · 12.0% · 12mo
- Down + closing
- —
- Monthly P&I
- —
- Monthly cashflow
- —
- DSCR
- —
- Eligible?
- —
Short-term bridge; refi at stabilization.
Rent comps 3 comps
| Address | Beds | Baths | Sqft | Rent | $/sqft | DOM | Units | Dist |
|---|---|---|---|---|---|---|---|---|
| 3305 N 8th St Ocean Springs, MS | 4.0 | 2.0 | 1802 | $2,250 | $1.25 | 21d | 1 | 0.26mi |
| 106 Booth Cir Ocean Springs, MS | 4.0 | 2.0 | 2100 | $2,500 | $1.19 | 13d | 1 | 0.97mi |
| 9200 Pointe Aux Chenes Rd Unit 1365709P Ocean Springs, MS | 3.0 | 2.0 | 1420 | $5,979 | $4.21 | 13d | 1 | 1.35mi |
Listing history 19 events
-
2026-06-18days on market $264,999 Active 207 DOM
-
2026-06-17days on market $264,999 Active 206 DOM
-
2026-06-16days on market $264,999 Active 205 DOM
-
2026-06-15days on market $264,999 Active 204 DOM
-
2026-06-14days on market $264,999 Active 202 DOM
-
2026-06-13days on market $264,999 Active 201 DOM
-
2026-06-10days on market $264,999 Active 199 DOM
-
2026-06-09days on market $264,999 Active 198 DOM
-
2026-06-08days on market $264,999 Active 197 DOM
-
2026-06-07days on market $264,999 Active 196 DOM
-
2026-06-02days on market $264,999 Active 191 DOM
-
2026-06-01days on market $264,999 Active 190 DOM
-
2026-05-31days on market $264,999 Active 189 DOM
-
2026-05-30days on market $264,999 Active 188 DOM
-
2026-05-18historical
-
2026-05-10price $269,999
-
2025-11-18$279,900 Active
-
2016-12-06soldstatus
-
2016-10-26$134,999
ⓘ Source: listings_history table (triggers on properties + properties_extension) + one-shot
backfill from property_details.listing_events for pre-trigger history.
Tax reassessment forecast MS · Resets to sale price
- Current annual tax
- $1,125 · $94/mo
- Projected year-2 tax
- $2,093 · $174/mo
- Expected delta
- +$969/yr (+$81/mo · 86.1%)
ⓘ Screening estimate from a state-policy table — verify with the county assessor before closing.
Climate risk First Street
- Flood 3/10 Moderate FEMA zone X (shaded) · 12% chance over 30 yrs
- Wildfire 3/10 Moderate
- Heat 10/10 Extreme 7 d/yr ≥106°F today · 24 d/yr by 30 yrs out
- Wind 9/10 Extreme 99% chance of damaging wind over 30 yrs
- Air quality 2/10 Low 1 unhealthy d/yr today · 2 by 30 yrs out
Nearby sold comps map
Loading sold comps map…
Walkable amenities ~0.75 mi
Loading nearby amenities…
Taxation est. · year 1
- Rental income
- $30,467
- − Mortgage interest
- −$14,844
- − Property taxes
- −$1,125
- − Insurance
- −$1,325
- − Repairs & maintenance
- −$2,437
- − Management
- −$2,437
- − Depreciation
- −$7,709
- Taxable income
- $590
- Est. tax owed @ 24.0%
- −$142
- After-tax cash flow
- $4,802/yr
For passive investors: Depreciation is non-cash, so a rental often shows a tax loss while cash-flowing — sheltering income. Rental losses are passive: they offset passive income freely, and up to $25,000/yr can offset ordinary (W-2) income if you actively participate and your MAGI is under $100k (phasing out to $0 by $150k); unused losses carry forward. On sale, claimed depreciation is recaptured at up to 25%, and gains may owe capital-gains tax (a 1031 exchange can defer both). Figures are a year-1 estimate at your 24.0% rate — not tax advice; consult a CPA.
Schools (NCES district)
- District
- Ocean Springs School District
- NCES district ID
- 2803360
- Math proficiency
- 64% ▼ -3.00%
- Reading proficiency
- 59% ▲ 1.00%
- Median HH income
- $60,485
- Composite
- 53.35/100
- National rank
- #1477
- State rank
- #1 of 130 in MS
Livability — Gulf Park Estates
- Score
- 70/100
- State rank
- #43
- US rank
- #7955
Category grades
Schools grade is shown separately in the Schools card above.
Census & demographics
- Census place
- Gulf Park Estates, MS
- County
- Jackson County · 82,196 people
- Metro
- Gulfport-Biloxi, MS
- Population (ZIP)
- 43,240
- Household income
- $78,596
- Rent vs Own
- Severe rent burden
- 734.0
Population outlook (Jackson County) Hauer SSP2
- Today (2025)
- 146,926 people
- By 2030
- 148,442 · +1.0%
- By 2040
- 149,631 · +1.8%
- By 2050
- 148,723 · +1.2%
- By 2075
- 147,845 · +0.6%
- By 2100
- 144,510 · -1.6%
Race, ethnicity, and origin ACS 2023
- Neighborhood character
- Predominantly White (74%)
- Race & ethnicity
- White 74% Black 10% Hispanic / Latino 8% Two or more races 7% Asian 4%
- Hispanic origin (detail)
- Mexican 3% Puerto Rican 2%
- Common ancestry
- Lithuanian 5% Slovak 4% Romanian 2%
- Foreign-born
- 5% · Canada, South Korea, Vietnam
- Languages at home
- 93% English-only · Spanish 3% Vietnamese 2% Tagalog/Filipino 1%
Political lean MEDSL · Jackson
- 2024 margin
- Solid R (+39.9) · D 29.5% · R 69.4% · Other 1.1%
- 2008→2024 swing
- -6.4pp toward R · 2008: -33.5pp · 2024: -39.9pp
- All cycles
- 2024: R+39.9 2020: R+34.6 2016: R+39.9 2012: R+36.1 2008: R+33.5
Not yet ingested
- Civics
- —
Market trends
- HPI YoY
- ▼ -74.77%
- Current HPI
- 204.2244
- Rent YoY
- ▲ 1.31%
- Metro
- Gulfport-Biloxi, MS
- State GDP YoY
- —
- F500 in state
- 0
Price history
+100.0% since first listed5 events — show timeline
- 2026-05-18 Listing Removed — MLSU
- 2026-05-10 Price Changed $269,999 MLSU
- 2025-11-18 Listed $279,900 MLSU
- 2016-12-06 Sold (MLS) — MLSU
- 2016-10-26 Listed $134,999 MLSU
Property tax history
+1.0%/yrLatest (2025): $1,125 · +9.0% YoY. Source: county tax records.
Cash-flow waterfall
monthlySold comps — $/sqft
last 12 mo · ≤1 miLoading sold comps…