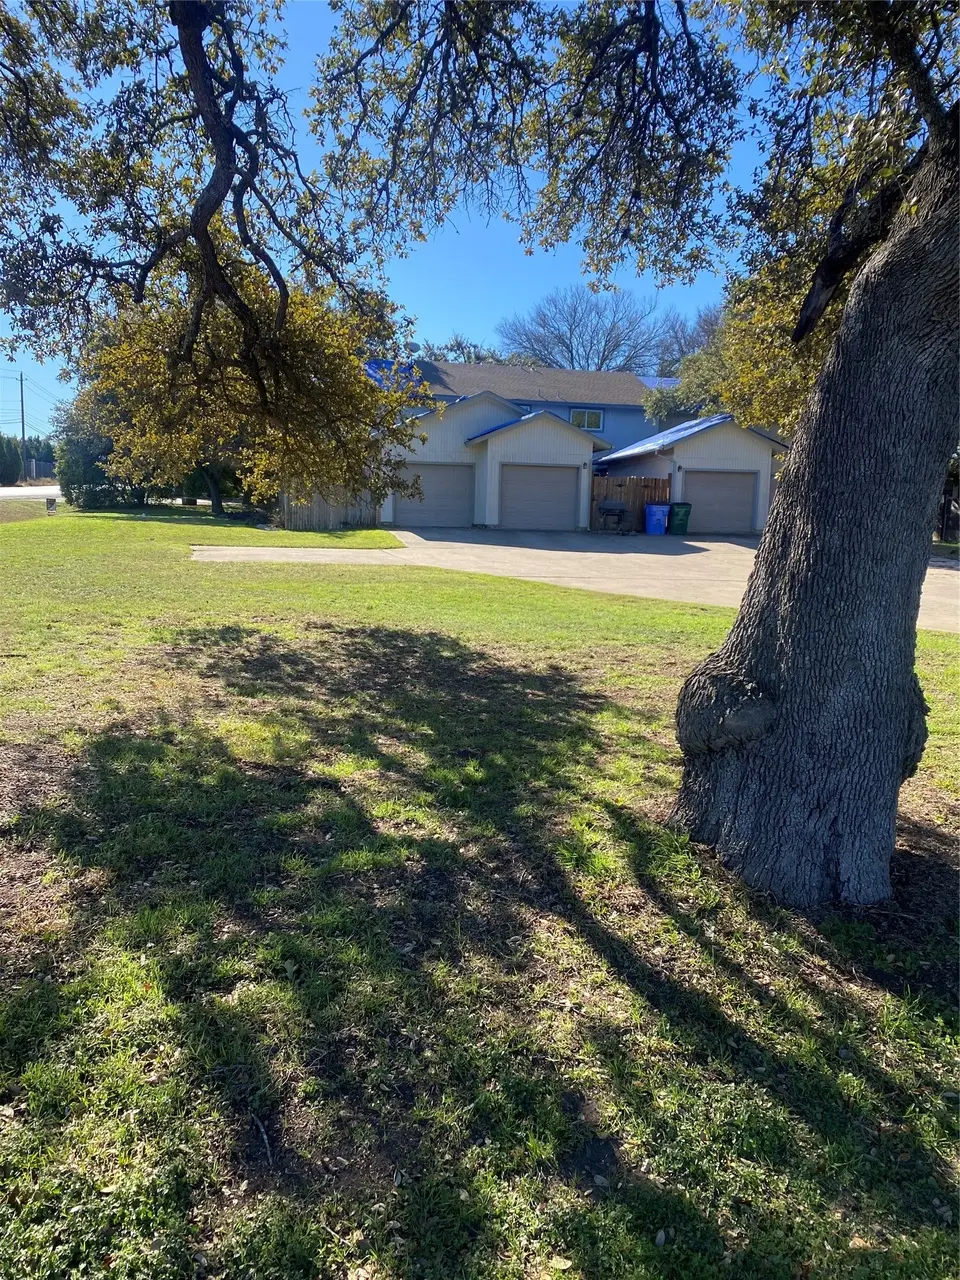
4204 Hudson Bend Rd Unit A · Hudson Bend, TX
Flood risk 1/10 · Minimal
- FEMA flood zone
- X (unshaded)
- Chance of flooding over 30 yrs
- 0.0%
- Est. flood insurance / yr
- $507 – $1,088
Fire risk 3/10 · Minor
- Est. fire insurance / yr
- $1,222 – $2,270
Heat risk 8/10 · Major
- Hot days now (above 108°F)
- 7 days/yr
- Hot days in 30 yrs
- 23 days/yr
Wind risk 6/10 · Moderate
- Chance of severe wind over 30 yrs
- 69.0%
Air-quality risk 2/10 · Minimal
- Unhealthy air days now
- 1 days/yr
- Unhealthy air days in 30 yrs
- 1 days/yr
Risk factors via First Street. Map © Google.
Why this score? — see what drove the D grade
The composite is a weighted blend of 9 inputs, each scored 0–100. Each bar is that input's sub-score; the figure is the points it added to the 100-point composite (weight × sub-score).
- ARV discount +15.0/15.0
- Cash flow +6.5/30.0
- Schools +5.5/10.0
- 1% rule +3.8/10.0
- Rent growth +3.6/5.0
- Livability +3.1/5.0
- Condition / age +2.5/5.0
- DSCR +0.8/10.0
- Appreciation +0.0/10.0
$225,000
🖨 Deal sheet (PDF) 📄 Offer letter ✓ Due diligence
Listing remarks MLS
A HIDDEN GEM THIS CONDO IS NESTLED IN A PARK LIKE SETTING WITH TOWERING SHADE TREES. YOU MUST COME INSIDE TO APPRECIATE THIS END UNIT WITH PRIVATE SIDE YARD WOOD DECKING AND THE SECURITY OF HAVING YOUR OWN GARAGE PLUS EXTRA PARKING. RECENTLY UPDATED WITH QUARTZ COUNTERS STAINLESS APPLIANCES, PLUS EXTRA UPGRADES
Key facts
- Extra parking
- Quartz counters
- Recently updated
Tags
Neighborhood map
What this means for you Summary
Snapshot
- This is a 2-bed/2.0-bath condo listed at $225k.
Deal economics
- At list price, monthly cash flow is $-382 ($-5k/yr) — negative.
- To cash-flow at today's rent, offer at most $158k (30.0% below list).
- To meet the 1% rule (rent ≥ 1% of price), the offer needs to be $197k (12.4% below list).
- Recommended offer: $158k (30.0% below list) — sets the bar for cash-flow.
- Cap rate 4.3% vs local median 1.5% in Hudson Bend — top-decile yield for the area; either an underpriced asset or a hidden risk that comps aren't pricing in. Stress-test before assuming the spread holds.
Location & tenants
- Location reads 61/100 on livability (#1,006 in TX) — a middle-class / working-renter tenant base. Strengths: crime A+, employment A+, housing A+; Watch: schools D, amenities F, commute F.
- Lake Travis ISD (rural): math 57% / reading 61% proficiency, ranked #39 of 826 in TX (top 5%) — acceptable for families but not a draw, mixed tenant base, ~2y average lease; only 15% free/reduced lunch — higher-income household profile.
- Market conditions: Rents rising fast (+4.5%/yr); 478 active listings in the ZIP; 15 comparable units currently listed for rent nearby; rentals at typical pace (median 25d on market — plan ~3-4 weeks tenant-placement turnaround); high-income renter base; 17,121 units permitted in Travis County in 2024 (11,963 in 5+ unit buildings).
Forward outlook
- Local home prices are declining (-3.0%/yr); year-one equity from $2k of loan paydown is wiped out by about $7k of value loss. Plan a longer hold.
- Travis County population projected at +60% by 2050 — long-run rental-demand tailwind backs the buy-and-hold thesis.
Negotiation context
- It's been on market 534 days — a 12% lower offer ($198k) is reasonable based on typical stale-listing flexibility.
- 7 sale attempts since 27y ago; this cycle's ask has dropped $125k (36%) from the opening price — seller is motivated, your offer sets the floor, not the list.
- Current owner paid $54k; list at $225k implies a 321% gain — meaningful room to come down on a strong offer.
Risks & watch-outs
- Climate carrying-cost: major wind risk, 69% chance of damaging wind over 30y; extreme-heat days projected 7→23/yr by 2055 (HVAC capex compounding) — expect insurance premiums to compound above CPI over the hold.
Questions for the listing agent
- What do current leases actually rent for vs. the listed asking? Can we see a recent rent roll and the last 12 months of T-12 income?
- It's been on market 534 days. Have you received any prior offers? Is the seller open to a 30% concession, seller financing, or rate buy-down credit?
- What does the HOA fee cover, when was the last increase, and are there any pending special assessments or reserve-fund shortfalls?
- Any open or pending special assessments — roof, HVAC, plumbing, elevator, façade? What's the per-unit balance and payoff schedule, and is the seller paying it off at close or rolling it to the buyer?
- Why hasn't it sold? Are there any deal-killer items the seller is aware of (foundation, flood, title, zoning, code violations)?
- Is there a deadline driving the sale (1031 exchange, divorce, estate, relocation)? That informs how much negotiation room exists.
- Schools are D-rated, which usually means shorter tenancies and higher turnover. Who's the typical renter profile here, and what's been the actual vacancy rate?
- The area grade is low — what's the realistic commute time and amenity access for the typical tenant pool here? Any planned neighborhood developments (good or bad) we should know about?
- What's the average days-on-market for RENTAL listings here right now (not sales)? A rising rental-DOM trend means longer vacancies and softer asking-rent achievability than the comps imply.
- What's the recent tenant-quality profile in this submarket — average credit score on applications, eviction rate, late-payment / NSF rate, and stable-employment percentage? A property-management company in the area should have these aggregated.
- How much new apartment / multifamily construction is in the pipeline within 1–3 miles? Heavy new supply (>2% of stock underway) typically softens rents 12–24 months out; light construction supports rent growth.
Investment metrics
- 1% rule
- 0.88% ✗
- Cap rate
- 4.26%
- Cash-on-cash
- -7.28%
- DSCR
- 0.68
- GRM
- 9.5
CMA / ARV
- ARV (median comp)
- $370,000
- List price
- $225,000
- Delta
- -39.19%
- Verdict
- UNDERPRICED
- Comps
- 7 within 1.0 mi
Projected returns pro-forma
-3.0% appreciation · 4.54% rent growth · sell at horizon
- IRR
- -26.6%
- Equity multiple
- 0.09×
- Total profit
- $-57,425
- Equity at exit
- $33,548
- IRR
- -18.0%
- Equity multiple
- -0.07×
- Total profit
- $-67,127
- Equity at exit
- $19,454
Cash invested: $63,000 (down + closing). Projections, not guarantees.
Landlord ↔ Tenant lean methodology
- Overall (STATE)
- 87 Strongly Landlord-Friendly
- State Texas
- 87 Strongly Landlord-Friendly · R+5
- County
- — inherits STATE
- City
- — inherits STATE
ZIP-level market 78734
- Rents YoY
- 4.5%
- Active inventory
- 478
- Price-to-rent
- 9.5×
Monthly cashflow live
- Estimated rent
- $1,971 high interval (Pro) →
- Mortgage (P&I)
- −$1,180
- Tax from tax record
- −$365 /mo · $4,383/yr
- Insurance
- −$94
- HOA
- −$300
- Vacancy / Maint / Mgmt
- −$414
- Net cashflow
- $-382
Break-even live
Sensitivity live
| Price | -10% $-255 | -5% $-318 | +0% $-382 | +5% $-446 | +10% $-509 |
|---|---|---|---|---|---|
| Rent | -10% $-538 | -5% $-460 | +0% $-382 | +5% $-304 | +10% $-226 |
| Rate | -1.0pp $-269 | -0.5pp $-325 | base $-382 | +0.5pp $-440 | +1.0pp $-500 |
UW: 25.0% down · 7.5% · 30yr · 1.5% tax · 5.0% vac · 8.0% maint · 8.0% mgmt
Financing live
Cash to close
- Down payment
- $56,250
- Closing costs
- $6,750
- Reserves months
- —
- Total cash needed
- —
Loan-product check · same deal, 3 products live
Conventional
25% down · 7.5% · 30yr
- Down + closing
- —
- Monthly P&I
- —
- Monthly cashflow
- —
- DSCR
- —
- Eligible?
- —
Personal DTI + credit; lowest rate.
DSCR
20% down · 8.5% · 30yr
- Down + closing
- —
- Monthly P&I
- —
- Monthly cashflow
- —
- DSCR
- —
- Eligible?
- —
No personal income docs; deal must DSCR.
Hard money
10% down · 12.0% · 12mo
- Down + closing
- —
- Monthly P&I
- —
- Monthly cashflow
- —
- DSCR
- —
- Eligible?
- —
Short-term bridge; refi at stabilization.
Rent comps 15 comps
| Address | Beds | Baths | Sqft | Rent | $/sqft | DOM | Units | Dist |
|---|---|---|---|---|---|---|---|---|
| 3904 Hudson Bend Rd Unit D Austin, TX | 2.0 | 1.5 | 1160 | $1,415 | $1.22 | 24d | 1 | 0.24mi |
| 3904 Hudson Bend Rd Unit D Austin, TX | 2.0 | 1.5 | 1160 | $1,415 | $1.22 | 22d | 1 | 0.24mi |
| 3904 Hudson Bend Rd Austin, TX | 2.0 | 2.0 | 1160 | $1,600 | $1.38 | 44d | 1 | 0.24mi |
| 3904 Hudson Bend Rd Unit A Austin, TX | 2.0 | 1.5 | 1160 | $1,495 | $1.29 | 22d | 1 | 0.24mi |
| 15303 Texas St Austin, TX | 2.0 | 2.0 | 1240 | $2,400 | $1.94 | 24d | 1 | 0.47mi |
| 15104 Texas St Austin, TX | 2.0 | 1.0 | 804 | $1,875 | $2.33 | 44d | 1 | 0.49mi |
| 2918 Ranch to Market Road 620 Unit 172 Austin, TX | 2.0 | 2.0 | 1161 | $1,995 | $1.72 | 44d | 1 | 0.89mi |
| 2918 Ranch Road 620 N Unit Y194 Austin, TX | 2.0 | 2.0 | 1204 | $2,195 | $1.82 | 5d | 1 | 0.95mi |
| 2918 Ranch Road 620 N Unit V267 Austin, TX | 2.0 | 2.0 | 1160 | $2,100 | $1.81 | 44d | 1 | 0.95mi |
| 15216 Kevin Ln Austin, TX | 3.0 | 2.0 | 1472 | $2,395 | $1.63 | 24d | 1 | 0.97mi |
| 2918 Ranch Rd 620 N Apt 272 Austin, TX | 2.0 | 2.5 | 1395 | $2,195 | $1.57 | 4d | 1 | 0.99mi |
| 16001 Awalt Dr Austin, TX | 2.0 | 2.0 | 1010 | $2,500 | $2.48 | 44d | 1 | 0.99mi |
| 2918 Ranch Rd 620 N #265 Austin, TX | 2.0 | 2.0 | 1204 | $2,100 | $1.74 | 3d | 1 | 1.00mi |
| 16109 Awalt Dr Unit B Austin, TX | 3.0 | 2.0 | 1500 | $1,800 | $1.20 | 4d | 1 | 1.07mi |
| 3248 Brass Buttons Trl Austin, TX | 3.0 | 2.0 | 1238 | $2,200 | $1.78 | 24d | 1 | 1.24mi |
HOA detail condo
- Monthly dues
- $300 · $3,600/yr
- Likely covers
- security
- Assessments
- None detected in remarks — confirm with the listing agent.
Listing history 38 events
-
2026-06-18days on market $225,000 Active 534 DOM
-
2026-06-17days on market $225,000 Active 533 DOM
-
2026-06-16days on market $225,000 Active 532 DOM
-
2026-06-15days on market $225,000 Active 531 DOM
-
2026-06-13days on market $225,000 Active 529 DOM
-
2026-06-09days on market $225,000 Active 525 DOM
-
2026-06-08days on market $225,000 Active 524 DOM
-
2026-06-07days on market $225,000 Active 523 DOM
-
2026-06-04days on market $225,000 Active 520 DOM
-
2026-06-03days on market $225,000 Active 519 DOM
-
2026-06-02days on market $225,000 Active 518 DOM
-
2026-06-01days on market $225,000 Active 517 DOM
-
2026-05-31days on market $225,000 Active 516 DOM
-
2026-03-19price $225,000 314-char remark
Show marketing remark (314 chars)
A HIDDEN GEM THIS CONDO IS NESTLED IN A PARK LIKE SETTING WITH TOWERING SHADE TREES. YOU MUST COME INSIDE TO APPRECIATE THIS END UNIT WITH PRIVATE SIDE YARD WOOD DECKING AND THE SECURITY OF HAVING YOUR OWN GARAGE PLUS EXTRA PARKING. RECENTLY UPDATED WITH QUARTZ COUNTERS STAINLESS APPLIANCES, PLUS EXTRA UPGRADES
-
2026-01-19status Active 314-char remark
Show marketing remark (314 chars)
A HIDDEN GEM THIS CONDO IS NESTLED IN A PARK LIKE SETTING WITH TOWERING SHADE TREES. YOU MUST COME INSIDE TO APPRECIATE THIS END UNIT WITH PRIVATE SIDE YARD WOOD DECKING AND THE SECURITY OF HAVING YOUR OWN GARAGE PLUS EXTRA PARKING. RECENTLY UPDATED WITH QUARTZ COUNTERS STAINLESS APPLIANCES, PLUS EXTRA UPGRADES
-
2026-01-19price $250,000 314-char remark
Show marketing remark (314 chars)
A HIDDEN GEM THIS CONDO IS NESTLED IN A PARK LIKE SETTING WITH TOWERING SHADE TREES. YOU MUST COME INSIDE TO APPRECIATE THIS END UNIT WITH PRIVATE SIDE YARD WOOD DECKING AND THE SECURITY OF HAVING YOUR OWN GARAGE PLUS EXTRA PARKING. RECENTLY UPDATED WITH QUARTZ COUNTERS STAINLESS APPLIANCES, PLUS EXTRA UPGRADES
-
2026-01-10historical Active Under Contract 314-char remark
Show marketing remark (314 chars)
A HIDDEN GEM THIS CONDO IS NESTLED IN A PARK LIKE SETTING WITH TOWERING SHADE TREES. YOU MUST COME INSIDE TO APPRECIATE THIS END UNIT WITH PRIVATE SIDE YARD WOOD DECKING AND THE SECURITY OF HAVING YOUR OWN GARAGE PLUS EXTRA PARKING. RECENTLY UPDATED WITH QUARTZ COUNTERS STAINLESS APPLIANCES, PLUS EXTRA UPGRADES
-
2025-12-02price $265,000 314-char remark
Show marketing remark (314 chars)
A HIDDEN GEM THIS CONDO IS NESTLED IN A PARK LIKE SETTING WITH TOWERING SHADE TREES. YOU MUST COME INSIDE TO APPRECIATE THIS END UNIT WITH PRIVATE SIDE YARD WOOD DECKING AND THE SECURITY OF HAVING YOUR OWN GARAGE PLUS EXTRA PARKING. RECENTLY UPDATED WITH QUARTZ COUNTERS STAINLESS APPLIANCES, PLUS EXTRA UPGRADES
-
2025-09-26price $317,000 314-char remark
Show marketing remark (314 chars)
A HIDDEN GEM THIS CONDO IS NESTLED IN A PARK LIKE SETTING WITH TOWERING SHADE TREES. YOU MUST COME INSIDE TO APPRECIATE THIS END UNIT WITH PRIVATE SIDE YARD WOOD DECKING AND THE SECURITY OF HAVING YOUR OWN GARAGE PLUS EXTRA PARKING. RECENTLY UPDATED WITH QUARTZ COUNTERS STAINLESS APPLIANCES, PLUS EXTRA UPGRADES
-
2025-08-10price $327,000 314-char remark
Show marketing remark (314 chars)
A HIDDEN GEM THIS CONDO IS NESTLED IN A PARK LIKE SETTING WITH TOWERING SHADE TREES. YOU MUST COME INSIDE TO APPRECIATE THIS END UNIT WITH PRIVATE SIDE YARD WOOD DECKING AND THE SECURITY OF HAVING YOUR OWN GARAGE PLUS EXTRA PARKING. RECENTLY UPDATED WITH QUARTZ COUNTERS STAINLESS APPLIANCES, PLUS EXTRA UPGRADES
-
2024-12-31$350,000 Active 314-char remark
Show marketing remark (314 chars)
A HIDDEN GEM THIS CONDO IS NESTLED IN A PARK LIKE SETTING WITH TOWERING SHADE TREES. YOU MUST COME INSIDE TO APPRECIATE THIS END UNIT WITH PRIVATE SIDE YARD WOOD DECKING AND THE SECURITY OF HAVING YOUR OWN GARAGE PLUS EXTRA PARKING. RECENTLY UPDATED WITH QUARTZ COUNTERS STAINLESS APPLIANCES, PLUS EXTRA UPGRADES
-
2023-10-03historical $1,850
-
2023-09-03$1,850
-
2016-02-19soldstatus
-
2009-03-31historical
-
2008-09-27
-
2005-08-22soldstatus
-
2005-08-15soldstatus
-
2005-07-12historical
-
2005-05-09$98,500
-
2005-01-20soldstatus
-
1999-09-13soldstatus
-
1999-09-10soldstatus
-
1999-07-23historical
-
1999-07-13historical
-
1999-06-18
-
1999-04-08$79,900
-
1995-10-11soldstatus $53,500
ⓘ Source: listings_history table (triggers on properties + properties_extension) + one-shot
backfill from property_details.listing_events for pre-trigger history.
Tax reassessment forecast TX · Resets to sale price
- Current annual tax
- $4,383 · $365/mo
- Projected year-2 tax
- $4,383 · $365/mo
- Expected delta
- $0/yr ($0/mo · 0.0%)
ⓘ Screening estimate from a state-policy table — verify with the county assessor before closing.
Climate risk First Street
- Flood 1/10 Low FEMA zone X (unshaded) · 0% chance over 30 yrs
- Wildfire 3/10 Moderate
- Heat 8/10 Severe 7 d/yr ≥108°F today · 23 d/yr by 30 yrs out
- Wind 6/10 Major 69% chance of damaging wind over 30 yrs
- Air quality 2/10 Low 1 unhealthy d/yr today · 1 by 30 yrs out
Nearby sold comps map
Loading sold comps map…
Walkable amenities ~0.75 mi
Loading nearby amenities…
Taxation est. · year 1
- Rental income
- $23,649
- − Mortgage interest
- −$12,603
- − Property taxes
- −$4,383
- − Insurance
- −$1,125
- − Repairs & maintenance
- −$1,892
- − Management
- −$1,892
- − HOA
- −$3,600
- − Depreciation
- −$6,545
- Taxable loss
- −$8,392
- Est. tax savings @ 24.0%
- +$2,014
- After-tax cash flow
- $-2,570/yr
For passive investors: Depreciation is non-cash, so a rental often shows a tax loss while cash-flowing — sheltering income. Rental losses are passive: they offset passive income freely, and up to $25,000/yr can offset ordinary (W-2) income if you actively participate and your MAGI is under $100k (phasing out to $0 by $150k); unused losses carry forward. On sale, claimed depreciation is recaptured at up to 25%, and gains may owe capital-gains tax (a 1031 exchange can defer both). Figures are a year-1 estimate at your 24.0% rate — not tax advice; consult a CPA.
Schools (NCES district)
- District
- Lake Travis ISD
- NCES district ID
- 4826470
- Math proficiency
- 57% ▼ -12.00%
- Reading proficiency
- 61% ▼ -9.00%
- Median HH income
- $101,194
- Composite
- 55.13/100
- National rank
- #1283
- State rank
- #39 of 826 in TX
Livability — Hudson Bend
- Score
- 61/100
- State rank
- #1006
- US rank
- #17863
Category grades
Schools grade is shown separately in the Schools card above.
Census & demographics
- Census place
- Hudson Bend, TX
- County
- Travis County · 1,299,254 people
- Metro
- Austin-Round Rock-Georgetown, TX
- Population (ZIP)
- 22,145
- Household income
- $130,784
- Rent vs Own
- Severe rent burden
- 296.0
Population outlook (Travis County) Hauer SSP2
- Today (2025)
- 1,545,133 people
- By 2030
- 1,729,269 · +11.9%
- By 2040
- 2,097,596 · +35.8%
- By 2050
- 2,463,890 · +59.5%
- By 2075
- 3,249,374 · +110.3%
- By 2100
- 3,801,868 · +146.1%
Race, ethnicity, and origin ACS 2023
- Neighborhood character
- Predominantly White (76%)
- Race & ethnicity
- White 76% Hispanic / Latino 15% Two or more races 10% Asian 4% Black 1%
- Hispanic origin (detail)
- Mexican 13%
- Common ancestry
- Italian 6% Iranian 4% Slovak 3%
- Foreign-born
- 13% · Canada, China, Vietnam
- Languages at home
- 84% English-only · Spanish 10% Other Indo-European 2% Russian/Polish/Slavic 1%
Political lean MEDSL · Travis
- 2024 margin
- Solid D (+39.3) · D 68.8% · R 29.4% · Other 1.8%
- 2008→2024 swing
- +9.9pp toward D · 2008: 29.4pp · 2024: 39.3pp
- All cycles
- 2024: D+39.3 2020: D+45.0 2016: D+38.9 2012: D+23.9 2008: D+29.4
Not yet ingested
- Civics
- —
Market trends
- HPI YoY
- ▼ -227.08%
- Current HPI
- 216.0323
- Rent YoY
- ▲ 4.54%
- Metro
- Austin-Round Rock-Georgetown, TX
- State GDP YoY
- ▲ 3.95%
- F500 in state
- 110
Industry mix (Fortune 500 HQ in TX)
| Industry | F500 HQs | Revenue |
|---|---|---|
| Energy | 16 | $1,198B |
|
||
| Technology | 5 | $198B |
|
||
| Engineering / Construction | 4 | $72B |
|
||
| Energy Services | 3 | $60B |
|
||
| Utilities | 3 | $41B |
|
||
| Healthcare | 2 | $330B |
|
||
Price history
+320.6% since first listed25 events — show timeline
- 2026-03-19 Price Changed $225,000 Unlock MLS
- 2026-01-19 Relisted — Unlock MLS
- 2026-01-19 Price Changed $250,000 Unlock MLS
- 2026-01-10 Contingent — Unlock MLS
- 2025-12-02 Price Changed $265,000 Unlock MLS
- 2025-09-26 Price Changed $317,000 Unlock MLS
- 2025-08-10 Price Changed $327,000 Unlock MLS
- 2024-12-31 Listed $350,000 Unlock MLS
- 2023-10-03 Rental Removed $1,850 ACTRIS
- 2023-09-03 Listed for Rent $1,850 ACTRIS
- 2016-02-19 Sold (Public Records) — Public Records
- 2009-03-31 Delisted — Unlock MLS
- 2008-09-27 Listed — Unlock MLS
- 2005-08-22 Sold (Public Records) — Public Records
- 2005-08-15 Sold (MLS) — Unlock MLS
- 2005-07-12 Delisted — Unlock MLS
- 2005-05-09 Listed $98,500 Unlock MLS
- 2005-01-20 Sold (Public Records) — Public Records
- 1999-09-13 Sold (Public Records) — Public Records
- 1999-09-10 Sold (MLS) — Unlock MLS
- 1999-07-23 Delisted — Unlock MLS
- 1999-07-13 Delisted — Unlock MLS
- 1999-06-18 Listed — Unlock MLS
- 1999-04-08 Listed $79,900 Unlock MLS
- 1995-10-11 Sold (Public Records) $53,500 Public Records
Property tax history
+3.3%/yrLatest (2026): $4,383 · +12.7% YoY. Source: county tax records.
Cash-flow waterfall
monthlySold comps — $/sqft
last 12 mo · ≤1 miLoading sold comps…