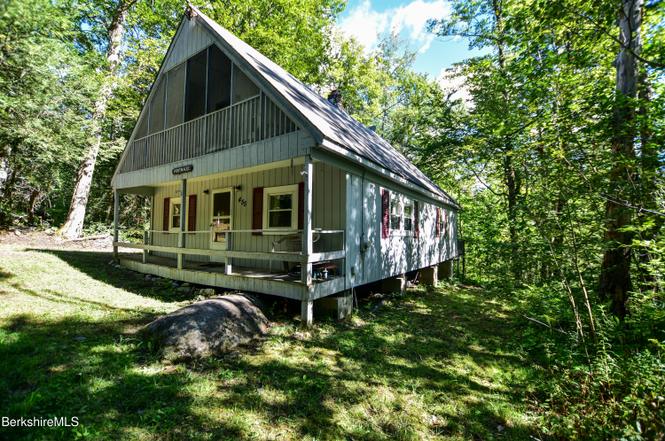
455 King Richard Dr · Chester, MA
Flood risk 1/10 · Minimal
- FEMA flood zone
- —
- Chance of flooding over 30 yrs
- 0.0%
- Est. flood insurance / yr
- —
Fire risk 3/10 · Minor
- Est. fire insurance / yr
- $915 – $1,699
Heat risk 2/10 · Minimal
- Hot days now (above 89°F)
- 7 days/yr
- Hot days in 30 yrs
- 17 days/yr
Wind risk 4/10 · Minor
- Chance of severe wind over 30 yrs
- 17.0%
Air-quality risk 2/10 · Minimal
- Unhealthy air days now
- 1 days/yr
- Unhealthy air days in 30 yrs
- 1 days/yr
Risk factors via First Street. Map © Google.
Why this score? — see what drove the D+ grade
The composite is a weighted blend of 9 inputs, each scored 0–100. Each bar is that input's sub-score; the figure is the points it added to the 100-point composite (weight × sub-score).
- Cash flow +17.9/30.0
- Appreciation +10.0/10.0
- DSCR +5.6/10.0
- 1% rule +3.9/10.0
- Livability +3.7/5.0
- Schools +3.5/10.0
- Rent growth +2.5/5.0
- Condition / age +2.5/5.0
- ARV discount +0.0/15.0
$199,000
🖨 Deal sheet 📄 Offer letter ✓ Due diligence
Listing remarks MLS
Adorable three season Challat in Sherwood Forest community. 3 bedrooms, 1 bathroom. Quick walk to the beach for non-motorboat activities and swimming.
Key facts
- Fieldstone fireplace
- Front porch
- Back deck
Tags
Neighborhood map
What this means for you Summary
Snapshot
- This is a 3-bed/1.0-bath single-family listed at $199k.
Deal economics
- At list price, monthly cash flow is $169 ($2k/yr) — positive.
- The deal already cash-flows at list — no discount required.
- To meet the 1% rule (rent ≥ 1% of price), the offer needs to be $177k (10.9% below list).
- Recommended offer: $175k (12.0% below list) — sets the bar for market timing.
- Cap rate 7.3% vs local median 2.0% in Chester — top-decile yield for the area; either an underpriced asset or a hidden risk that comps aren't pricing in. Stress-test before assuming the spread holds.
Location & tenants
- Location reads 74/100 on livability (#91 in MA, #4,646 nationally) — a middle-class / working-renter tenant base. Strengths: crime A+, housing A+, employment A; Watch: amenities F, commute F.
- Central Berkshire (rural): math 32% / reading 47% proficiency, ranked #206 of 302 in MA (top 68%) — families likely to look elsewhere, expect single-tenant / working-renter base with shorter leases.
- Zoned schools: Becket Washington School (math 34% / reading 54%, grade F, #421 of 938 statewide, top 48%, 100 students, 0% FRL); Nessacus Regional Middle School (math 27% / reading 44%, grade F, #175 of 305 statewide, top 58%, 345 students, 0% FRL); Wahconah Regional High (math 47% / reading 62%, grade C-, #157 of 343 statewide, top 47%, 485 students, 0% FRL) — zoned schools average 0% FRL vs 26% district-wide (26 pts lower); this property's tenant base skews higher-income than the district average.
- Market conditions: 73 active listings in the ZIP; 130 units permitted in Berkshire County in 2024 (10 in 5+ unit buildings).
Forward outlook
- In year one you build about $21k of equity ($1k loan paydown + $20k appreciation (10.0% local appreciation)).
- Berkshire County population projected at -24% by 2050 — secular population decline; favor cash flow + early exit over multi-decade hold.
- At projected returns (10.0% appreciation + 3.0% rent growth), your $56k cash investment doubles in ~3 years — after that, you're playing with house money.
- By year 2, paydown + projected appreciation supports a ~$34k cash-out refi (75% LTV) — recoverable capital for the next deal without selling this one.
Negotiation context
- It's been on market 232 days — a 12% lower offer ($175k) is reasonable based on typical stale-listing flexibility.
- 4 sale attempts since 25y ago; this cycle's ask has dropped $26k (12%) from the opening price — seller is motivated, your offer sets the floor, not the list.
- Current owner paid $80k; list at $199k implies a 149% gain — meaningful room to come down on a strong offer.
Questions for the listing agent
- It's been on market 232 days. Have you received any prior offers? Is the seller open to a 12% concession, seller financing, or rate buy-down credit?
- Built in 1968 — when were the roof, HVAC, electrical panel, plumbing, and water heater last replaced?
- Why hasn't it sold? Are there any deal-killer items the seller is aware of (foundation, flood, title, zoning, code violations)?
- Is there a deadline driving the sale (1031 exchange, divorce, estate, relocation)? That informs how much negotiation room exists.
- The area grade is low — what's the realistic commute time and amenity access for the typical tenant pool here? Any planned neighborhood developments (good or bad) we should know about?
- What's the average days-on-market for RENTAL listings here right now (not sales)? A rising rental-DOM trend means longer vacancies and softer asking-rent achievability than the comps imply.
- What's the recent tenant-quality profile in this submarket — average credit score on applications, eviction rate, late-payment / NSF rate, and stable-employment percentage? A property-management company in the area should have these aggregated.
- How much new for-sale + rental construction is in the pipeline within 1–3 miles? Heavy new supply typically softens prices + rents 12–24 months out; constrained supply supports both.
Investment metrics
- 1% rule
- 0.89% ✗
- Cap rate
- 7.31%
- Cash-on-cash
- 3.64%
- DSCR
- 1.16
- GRM
- 9.3
CMA / ARV
- ARV (on-the-fly)
- $169,884
- Comps found
- 3
Show comp detail 3 sales within ~0.75 mi
| Address | Dist | Beds/Ba | Sqft | Sold | Price | $/sf | Match |
|---|---|---|---|---|---|---|---|
| 455 King Richard Dr | 0.00mi | 3/1.0 | 1,404 (0%) | 1mo | $170,000 | $121 | 99 |
| 358 Prince John Dr | 0.28mi | 3/1.5 | 1,504 (+7%) | 24mo | $32,000 | $21 | 53 |
| 22 Little John Dr | 0.60mi | 4/2.0 (+1) | 1,380 (-2%) | 11mo | $325,000 | $236 | 51 |
Match score weights: distance 35% · size 25% · config 20% · recency 20%. Top-matched comps best support the ARV.
Projected returns pro-forma
10.0% appreciation · 3.0% rent growth · sell at horizon
- IRR
- 26.9%
- Equity multiple
- 3.14×
- Total profit
- $119,070
- Equity at exit
- $179,275
- IRR
- 23.5%
- Equity multiple
- 7.14×
- Total profit
- $342,067
- Equity at exit
- $386,613
Cash invested: $55,720 (down + closing). Projections, not guarantees.
Landlord ↔ Tenant lean methodology
- Overall (STATE)
- 20 Strongly Tenant-Friendly
- State Massachusetts
- 20 Strongly Tenant-Friendly · D+15
- County
- — inherits STATE
- City
- — inherits STATE
ZIP-level market 01223
- Home prices YoY
- 6.8%
- Active inventory
- 73
- Price-to-rent
- 9.3×
Monthly cashflow live
- Estimated rent
- $1,774 medium interval (Pro) →
- Mortgage (P&I)
- −$1,044
- Tax from tax record
- −$106 /mo · $1,273/yr
- Insurance
- −$83
- HOA
- −$0
- Vacancy / Maint / Mgmt
- −$373
- Net cashflow
- $169
Break-even live
UW: 25.0% down · 7.5% · 30yr · 1.5% tax · 5.0% vac · 8.0% maint · 8.0% mgmt
Financing live
Cash to close
- Down payment
- $49,750
- Closing costs
- $5,970
- Reserves months
- —
- Total cash needed
- —
Loan-product check · same deal, 3 products live
Conventional
25% down · 7.5% · 30yr
- Down + closing
- —
- Monthly P&I
- —
- Monthly cashflow
- —
- DSCR
- —
- Eligible?
- —
Personal DTI + credit; lowest rate.
DSCR
20% down · 8.5% · 30yr
- Down + closing
- —
- Monthly P&I
- —
- Monthly cashflow
- —
- DSCR
- —
- Eligible?
- —
No personal income docs; deal must DSCR.
Hard money
10% down · 12.0% · 12mo
- Down + closing
- —
- Monthly P&I
- —
- Monthly cashflow
- —
- DSCR
- —
- Eligible?
- —
Short-term bridge; refi at stabilization.
Listing history 11 events
-
2026-04-28status Pending
-
2025-10-26price $199,000
-
2025-09-05$225,000 Active
-
2006-07-03soldstatus $80,000 150-char remark
Show marketing remark (150 chars)
Adorable three season Challat in Sherwood Forest community. 3 bedrooms, 1 bathroom. Quick walk to the beach for non-motorboat activities and swimming.
-
2006-06-30soldstatus $80,000
-
2006-06-01historical
-
2006-01-21$99,900
-
2005-06-27$99,900 150-char remark
Show marketing remark (150 chars)
Adorable three season Challat in Sherwood Forest community. 3 bedrooms, 1 bathroom. Quick walk to the beach for non-motorboat activities and swimming.
-
2001-12-07soldstatus $80,000
-
2001-12-06soldstatus $64,800
-
2001-06-16$84,800
ⓘ Source: listings_history table (triggers on properties + properties_extension) + one-shot
backfill from property_details.listing_events for pre-trigger history.
Tax reassessment forecast MA · Partial reset (capped growth)
- Current annual tax
- $1,273 · $106/mo
- Projected year-2 tax
- $1,860 · $155/mo
- Expected delta
- +$587/yr (+$49/mo · 46.1%)
ⓘ Screening estimate from a state-policy table — verify with the county assessor before closing.
Climate risk First Street
- Flood 1/10 Low 0% chance over 30 yrs
- Wildfire 3/10 Moderate
- Heat 2/10 Low 7 d/yr ≥89°F today · 17 d/yr by 30 yrs out
- Wind 4/10 Moderate 17% chance of damaging wind over 30 yrs
- Air quality 2/10 Low 1 unhealthy d/yr today · 1 by 30 yrs out
Nearby sold comps map
Loading sold comps map…
Walkable amenities ~0.75 mi
Loading nearby amenities…
Taxation est. · year 1
- Rental income
- $21,287
- − Mortgage interest
- −$11,147
- − Property taxes
- −$1,273
- − Insurance
- −$995
- − Repairs & maintenance
- −$1,703
- − Management
- −$1,703
- − Depreciation
- −$5,789
- Taxable loss
- −$1,323
- Est. tax savings @ 24.0%
- +$318
- After-tax cash flow
- $2,343/yr
For passive investors: Depreciation is non-cash, so a rental often shows a tax loss while cash-flowing — sheltering income. Rental losses are passive: they offset passive income freely, and up to $25,000/yr can offset ordinary (W-2) income if you actively participate and your MAGI is under $100k (phasing out to $0 by $150k); unused losses carry forward. On sale, claimed depreciation is recaptured at up to 25%, and gains may owe capital-gains tax (a 1031 exchange can defer both). Figures are a year-1 estimate at your 24.0% rate — not tax advice; consult a CPA.
Schools (NCES district)
- District
- Central Berkshire
- NCES district ID
- 2503390
- Math proficiency
- 32% ▼ -13.00%
- Reading proficiency
- 47% ▲ 1.00%
- Median HH income
- $58,145
- Composite
- 34.8/100
- National rank
- #5108
- State rank
- #206 of 302 in MA
Livability — Chester
- Score
- 74/100
- State rank
- #91
- US rank
- #4646
Category grades
Schools grade is shown separately in the Schools card above.
Census & demographics
- Population (ZIP)
- 2,588
Population outlook (Berkshire County) Hauer SSP2
- Today (2025)
- 119,723 people
- By 2030
- 114,608 · -4.3%
- By 2040
- 102,806 · -14.1%
- By 2050
- 91,305 · -23.7%
- By 2075
- 71,517 · -40.3%
- By 2100
- 57,988 · -51.6%
Race, ethnicity, and origin ACS 2023
- Neighborhood character
- Predominantly White (91%)
- Race & ethnicity
- White 91% Two or more races 6% Hispanic / Latino 3% Asian 1%
- Common ancestry
- Lithuanian 10% Romanian 6% Slovak 2%
- Foreign-born
- 5%
- Languages at home
- 93% English-only · Russian/Polish/Slavic 2% Other Indo-European 1% Spanish 1%
Political lean MEDSL · Berkshire
- 2024 margin
- Solid D (+39.9) · D 68.9% · R 29.0% · Other 2.1%
- 2008→2024 swing
- -12.5pp toward R · 2008: 52.4pp · 2024: 39.9pp
- All cycles
- 2024: D+39.9 2020: D+47.1 2016: D+41.5 2012: D+53.7 2008: D+52.4
Not yet ingested
- Civics
- —
Market trends
- HPI YoY
- ▲ 19.33%
- Current HPI
- 305.8977
- Rent YoY
- —
- Metro
- —
- State GDP YoY
- ▲ 2.28%
- F500 in state
- 38
Industry mix (Fortune 500 HQ in MA)
| Industry | F500 HQs | Revenue |
|---|---|---|
| Technology | 3 | $17B |
|
||
| Insurance | 2 | $84B |
|
||
| Retail | 2 | $76B |
|
||
| Life Sciences | 1 | $43B |
|
||
| Energy Technology | 1 | $31B |
|
||
| Aerospace / Defense | 1 | $18B |
|
||
Price history
+134.7% since first listed11 events — show timeline
- 2026-04-28 Pending — BCMLS
- 2025-10-26 Price Changed $199,000 BCMLS
- 2025-09-05 Listed $225,000 BCMLS
- 2006-07-03 Sold (MLS) $80,000 BCMLS
- 2006-06-30 Sold (Public Records) $80,000 Public Records
- 2006-06-01 Listing Removed — BCMLS
- 2006-01-21 Listed $99,900 BCMLS
- 2005-06-27 Listed $99,900 BCMLS
- 2001-12-07 Sold (Public Records) $80,000 Public Records
- 2001-12-06 Sold (MLS) $64,800 BCMLS
- 2001-06-16 Listed $84,800 BCMLS
Property tax history
+2.3%/yrLatest (2023): $1,273 · +2.0% YoY. Source: county tax records.
Cash-flow waterfall
monthlySold comps — $/sqft
last 12 mo · ≤1 miLoading sold comps…