 🏗️ New Construction
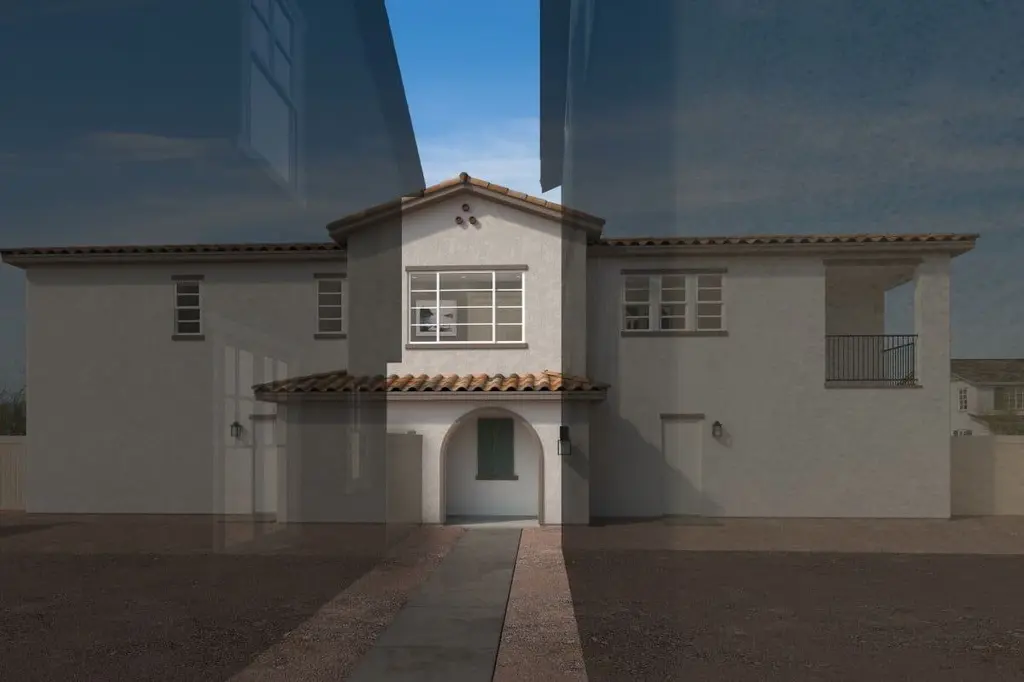
Plan 1510 Modeled Plan · Winchester, CA
Flood risk 1/10 · Minimal
- FEMA flood zone
- X (unshaded)
- Chance of flooding over 30 yrs
- 0.0%
- Est. flood insurance / yr
- $507 – $1,088
Fire risk 7/10 · Major
- Est. fire insurance / yr
- $659 – $1,223
Heat risk 8/10 · Major
- Hot days now (above 105°F)
- 7 days/yr
- Hot days in 30 yrs
- 21 days/yr
Wind risk 1/10 · Minimal
- Chance of severe wind over 30 yrs
- —
Air-quality risk 6/10 · Moderate
- Unhealthy air days now
- 10 days/yr
- Unhealthy air days in 30 yrs
- 14 days/yr
Risk factors via First Street. Map © Google.
Why this score? — see what drove the D- grade
The composite is a weighted blend of 9 inputs, each scored 0–100. Each bar is that input's sub-score; the figure is the points it added to the 100-point composite (weight × sub-score).
- Appreciation +10.0/10.0
- ARV discount +7.5/15.0
- Cash flow +6.3/30.0
- Condition / age +4.0/5.0
- Livability +2.6/5.0
- Schools +2.5/10.0
- Rent growth +2.3/5.0
- 1% rule +1.5/10.0
- DSCR +0.6/10.0
$435,990
🖨 Deal sheet 📄 Offer letter ✓ Due diligence
Listing remarks MLS
* Single-level floor plan above garage * Walk-in shower at primary bath * Private balcony * Engineered stone countertops at full baths * LED lighting * Granite kitchen countertops * Open floor plan * Kitchen island * Dedicated laundry room * Solar energy system * WaterSense® labeled faucets * ENERGY STAR® certified home * Planned swimming pool * Close to medical facilities * Near entertainment and leisure * Outdoor recreation nearby * Close to family friendly parks * Hiking trails nearby
Key facts
- Private balcony
- Walk-in shower
- Kitchen island
Tags
Neighborhood map
What this means for you Summary
Snapshot
- This is a 3-bed/2.0-bath condo listed at $436k. Condition is rated good.
Deal economics
- At list price, monthly cash flow is $-937 ($-11k/yr) — negative.
- To cash-flow at today's rent, offer at most $397k (8.9% below list).
- To meet the 1% rule (rent ≥ 1% of price), the offer needs to be $347k (20.3% below list).
- Recommended offer: $347k (20.3% below list) — sets the bar for 1% rule.
Location & tenants
- Location reads 52/100 on livability (#992 in CA) — a working-class tenant base; expect higher turnover. Strengths: crime B; Watch: schools D, amenities F, commute F.
- Hemet Unified (suburban): math 19% / reading 41% proficiency, ranked #360 of 517 in CA (top 70%) — families likely to look elsewhere, expect single-tenant / working-renter base with shorter leases; 66% free/reduced lunch — lower-income household profile, screen leases tightly.
- Market conditions: Rents soft (-0.8%/yr); 355 active listings in the ZIP; 20 comparable units currently listed for rent nearby; rentals at typical pace (median 15d on market — plan ~3-4 weeks tenant-placement turnaround); high-income renter base; 9,195 units permitted in Riverside County in 2024 (1,512 in 5+ unit buildings).
- This rent runs 31% of the median local income ($133k/yr) — at the standard rent-burdened threshold; future hikes will face affordability resistance.
Forward outlook
- In year one you build about $57k of equity ($4k loan paydown + $53k appreciation (10.0% local appreciation)).
- Riverside County population projected at +22% by 2050 — long-run rental-demand tailwind backs the buy-and-hold thesis.
- By year 2, paydown + projected appreciation supports a ~$92k cash-out refi (75% LTV) — recoverable capital for the next deal without selling this one.
Negotiation context
- It's been on market 93 days — a 9% lower offer ($397k) is reasonable based on typical stale-listing flexibility.
Risks & watch-outs
- Climate carrying-cost: major wildfire risk; extreme-heat days projected 7→21/yr by 2055 (HVAC capex compounding) — expect insurance premiums to compound above CPI over the hold.
Questions for the listing agent
- What do current leases actually rent for vs. the listed asking? Can we see a recent rent roll and the last 12 months of T-12 income?
- It's been on market 93 days. Have you received any prior offers? Is the seller open to a 20% concession, seller financing, or rate buy-down credit?
- Any open or pending special assessments — roof, HVAC, plumbing, elevator, façade? What's the per-unit balance and payoff schedule, and is the seller paying it off at close or rolling it to the buyer?
- Why hasn't it sold? Are there any deal-killer items the seller is aware of (foundation, flood, title, zoning, code violations)?
- Is there a deadline driving the sale (1031 exchange, divorce, estate, relocation)? That informs how much negotiation room exists.
- Schools are D-rated, which usually means shorter tenancies and higher turnover. Who's the typical renter profile here, and what's been the actual vacancy rate?
- The area grade is low — what's the realistic commute time and amenity access for the typical tenant pool here? Any planned neighborhood developments (good or bad) we should know about?
- What's the average days-on-market for RENTAL listings here right now (not sales)? A rising rental-DOM trend means longer vacancies and softer asking-rent achievability than the comps imply.
- What's the recent tenant-quality profile in this submarket — average credit score on applications, eviction rate, late-payment / NSF rate, and stable-employment percentage? A property-management company in the area should have these aggregated.
- How much new apartment / multifamily construction is in the pipeline within 1–3 miles? Heavy new supply (>2% of stock underway) typically softens rents 12–24 months out; light construction supports rent growth.
Investment metrics
- 1% rule
- 0.65% ✗
- Cap rate
- 4.18%
- Cash-on-cash
- -7.54%
- DSCR
- 0.66
- GRM
- 12.8
CMA / ARV
- ARV (median comp)
- $532,687
- List price
- $435,990
- Delta
- -18.15%
- Verdict
- UNDERPRICED
- Comps
- 20 within 1.0 mi
Projected returns pro-forma
10.0% appreciation · 0.0% rent growth · sell at horizon
- IRR
- 18.2%
- Equity multiple
- 2.48×
- Total profit
- $220,335
- Equity at exit
- $479,887
- IRR
- 16.5%
- Equity multiple
- 5.54×
- Total profit
- $677,632
- Equity at exit
- $1,034,894
Cash invested: $149,152 (down + closing). Projections, not guarantees.
Landlord ↔ Tenant lean methodology
- Overall (STATE)
- 18 Strongly Tenant-Friendly
- State California
- 18 Strongly Tenant-Friendly · D+13
- County
- — inherits STATE
- City
- — inherits STATE
ZIP-level market 92596
- Home prices YoY
- 3.9%
- Rents YoY
- -0.8%
- Active inventory
- 355
- Price-to-rent
- 10.5×
Monthly cashflow live
- Estimated rent
- $3,474 high interval (Pro) →
- Mortgage (P&I)
- −$2,793
- Tax est. 1.5%
- −$666 /mo · $7,990/yr
- Insurance
- −$222
- HOA
- −$0
- Vacancy / Maint / Mgmt
- −$730
- Net cashflow
- $-937
Break-even live
UW: 25.0% down · 7.5% · 30yr · 1.5% tax · 5.0% vac · 8.0% maint · 8.0% mgmt
Financing live
Cash to close
- Down payment
- $133,172
- Closing costs
- $15,981
- Reserves months
- —
- Total cash needed
- —
Loan-product check · same deal, 3 products live
Conventional
25% down · 7.5% · 30yr
- Down + closing
- —
- Monthly P&I
- —
- Monthly cashflow
- —
- DSCR
- —
- Eligible?
- —
Personal DTI + credit; lowest rate.
DSCR
20% down · 8.5% · 30yr
- Down + closing
- —
- Monthly P&I
- —
- Monthly cashflow
- —
- DSCR
- —
- Eligible?
- —
No personal income docs; deal must DSCR.
Hard money
10% down · 12.0% · 12mo
- Down + closing
- —
- Monthly P&I
- —
- Monthly cashflow
- —
- DSCR
- —
- Eligible?
- —
Short-term bridge; refi at stabilization.
Rent comps 20 comps
| Address | Beds | Baths | Sqft | Rent | $/sqft | DOM | Units | Dist |
|---|---|---|---|---|---|---|---|---|
| 30816 Viper Ct Winchester, CA | 3.0 | 2.5 | 1583 | $3,249 | $2.05 | 4d | 1 | 0.58mi |
| 30622 Dart Ct Winchester, CA | 3.0 | 2.5 | 1378 | $4,300 | $3.12 | 2d | 1 | 0.62mi |
| 30826 Grand Prix Ct Winchester, CA | 3.0 | 2.5 | 1375 | $2,850 | $2.07 | 24d | 1 | 0.64mi |
| 30547 Operetta St Winchester, CA | 3.0 | 2.5 | 1567 | $3,100 | $1.98 | 18d | 1 | 0.66mi |
| 30812 Malibu Dr Winchester, CA | 3.0 | 2.5 | 1375 | $2,995 | $2.18 | 24d | 1 | 0.66mi |
| 29505 Bovenzi Way Winchester, CA | 4.0 | 2.0 | 1754 | $3,100 | $1.77 | 15d | 1 | 0.82mi |
| 29587 Winterstorm Ct Winchester, CA | 3.0 | 2.5 | 2054 | $3,195 | $1.56 | 12d | 1 | 0.86mi |
| 29429 Cumaru Ct Winchester, CA | 4.0 | 2.5 | 1699 | $3,349 | $1.97 | 1d | 1 | 0.87mi |
| 29424 Cumaru Ct Winchester, CA | 4.0 | 2.5 | 1771 | $3,459 | $1.95 | 20d | 1 | 0.89mi |
| 29430 Cumaru Ct Winchester, CA | 4.0 | 2.5 | 1699 | $3,349 | $1.97 | 7d | 1 | 0.89mi |
| 29471 Granadillo Ct Winchester, CA | 4.0 | 2.5 | 1699 | $3,349 | $1.97 | 20d | 1 | 0.90mi |
| 29449 White Ash Ct Winchester, CA | 3.0 | 2.5 | 1532 | $3,379 | $2.21 | 15d | 1 | 0.91mi |
| 29472 Granadillo Ct Winchester, CA | 4.0 | 2.5 | 1699 | $3,349 | $1.97 | 20d | 1 | 0.92mi |
| 29467 Monterey Pine Ct Winchester, CA | 4.0 | 2.5 | 1771 | $3,429 | $1.94 | 20d | 1 | 0.93mi |
| 29474 Monterey Pine Ct Winchester, CA | 4.0 | 2.5 | 1699 | $3,349 | $1.97 | 7d | 1 | 0.95mi |
| 29475 Jack Pine Ct Winchester, CA | 4.0 | 2.5 | 1699 | $3,269 | $1.92 | 43d | 1 | 0.96mi |
| 29790 Cottonwood Cove Dr Menifee, CA | 3.0 | 2.0 | 1979 | $2,950 | $1.49 | 1d | 1 | 1.04mi |
| 29555 Copper Hill Ct Winchester, CA | 4.0 | 2.5 | 1823 | $3,195 | $1.75 | 2d | 1 | 1.35mi |
| 29406 Grande Vista Ave Menifee, CA | 4.0 | 3.0 | 2152 | $3,350 | $1.56 | 2d | 1 | 1.36mi |
| 32202 Prairie Crossing Dr Winchester, CA | 3.0 | 2.0 | 1948 | $2,950 | $1.51 | 1d | 1 | 1.47mi |
HOA detail condo
- Monthly dues
- $0 · $0/yr
- Likely covers
- waterpool
- Assessments
- None detected in remarks — confirm with the listing agent.
Listing history 17 events
-
2026-06-18days on market $435,990 Active 93 DOM
-
2026-06-17days on market $435,990 Active 92 DOM
-
2026-06-16days on market $435,990 Active 91 DOM
-
2026-06-15days on market $435,990 Active 90 DOM
-
2026-06-13pricedays on market $435,990 Active 88 DOM
-
2026-06-09days on market $433,990 Active 84 DOM
-
2026-06-08days on market $433,990 Active 83 DOM
-
2026-06-07days on market $433,990 Active 82 DOM
-
2026-06-04days on market $433,990 Active 79 DOM
-
2026-06-03days on market $433,990 Active 78 DOM
-
2026-06-02days on market $433,990 Active 77 DOM
-
2026-06-01days on market $433,990 Active 76 DOM
-
2026-05-31days on market $433,990 Active 75 DOM
-
2026-05-02price $429,990 535-char remark
Show marketing remark (535 chars)
* Single-level floor plan above garage * Walk-in shower at primary bath * Private balcony * Engineered stone countertops at full baths * LED lighting * Granite kitchen countertops * Open floor plan * Kitchen island * Dedicated laundry room * Solar energy system * WaterSense® labeled faucets * ENERGY STAR® certified home * Planned swimming pool * Close to medical facilities * Near entertainment and leisure * Outdoor recreation nearby * Close to family friendly parks * Hiking trails nearby
-
2026-04-09price $439,990 535-char remark
Show marketing remark (535 chars)
* Single-level floor plan above garage * Walk-in shower at primary bath * Private balcony * Engineered stone countertops at full baths * LED lighting * Granite kitchen countertops * Open floor plan * Kitchen island * Dedicated laundry room * Solar energy system * WaterSense® labeled faucets * ENERGY STAR® certified home * Planned swimming pool * Close to medical facilities * Near entertainment and leisure * Outdoor recreation nearby * Close to family friendly parks * Hiking trails nearby
-
2026-04-03price $449,990 535-char remark
Show marketing remark (535 chars)
* Single-level floor plan above garage * Walk-in shower at primary bath * Private balcony * Engineered stone countertops at full baths * LED lighting * Granite kitchen countertops * Open floor plan * Kitchen island * Dedicated laundry room * Solar energy system * WaterSense® labeled faucets * ENERGY STAR® certified home * Planned swimming pool * Close to medical facilities * Near entertainment and leisure * Outdoor recreation nearby * Close to family friendly parks * Hiking trails nearby
-
2026-03-17$459,990 Active 535-char remark
Show marketing remark (535 chars)
* Single-level floor plan above garage * Walk-in shower at primary bath * Private balcony * Engineered stone countertops at full baths * LED lighting * Granite kitchen countertops * Open floor plan * Kitchen island * Dedicated laundry room * Solar energy system * WaterSense® labeled faucets * ENERGY STAR® certified home * Planned swimming pool * Close to medical facilities * Near entertainment and leisure * Outdoor recreation nearby * Close to family friendly parks * Hiking trails nearby
ⓘ Source: listings_history table (triggers on properties + properties_extension) + one-shot
backfill from property_details.listing_events for pre-trigger history.
Climate risk First Street
- Flood 1/10 Low FEMA zone X (unshaded) · 0% chance over 30 yrs
- Wildfire 7/10 Severe
- Heat 8/10 Severe 7 d/yr ≥105°F today · 21 d/yr by 30 yrs out
- Wind 1/10 Low
- Air quality 6/10 Major 10 unhealthy d/yr today · 14 by 30 yrs out
Nearby sold comps map
Loading sold comps map…
Walkable amenities ~0.75 mi
Loading nearby amenities…
Taxation est. · year 1
- Rental income
- $41,692
- − Mortgage interest
- −$29,839
- − Property taxes
- −$7,990
- − Insurance
- −$2,663
- − Repairs & maintenance
- −$3,335
- − Management
- −$3,335
- − Depreciation
- −$15,496
- Taxable loss
- −$20,968
- Est. tax savings @ 24.0%
- +$5,032
- After-tax cash flow
- $-6,207/yr
For passive investors: Depreciation is non-cash, so a rental often shows a tax loss while cash-flowing — sheltering income. Rental losses are passive: they offset passive income freely, and up to $25,000/yr can offset ordinary (W-2) income if you actively participate and your MAGI is under $100k (phasing out to $0 by $150k); unused losses carry forward. On sale, claimed depreciation is recaptured at up to 25%, and gains may owe capital-gains tax (a 1031 exchange can defer both). Figures are a year-1 estimate at your 24.0% rate — not tax advice; consult a CPA.
Condition & rehab AI · 12 photos
This single-level home in Winchester, CA, is in excellent condition with a modern design and well-maintained exterior. It offers a good ROI with minimal updates needed.
Value-add opportunities
- Both Landscaping improvements — Enhances curb appeal and adds value to the property.
- Both Smart home integration — Improves convenience and adds modern appeal.
- Both Smart thermostat — Saves energy and adds modern appeal.
- Both Smart security system — Enhances safety and adds modern appeal.
Renovation cost estimate screening
Value-add ROI direction
- Both Landscaping improvements — Enhances curb appeal and adds value to the property. ↑
- Both Smart home integration — Improves convenience and adds modern appeal. ↑
- Both Smart thermostat — Saves energy and adds modern appeal. ↑
- Both Smart security system — Enhances safety and adds modern appeal. ↑
ⓘ Cost ranges are severity-bucket heuristics (US national rule-of-thumb). Get contractor quotes + a written scope before underwriting a rehab budget.
Schools (NCES district)
- District
- Hemet Unified
- NCES district ID
- 0616920
- Math proficiency
- 19% ▼ -3.00%
- Reading proficiency
- 41% ▲ 4.00%
- Median HH income
- $39,962
- Composite
- 25.16/100
- National rank
- #7517
- State rank
- #360 of 517 in CA
Livability — Winchester
- Score
- 52/100
- State rank
- #992
- US rank
- #24750
Category grades
Schools grade is shown separately in the Schools card above.
Census & demographics
- County
- Riverside County · 2,287,001 people
- City population
- 38,981
- Metro
- Riverside-San Bernardino-Ontario, CA
- Population (ZIP)
- 38,981
- Household income
- $132,538
- Rent vs Own
- Severe rent burden
- 591.0
Population outlook (Riverside County) Hauer SSP2
- Today (2025)
- 2,664,475 people
- By 2030
- 2,802,692 · +5.2%
- By 2040
- 3,050,904 · +14.5%
- By 2050
- 3,256,783 · +22.2%
- By 2075
- 3,655,058 · +37.2%
- By 2100
- 3,766,594 · +41.4%
Race, ethnicity, and origin ACS 2023
- Neighborhood character
- Highly diverse neighborhood (Simpson 0.72)
- Race & ethnicity
- White 38% Hispanic / Latino 34% Two or more races 16% Asian 12% Black 6% Pacific Islander 2%
- Hispanic origin (detail)
- Mexican 29%
- Common ancestry
- Slovak 3% Italian 2% Portuguese 1%
- Foreign-born
- 14% · Canada, Vietnam
- Languages at home
- 76% English-only · Spanish 16% Tagalog/Filipino 4% Vietnamese 1%
Political lean MEDSL · Riverside
- 2024 margin
- Toss-up / Even · D 48.0% · R 49.3% · Other 2.6%
- 2008→2024 swing
- -3.6pp toward R · 2008: 2.3pp · 2024: -1.3pp
- All cycles
- 2024: R+1.3 2020: D+8.0 2016: D+4.3 2012: R+0.4 2008: D+2.3
Not yet ingested
- Civics
- —
Market trends
- HPI YoY
- ▲ 12.43%
- Current HPI
- 332.169
- Rent YoY
- ▼ -0.79%
- Metro
- Riverside-San Bernardino-Ontario, CA
- State GDP YoY
- ▲ 3.21%
- F500 in state
- 116
Industry mix (Fortune 500 HQ in CA)
| Industry | F500 HQs | Revenue |
|---|---|---|
| Technology | 27 | $1,492B |
|
||
| Financial Services | 3 | $174B |
|
||
| Retail | 3 | $44B |
|
||
| Insurance | 3 | $26B |
|
||
| Media / Entertainment | 2 | $115B |
|
||
| Pharmaceuticals / Biotech | 2 | $62B |
|
||
Price history
-6.5% since first listed4 events — show timeline
- 2026-05-02 Price Changed $429,990 Zillow
- 2026-04-09 Price Changed $439,990 Zillow
- 2026-04-03 Price Changed $449,990 Zillow
- 2026-03-17 Listed $459,990 Zillow
Cash-flow waterfall
monthlySold comps — $/sqft
last 12 mo · ≤1 miLoading sold comps…