617 Simbury St Unit D-8 · Columbus, OH
Flood risk 1/10 · Minimal
- FEMA flood zone
- X (unshaded)
- Chance of flooding over 30 yrs
- 0.0%
- Est. flood insurance / yr
- $473 – $860
Fire risk 1/10 · Minimal
- Est. fire insurance / yr
- $713 – $1,323
Heat risk 4/10 · Minor
- Hot days now (above 100°F)
- 7 days/yr
- Hot days in 30 yrs
- 18 days/yr
Wind risk 2/10 · Minimal
- Chance of severe wind over 30 yrs
- 1.0%
Air-quality risk 2/10 · Minimal
- Unhealthy air days now
- 1 days/yr
- Unhealthy air days in 30 yrs
- 2 days/yr
Risk factors via First Street. Map © Google.
Why this score? — see what drove the D grade
The composite is a weighted blend of 9 inputs, each scored 0–100. Each bar is that input's sub-score; the figure is the points it added to the 100-point composite (weight × sub-score).
- Cash flow +13.2/30.0
- ARV discount +7.5/15.0
- 1% rule +5.4/10.0
- DSCR +4.0/10.0
- Livability +4.0/5.0
- Schools +3.8/10.0
- Condition / age +3.8/5.0
- Rent growth +2.3/5.0
- Appreciation +0.0/10.0
$165,000
🖨 Deal sheet 📄 Offer letter ✓ Due diligence
Listing remarks
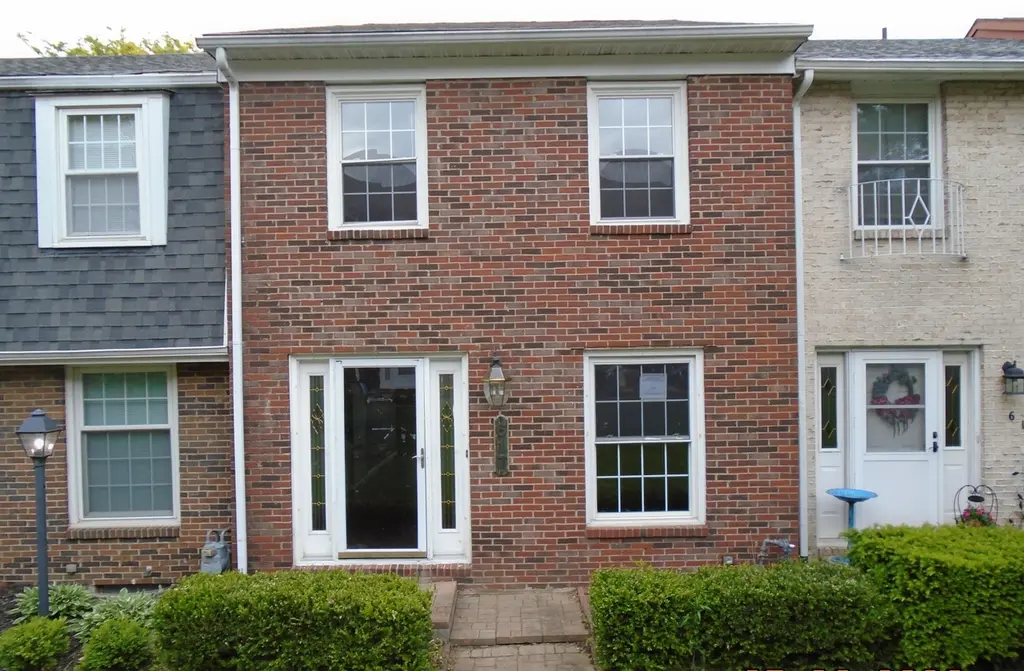
Brick exterior has a nice size living room kitchen with eating space and 3 bedrooms and one full bathroom and 2 half bathrooms and full basement with a rec room and enclosed area with a shed and a carport with parking for 2 cars. Hud Owned Case # 413-780976.''The Seller is selling the property in ''AS-IS'': condition. Seller nor its representatives make any representations or warranties regarding the property. '' FHA Insurability Code is IE Insured with Escrow (subject to FHA appraisal). See Agent to Agent Remarks. EQUAL HOUSING OPPORTUNITY.
Key facts
- Brick exterior
- Rec room
- Carport
Tags
Property features AI
Finance
- Other: HUD owned
- HOA & community: HOA with monthly fee of $215; HOA covers lawn care and snow removal; Community amenities: clubhouse, park, pool
Exterior
- Parking: Carport with 2 spaces
- Utilities: Public water; Public sewer
- Home design: Condominium; Two levels; Built in 1972; 2+ common walls
- Construction: Block foundation
- Exterior features: Patio; Shed(s)
Interior
- Bathrooms: 1 full bathroom; 2 half bathrooms (3 total)
- Heating & cooling: Central air conditioning
- Interior features: Full basement
Neighborhood map
What this means for you Summary
Snapshot
- This is a 3-bed/2.0-bath condo listed at $165k. Condition is rated good.
Deal economics
- At list price, monthly cash flow is $-3 ($-36/yr) — negative.
- To cash-flow at today's rent, offer at most $165k (0.3% below list).
- Meets the 1% rule at list price ($2k rent vs $165k).
- Recommended offer: $163k (1.5% below list) — sets the bar for market timing.
- Cap rate 6.3% vs local median 3.8% in Columbus — top-decile yield for the area; either an underpriced asset or a hidden risk that comps aren't pricing in. Stress-test before assuming the spread holds.
Location & tenants
- Location reads 81/100 on livability (#97 in OH, #1,491 nationally) — a professional / high-income tenant draw. Strengths: commute A+, cost of living A+, housing A+; Watch: employment C-, crime F.
- South-Western City (suburban): math 40% / reading 48% proficiency, ranked #500 of 656 in OH (top 76%) — families likely to look elsewhere, expect single-tenant / working-renter base with shorter leases.
- Market conditions: Rents soft (-0.6%/yr); 192 active listings in the ZIP; 40 comparable units currently listed for rent nearby; rentals leasing fast (median 13d on market — plan ~1-2 weeks tenant-placement turnaround); 8,139 units permitted in Franklin County in 2024 (5,940 in 5+ unit buildings).
- This rent runs 33% of the median local income ($62k/yr) — at the standard rent-burdened threshold; future hikes will face affordability resistance.
Forward outlook
- Local home prices are declining (-3.0%/yr); year-one equity from $1k of loan paydown is wiped out by about $5k of value loss. Plan a longer hold.
- Franklin County population projected at +34% by 2050 — long-run rental-demand tailwind backs the buy-and-hold thesis.
Negotiation context
- It's been on market 19 days — a 2% lower offer ($163k) is reasonable based on typical stale-listing flexibility.
Questions for the listing agent
- What do current leases actually rent for vs. the listed asking? Can we see a recent rent roll and the last 12 months of T-12 income?
- Built in 1972 — when were the roof, HVAC, electrical panel, plumbing, and water heater last replaced?
- What does the HOA fee cover, when was the last increase, and are there any pending special assessments or reserve-fund shortfalls?
- Any open or pending special assessments — roof, HVAC, plumbing, elevator, façade? What's the per-unit balance and payoff schedule, and is the seller paying it off at close or rolling it to the buyer?
- Is there a deadline driving the sale (1031 exchange, divorce, estate, relocation)? That informs how much negotiation room exists.
- Crime grade is F in this area — have there been break-ins, vandalism, or insurance claims at this property in the last 3 years? What carrier currently insures it and at what premium?
- The area grade is low — what's the realistic commute time and amenity access for the typical tenant pool here? Any planned neighborhood developments (good or bad) we should know about?
- What's the average days-on-market for RENTAL listings here right now (not sales)? A rising rental-DOM trend means longer vacancies and softer asking-rent achievability than the comps imply.
- What's the recent tenant-quality profile in this submarket — average credit score on applications, eviction rate, late-payment / NSF rate, and stable-employment percentage? A property-management company in the area should have these aggregated.
- How much new apartment / multifamily construction is in the pipeline within 1–3 miles? Heavy new supply (>2% of stock underway) typically softens rents 12–24 months out; light construction supports rent growth.
Investment metrics
- 1% rule
- 1.04% ✓
- Cap rate
- 6.27%
- Cash-on-cash
- -0.08%
- DSCR
- 1.00
- GRM
- 8.0
CMA / ARV
No comps found within radius.
Projected returns pro-forma
-3.0% appreciation · 0.0% rent growth · sell at horizon
- IRR
- -20.4%
- Equity multiple
- 0.31×
- Total profit
- $-31,787
- Equity at exit
- $24,602
- IRR
- -24.4%
- Equity multiple
- -0.01×
- Total profit
- $-46,672
- Equity at exit
- $14,266
Cash invested: $46,200 (down + closing). Projections, not guarantees.
Landlord ↔ Tenant lean methodology
- Overall (STATE)
- 73 Landlord-Friendly
- State Ohio
- 73 Landlord-Friendly · R+6
- County
- — inherits STATE
- City
- — inherits STATE
ZIP-level market 43228
- Rents YoY
- -0.6%
- Active inventory
- 192
- Price-to-rent
- 8.0×
Monthly cashflow live
- Estimated rent
- $1,712 high interval (Pro) →
- Mortgage (P&I)
- −$865
- Tax est. 1.5%
- −$206 /mo · $2,475/yr
- Insurance
- −$69
- HOA
- −$215
- Vacancy / Maint / Mgmt
- −$359
- Net cashflow
- $-3
Break-even live
UW: 25.0% down · 7.5% · 30yr · 1.5% tax · 5.0% vac · 8.0% maint · 8.0% mgmt
Financing live
Cash to close
- Down payment
- $41,250
- Closing costs
- $4,950
- Reserves months
- —
- Total cash needed
- —
Loan-product check · same deal, 3 products live
Conventional
25% down · 7.5% · 30yr
- Down + closing
- —
- Monthly P&I
- —
- Monthly cashflow
- —
- DSCR
- —
- Eligible?
- —
Personal DTI + credit; lowest rate.
DSCR
20% down · 8.5% · 30yr
- Down + closing
- —
- Monthly P&I
- —
- Monthly cashflow
- —
- DSCR
- —
- Eligible?
- —
No personal income docs; deal must DSCR.
Hard money
10% down · 12.0% · 12mo
- Down + closing
- —
- Monthly P&I
- —
- Monthly cashflow
- —
- DSCR
- —
- Eligible?
- —
Short-term bridge; refi at stabilization.
Rent comps 40 comps
| Address | Beds | Baths | Sqft | Rent | $/sqft | DOM | Units | Dist |
|---|---|---|---|---|---|---|---|---|
| 5580 Leigh Run Ct Columbus, OH | 2.0 | 1.0 | 950 | $1,244 | $1.31 | 2d | 3 | 0.08mi |
| 5500 Floral Cir S Columbus, OH | 1.0–3.0 | 1.0–2.0 | 762 | $1,420 | $1.86 | 3d | 22 | 0.27mi |
| 794 Wallinger Dr Galloway, OH | 3.0 | 2.5 | 1428 | $2,125 | $1.49 | 24d | 1 | 0.27mi |
| 931 Muirwood Village Dr Columbus, OH | 1.0–2.0 | 1.0 | 800 | $1,399 | $1.75 | 3d | 11 | 0.28mi |
| 5445 Eaglecrest Dr Galloway, OH | 1.0–2.0 | 1.0–2.0 | 800 | $1,290 | $1.61 | 15d | 7 | 0.35mi |
| 550 Brandenbush Ln Columbus, OH | 2.0 | 1.0 | 878 | $1,060 | $1.21 | 3d | 7 | 0.39mi |
| 560 Corral Gate Ct Galloway, OH | 3.0 | 2.0 | 1658 | $2,286 | $1.38 | 21d | 1 | 0.42mi |
| 5816 Oreily Dr Galloway, OH | 3.0 | 2.5 | 1248 | $2,300 | $1.84 | 12d | 1 | 0.44mi |
| 5335 Cherry Bud Ct Columbus, OH | 3.0 | 2.0 | 1456 | $2,298 | $1.58 | 44d | 1 | 0.49mi |
| 2791 Chopper Ln Columbus, OH | 1.0–2.0 | 1.0–2.5 | 1004 | $2,884 | $2.87 | 2d | 25 | 0.55mi |
| 500 Dove Tree Dr Galloway, OH | 1.0–2.0 | 1.0–1.5 | 804 | $1,419 | $1.76 | 2d | 1 | 0.63mi |
| 1284 Falene Pl Galloway, OH | 3.0 | 2.0 | 1510 | $2,355 | $1.56 | 2d | 1 | 0.67mi |
| 1097 Leclerc Pl Galloway, OH | 3.0 | 2.0 | 1850 | $2,520 | $1.36 | 4d | 1 | 0.67mi |
| 815 Galloway Rd Galloway, OH | 1.0–3.0 | 1.0–2.0 | 953 | $1,950 | $2.05 | 2d | 1 | 0.77mi |
| 5809-5811 Pepperwood Ct Unit 5809 Galloway, OH | 2.0 | 1.0 | 910 | $1,349 | $1.48 | 20d | 1 | 0.78mi |
| 6203 Streaming Ave Galloway, OH | 3.0 | 2.0 | 1159 | $1,745 | $1.51 | 12d | 1 | 0.80mi |
| 5095 Maple Valley Dr Columbus, OH | 3.0 | 2.5 | 1709 | $2,300 | $1.35 | 21d | 1 | 0.81mi |
| 859 Eliots Oak Rd Columbus, OH | 3.0 | 1.0 | 1232 | $1,950 | $1.58 | 15d | 1 | 0.82mi |
| 5591 Rustling Way LN Galloway, OH | 1.0–3.0 | 1.0–2.5 | 962 | $1,649 | $1.71 | 2d | 8 | 0.88mi |
| 950 Brushfield Dr Galloway, OH | 1.0–2.0 | 1.0–2.0 | 819 | $1,231 | $1.50 | 2d | 10 | 0.88mi |
| 6160 Hall Rd Galloway, OH | 1.0–3.0 | 1.0–2.0 | 953 | $1,950 | $2.05 | 2d | 1 | 0.92mi |
| 349 Cloverhill Dr Galloway, OH | 3.0 | 2.0 | 1472 | $2,510 | $1.71 | 2d | 1 | 0.98mi |
| 6245 Jolliff St Galloway, OH | 3.0 | 2.5 | 1806 | $2,455 | $1.36 | 16d | 1 | 0.99mi |
| 4800 Hall Rd Columbus, OH | 1.0–3.0 | 1.0–2.0 | 880 | $1,289 | $1.46 | 2d | 24 | 1.05mi |
| 5605 W Broad St Columbus, OH | 1.0–2.0 | 1.0–2.0 | 823 | $1,465 | $1.78 | 2d | 30 | 1.06mi |
| 5761 Ricardo Dr Galloway, OH | 3.0 | 2.0 | 1102 | $2,010 | $1.82 | 44d | 1 | 1.15mi |
| 6370 Bellinger Dr Galloway, OH | 3.0 | 2.5 | 1676 | $2,400 | $1.43 | 44d | 1 | 1.22mi |
| 1595 Georgesville Rd Columbus, OH | 1.0–3.0 | 1.0–2.0 | 953 | $1,900 | $1.99 | 2d | 1 | 1.27mi |
| 5930 W Broad St Galloway, OH | 1.0–2.0 | 1.0–2.0 | 819 | $1,290 | $1.58 | 2d | 24 | 1.31mi |
| 6145 W Broad St Galloway, OH | 1.0–3.0 | 1.0–2.0 | 1131 | $1,525 | $1.35 | 2d | 13 | 1.38mi |
| 4551 Durrow Dr Columbus, OH | 1.0–2.0 | 1.0–2.5 | 970 | $1,645 | $1.70 | 3d | 22 | 1.42mi |
| 4573 Westport Rd Unit 4507-303 Columbus, OH | 4.0 | 2.0 | 1558 | $1,897 | $1.22 | 44d | 1 | 1.42mi |
| 4573 Westport Rd Unit 670-205 Columbus, OH | 2.0 | 1.5 | 919 | $1,471 | $1.60 | 12d | 1 | 1.42mi |
| 4573 Westport Rd Unit 670-106 Columbus, OH | 3.0 | 1.5 | 1095 | $1,417 | $1.29 | 44d | 1 | 1.42mi |
| 4573 Westport Rd Unit 670-201 Columbus, OH | 2.0 | 1.5 | 919 | $1,226 | $1.33 | 44d | 1 | 1.42mi |
| 4573 Westport Rd Unit 4567-101 Columbus, OH | 3.0 | 1.5 | 1095 | $1,701 | $1.55 | 44d | 1 | 1.42mi |
| 4573 Westport Rd Unit 4507-107 Columbus, OH | 3.0 | 1.5 | 1095 | $1,417 | $1.29 | 12d | 1 | 1.42mi |
| 4573 Westport Rd Unit 690-205 Columbus, OH | 2.0 | 1.5 | 919 | $1,471 | $1.60 | 44d | 1 | 1.42mi |
| 4510 Switchback Trl Columbus, OH | 3.0 | 2.0 | 1244 | $2,170 | $1.74 | 4d | 1 | 1.44mi |
| 4651 Hilton Ave Unit B Columbus, OH | 2.0 | 1.0 | 900 | $945 | $1.05 | 44d | 1 | 1.46mi |
HOA detail condo
- Monthly dues
- $215 · $2,580/yr
- Assessments
- None detected in remarks — confirm with the listing agent.
Listing history 7 events
-
2026-06-13statusdays on market $165,000 Pending 19 DOM
-
2026-06-07days on market $165,000 Active 18 DOM
-
2026-06-03days on market $165,000 Active 14 DOM
-
2026-06-02days on market $165,000 Active 13 DOM
-
2026-06-01days on market $165,000 Active 12 DOM
-
2026-05-31days on market $165,000 Active 11 DOM
-
2026-05-20$165,000 Active
ⓘ Source: listings_history table (triggers on properties + properties_extension) + one-shot
backfill from property_details.listing_events for pre-trigger history.
Climate risk First Street
- Flood 1/10 Low FEMA zone X (unshaded) · 0% chance over 30 yrs
- Wildfire 1/10 Low
- Heat 4/10 Moderate 7 d/yr ≥100°F today · 18 d/yr by 30 yrs out
- Wind 2/10 Low 100% chance of damaging wind over 30 yrs
- Air quality 2/10 Low 1 unhealthy d/yr today · 2 by 30 yrs out
Nearby sold comps map
Loading sold comps map…
Walkable amenities ~0.75 mi
Loading nearby amenities…
Taxation est. · year 1
- Rental income
- $20,541
- − Mortgage interest
- −$9,243
- − Property taxes
- −$2,475
- − Insurance
- −$825
- − Repairs & maintenance
- −$1,643
- − Management
- −$1,643
- − HOA
- −$2,580
- − Depreciation
- −$4,800
- Taxable loss
- −$2,668
- Est. tax savings @ 24.0%
- +$640
- After-tax cash flow
- $604/yr
For passive investors: Depreciation is non-cash, so a rental often shows a tax loss while cash-flowing — sheltering income. Rental losses are passive: they offset passive income freely, and up to $25,000/yr can offset ordinary (W-2) income if you actively participate and your MAGI is under $100k (phasing out to $0 by $150k); unused losses carry forward. On sale, claimed depreciation is recaptured at up to 25%, and gains may owe capital-gains tax (a 1031 exchange can defer both). Figures are a year-1 estimate at your 24.0% rate — not tax advice; consult a CPA.
Condition & rehab AI · 20 photos
This townhouse is in good condition with a fresh paint job and well-maintained landscaping. It's a good candidate for a cosmetic renovation to further enhance its value.
Value-add opportunities
- Resale painting — Fresh paint can make a significant difference in curb appeal and overall look
- Both landscaping — Well-maintained landscaping can enhance curb appeal and increase property value
- Resale minor repairs — Small repairs can make a big difference in the home's overall condition and appeal
Renovation cost estimate screening
Value-add ROI direction
- Resale painting — Fresh paint can make a significant difference in curb appeal and overall look ↑
- Both landscaping — Well-maintained landscaping can enhance curb appeal and increase property value ↑
- Resale minor repairs — Small repairs can make a big difference in the home's overall condition and appeal ↑
ⓘ Cost ranges are severity-bucket heuristics (US national rule-of-thumb). Get contractor quotes + a written scope before underwriting a rehab budget.
Schools (NCES district)
- District
- South-Western City
- NCES district ID
- 3904480
- Math proficiency
- 40% ▼ -18.00%
- Reading proficiency
- 48% ▼ -10.00%
- Median HH income
- $51,689
- Composite
- 37.95/100
- National rank
- #4305
- State rank
- #500 of 656 in OH
Livability — Columbus
- Score
- 81/100
- State rank
- #97
- US rank
- #1491
Category grades
Schools grade is shown separately in the Schools card above.
Census & demographics
- Census place
- Columbus, OH
- County
- Franklin County · 1,351,780 people
- City population
- 612,189
- Metro
- Columbus, OH
- Population (ZIP)
- 59,077
- Household income
- $61,713
- Rent vs Own
- Severe rent burden
- 3284.0
Population outlook (Franklin County) Hauer SSP2
- Today (2025)
- 1,456,139 people
- By 2030
- 1,556,890 · +6.9%
- By 2040
- 1,757,349 · +20.7%
- By 2050
- 1,950,539 · +34.0%
- By 2075
- 2,376,171 · +63.2%
- By 2100
- 2,636,796 · +81.1%
Race, ethnicity, and origin ACS 2023
- Neighborhood character
- Diverse neighborhood (Simpson 0.64)
- Race & ethnicity
- White 54% Black 23% Hispanic / Latino 14% Two or more races 11% Asian 3%
- Hispanic origin (detail)
- Mexican 8% Dominican 1%
- Common ancestry
- Slovak 2% Italian 1% Romanian 1%
- Foreign-born
- 19% · Canada, Jamaica
- Languages at home
- 74% English-only · Spanish 12% Other Indo-European 1% Other Asian/Pacific 1%
Political lean MEDSL · Franklin
- 2024 margin
- Strong D (+28.4) · D 63.7% · R 35.3% · Other 1.0%
- 2008→2024 swing
- +7.7pp toward D · 2008: 20.7pp · 2024: 28.4pp
- All cycles
- 2024: D+28.4 2020: D+31.4 2016: D+25.9 2012: D+21.7 2008: D+20.7
Not yet ingested
- Civics
- —
Market trends
- HPI YoY
- ▼ -245.97%
- Current HPI
- 234.1992
- Rent YoY
- ▼ -0.63%
- Metro
- Columbus, OH
- State GDP YoY
- ▲ 1.98%
- F500 in state
- 48
Industry mix (Fortune 500 HQ in OH)
| Industry | F500 HQs | Revenue |
|---|---|---|
| Insurance | 3 | $145B |
|
||
| Industrial Machinery | 3 | $49B |
|
||
| Financial Services | 3 | $24B |
|
||
| Consumer Goods | 2 | $93B |
|
||
| Aerospace / Defense | 2 | $47B |
|
||
| Utilities | 2 | $33B |
|
||
Price history
1 event — show timeline
- 2026-05-20 Listed $165,000 CBRMLS
Cash-flow waterfall
monthlySold comps — $/sqft
last 12 mo · ≤1 miLoading sold comps…