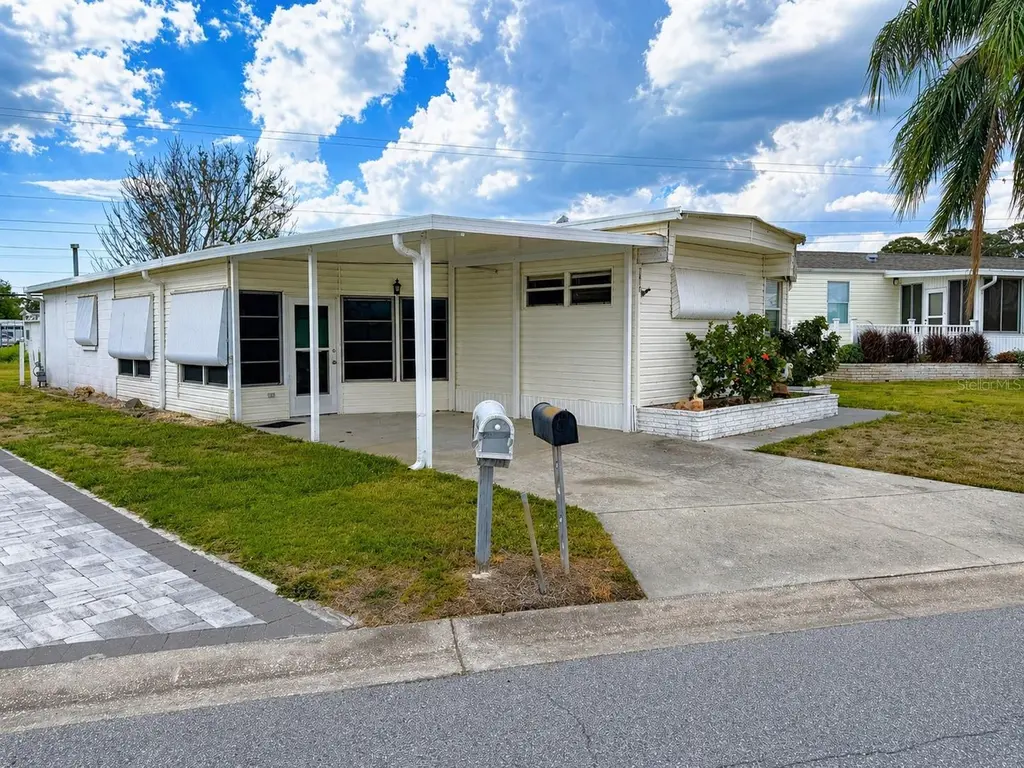
1647 Midlothian St · Sarasota, FL
Flood risk 6/10 · Moderate
- FEMA flood zone
- AE
- Chance of flooding over 30 yrs
- 0.74%
- Est. flood insurance / yr
- $1,737 – $8,500
Fire risk 1/10 · Minimal
- Est. fire insurance / yr
- $947 – $1,759
Heat risk 10/10 · Severe
- Hot days now (above 106°F)
- 7 days/yr
- Hot days in 30 yrs
- 29 days/yr
Wind risk 10/10 · Severe
- Chance of severe wind over 30 yrs
- 99.0%
Air-quality risk 2/10 · Minimal
- Unhealthy air days now
- 1 days/yr
- Unhealthy air days in 30 yrs
- 1 days/yr
Risk factors via First Street. Map © Google.
Why this score? — see what drove the B grade
The composite is a weighted blend of 9 inputs, each scored 0–100. Each bar is that input's sub-score; the figure is the points it added to the 100-point composite (weight × sub-score).
- Cash flow +30.0/30.0
- 1% rule +10.0/10.0
- DSCR +10.0/10.0
- ARV discount +7.5/15.0
- Schools +5.4/10.0
- Livability +4.0/5.0
- Condition / age +2.5/5.0
- Rent growth +1.7/5.0
- Appreciation +0.0/10.0
$60,000
🖨 Deal sheet 📄 Offer letter ✓ Due diligence
Listing remarks
Welcome to 1647 Midlothian St in Sarasota, FL, a charming 2-bedroom, 1.5-bath home offering affordable Florida living in a convenient location. This property features a covered carport, screened entry area, and a practical layout with comfortable living space throughout. The exterior offers low-maintenance appeal, a widened driveway area, and room to enjoy Sarasota's year-round sunshine. Located in the desirable Tri-Par Estates area, this home is close to shopping, dining, beaches, downtown Sarasota, SRQ Airport, and major roadways. Whether you are looking for a seasonal retreat, full-time residence, or investment opportunity, this property offers excellent potential.
Key facts
- 3,444 sq ft lot
- Parking
- Built 1967
Property features AI
Finance
- Other: Property type: Residential; Property sub-type: Mobile Home; Zoning: RMH; Lot size approximately 0.08 acres; Living area approximately 660 sq ft (public records); Building area listed as 1,550 sq ft (public records)
- HOA & community: Senior community
Exterior
- Parking: Carport (1 space)
- Utilities: Public water; Public sewer; Private utilities
- Home design: Residential mobile home (single wide); One story; Faces northwest
- Construction: Vinyl siding; Metal roof; Block and pillar/post/pier foundation; Built on a single level
- Exterior features: Other exterior features
Interior
- Kitchen: Dishwasher; Microwave; Refrigerator
- Bedrooms: 2 bedrooms
- Flooring: Carpet; Linoleum; Wood
- Bathrooms: 1 full bath; 1 half bath
- Heating & cooling: Central heating (electric); Central air conditioning
- Interior features: Ceiling fans
- Laundry & utility: Laundry room
Neighborhood map
What this means for you Summary
Snapshot
- This is a 2-bed/2.0-bath manufactured listed at $60k.
Deal economics
- At list price, monthly cash flow is $515 ($6k/yr) — positive.
- The deal already cash-flows at list — no discount required.
- Meets the 1% rule at list price ($2k rent vs $60k).
- Recommended offer: $59k (1.5% below list) — sets the bar for market timing.
Location & tenants
- Location reads 80/100 on livability (#121 in FL, #1,854 nationally) — a professional / high-income tenant draw. Strengths: amenities A+, health & safety A+, commute A; Watch: crime F.
- Sarasota (urban): math 63% / reading 63% proficiency, ranked #7 of 73 in FL (top 10%) — acceptable for families but not a draw, mixed tenant base, ~2y average lease.
- Market conditions: Rents falling (-3.1%/yr); 268 active listings in the ZIP; 1 comparable units currently listed for rent nearby; 7,466 units permitted in Sarasota County in 2024 (2,138 in 5+ unit buildings).
- This rent runs 40% of the median local income ($57k/yr) — at the standard rent-burdened threshold; future hikes will face affordability resistance.
Forward outlook
- Local home prices are declining (-3.0%/yr); year-one equity from $415 of loan paydown is wiped out by about $2k of value loss. Plan a longer hold.
- Sarasota County population projected at +20% by 2050 — long-run rental-demand tailwind backs the buy-and-hold thesis.
- At projected returns (-3.0% appreciation + 0.0% rent growth), your $17k cash investment doubles in ~4 years — after that, you're playing with house money.
Negotiation context
- It's been on market 29 days — a 2% lower offer ($59k) is reasonable based on typical stale-listing flexibility.
Risks & watch-outs
- Watch-outs: property tax is 4.6% of price; flood insurance adds $427/mo.
- Climate carrying-cost: in FEMA flood zone AE (mandatory federal flood insurance); severe wind risk, 99% chance of damaging wind over 30y; extreme-heat days projected 7→29/yr by 2055 (HVAC capex compounding) — expect insurance premiums to compound above CPI over the hold.
Questions for the listing agent
- Built in 1967 — when were the roof, HVAC, electrical panel, plumbing, and water heater last replaced?
- Property tax is high relative to price — has the assessment been appealed recently, and will the sale trigger a re-assessment?
- What's the actual annual flood-insurance premium (NFIP or private), and is the property in a SFHA with mandatory coverage?
- Is there a deadline driving the sale (1031 exchange, divorce, estate, relocation)? That informs how much negotiation room exists.
- Schools are B-rated — typically a magnet for longer-tenancy family renters. What's the average tenant stay here, and is there a school-zone premium baked into asking?
- Crime grade is F in this area — have there been break-ins, vandalism, or insurance claims at this property in the last 3 years? What carrier currently insures it and at what premium?
- What's the average days-on-market for RENTAL listings here right now (not sales)? A rising rental-DOM trend means longer vacancies and softer asking-rent achievability than the comps imply.
- What's the recent tenant-quality profile in this submarket — average credit score on applications, eviction rate, late-payment / NSF rate, and stable-employment percentage? A property-management company in the area should have these aggregated.
- How much new for-sale + rental construction is in the pipeline within 1–3 miles? Heavy new supply typically softens prices + rents 12–24 months out; constrained supply supports both.
Investment metrics
- 1% rule
- 3.18% ✓
- Cap rate
- 25.11%
- Cash-on-cash
- 67.22%
- DSCR
- 3.99
- GRM
- 2.6
CMA / ARV
No comps found within radius.
Projected returns pro-forma
-3.0% appreciation · 0.0% rent growth · sell at horizon
- IRR
- 27.3%
- Equity multiple
- 2.06×
- Total profit
- $17,835
- Equity at exit
- $8,946
- IRR
- 31.8%
- Equity multiple
- 3.24×
- Total profit
- $37,657
- Equity at exit
- $5,188
Cash invested: $16,800 (down + closing). Projections, not guarantees.
Landlord ↔ Tenant lean methodology
- Overall (STATE)
- 87 Strongly Landlord-Friendly
- State Florida
- 87 Strongly Landlord-Friendly · R+3
- County
- — inherits STATE
- City
- — inherits STATE
ZIP-level market 34234
- Rents YoY
- -3.1%
- Active inventory
- 268
- Price-to-rent
- 2.6×
Monthly cashflow live
- Estimated rent
- $1,910 medium interval (Pro) →
- Mortgage (P&I)
- −$315
- Tax from tax record
- −$229 /mo · $2,742/yr
- Insurance
- −$25
- Flood insurance flood zone
- −$427 /mo · $5,118/yr
- HOA
- −$0
- Vacancy / Maint / Mgmt
- −$401
- Net cashflow
- $515
Break-even live
UW: 25.0% down · 7.5% · 30yr · 1.5% tax · 5.0% vac · 8.0% maint · 8.0% mgmt
Financing live
Cash to close
- Down payment
- $15,000
- Closing costs
- $1,800
- Reserves months
- —
- Total cash needed
- —
Loan-product check · same deal, 3 products live
Conventional
25% down · 7.5% · 30yr
- Down + closing
- —
- Monthly P&I
- —
- Monthly cashflow
- —
- DSCR
- —
- Eligible?
- —
Personal DTI + credit; lowest rate.
DSCR
20% down · 8.5% · 30yr
- Down + closing
- —
- Monthly P&I
- —
- Monthly cashflow
- —
- DSCR
- —
- Eligible?
- —
No personal income docs; deal must DSCR.
Hard money
10% down · 12.0% · 12mo
- Down + closing
- —
- Monthly P&I
- —
- Monthly cashflow
- —
- DSCR
- —
- Eligible?
- —
Short-term bridge; refi at stabilization.
Rent comps 1 comps
| Address | Beds | Baths | Sqft | Rent | $/sqft | DOM | Units | Dist |
|---|---|---|---|---|---|---|---|---|
| 2351 University Pkwy Sarasota, FL | 1.0–3.0 | 1.0–2.0 | 1046 | $2,480 | $2.37 | 2d | 24 | 1.31mi |
Listing history 2 events
-
2026-05-07price $60,000 676-char remark
-
2026-04-28$70,000 Active 676-char remark
ⓘ Source: listings_history table (triggers on properties + properties_extension) + one-shot
backfill from property_details.listing_events for pre-trigger history.
Tax reassessment forecast FL · Resets to sale price
- Current annual tax
- $2,742 · $229/mo
- Projected year-2 tax
- $2,742 · $229/mo
- Expected delta
- $0/yr ($0/mo · 0.0%)
ⓘ Screening estimate from a state-policy table — verify with the county assessor before closing.
Climate risk First Street
- Flood 6/10 Major FEMA zone AE · 74% chance over 30 yrs
- Wildfire 1/10 Low
- Heat 10/10 Extreme 7 d/yr ≥106°F today · 29 d/yr by 30 yrs out
- Wind 10/10 Extreme 99% chance of damaging wind over 30 yrs
- Air quality 2/10 Low 1 unhealthy d/yr today · 1 by 30 yrs out
Nearby sold comps map
Loading sold comps map…
Walkable amenities ~0.75 mi
Loading nearby amenities…
Taxation est. · year 1
- Rental income
- $22,925
- − Mortgage interest
- −$3,361
- − Property taxes
- −$2,742
- − Insurance
- −$5,418
- − Repairs & maintenance
- −$1,834
- − Management
- −$1,834
- − Depreciation
- −$1,745
- Taxable income
- $5,990
- Est. tax owed @ 24.0%
- −$1,438
- After-tax cash flow
- $4,737/yr
For passive investors: Depreciation is non-cash, so a rental often shows a tax loss while cash-flowing — sheltering income. Rental losses are passive: they offset passive income freely, and up to $25,000/yr can offset ordinary (W-2) income if you actively participate and your MAGI is under $100k (phasing out to $0 by $150k); unused losses carry forward. On sale, claimed depreciation is recaptured at up to 25%, and gains may owe capital-gains tax (a 1031 exchange can defer both). Figures are a year-1 estimate at your 24.0% rate — not tax advice; consult a CPA.
Schools (NCES district)
- District
- Sarasota
- NCES district ID
- 1201680
- Math proficiency
- 63% ▼ -8.00%
- Reading proficiency
- 63% ▼ -3.00%
- Median HH income
- $51,167
- Composite
- 53.68/100
- National rank
- #1428
- State rank
- #7 of 73 in FL
Livability — Sarasota
- Score
- 80/100
- State rank
- #121
- US rank
- #1854
Category grades
Schools grade is shown separately in the Schools card above.
Census & demographics
- County
- Sarasota County · 448,376 people
- City population
- 261,896
- Metro
- North Port-Sarasota-Bradenton, FL
- Population (ZIP)
- 22,986
- Household income
- $57,288
- Rent vs Own
- Severe rent burden
- 1306.0
Population outlook (Sarasota County) Hauer SSP2
- Today (2025)
- 452,380 people
- By 2030
- 474,175 · +4.8%
- By 2040
- 511,577 · +13.1%
- By 2050
- 541,467 · +19.7%
- By 2075
- 604,947 · +33.7%
- By 2100
- 621,965 · +37.5%
Race, ethnicity, and origin ACS 2023
- Neighborhood character
- Diverse neighborhood (Simpson 0.68)
- Race & ethnicity
- White 44% Black 31% Hispanic / Latino 20% Two or more races 14% Asian 1%
- Hispanic origin (detail)
- Mexican 8% Puerto Rican 1% Cuban 6% Dominican 1%
- Common ancestry
- Lithuanian 4% Hispanic 2% Romanian 1%
- Foreign-born
- 17% · Canada, Jamaica, China
- Languages at home
- 81% English-only · Spanish 17% French/Haitian/Cajun 1%
Political lean MEDSL · Sarasota
- 2024 margin
- R (+18.2) · D 40.5% · R 58.7%
- 2008→2024 swing
- -18.1pp toward R · 2008: -0.1pp · 2024: -18.2pp
- All cycles
- 2024: R+18.2 2020: R+10.4 2016: R+11.6 2012: R+7.4 2008: R+0.1
Not yet ingested
- Civics
- —
Market trends
- HPI YoY
- ▼ -229.06%
- Current HPI
- 305.6629
- Rent YoY
- ▼ -3.15%
- Metro
- North Port-Sarasota-Bradenton, FL
- State GDP YoY
- ▲ 3.28%
- F500 in state
- 36
Industry mix (Fortune 500 HQ in FL)
| Industry | F500 HQs | Revenue |
|---|---|---|
| Industrial Technology | 2 | $29B |
|
||
| Insurance | 2 | $17B |
|
||
| Retail | 1 | $60B |
|
||
| Technology Distribution | 1 | $58B |
|
||
| Homebuilding | 1 | $35B |
|
||
| Technology Manufacturing | 1 | $35B |
|
||
Price history
-14.3% since first listed3 events — show timeline
- 2026-05-27 Listing Removed — Stellar MLS as Distributed by MLS Grid
- 2026-05-07 Price Changed $60,000 Stellar MLS as Distributed by MLS Grid
- 2026-04-28 Listed $70,000 Stellar MLS as Distributed by MLS Grid
Property tax history
+6.2%/yrLatest (2025): $2,742 · -2.2% YoY. Source: county tax records.
Cash-flow waterfall
monthlySold comps — $/sqft
last 12 mo · ≤1 miLoading sold comps…