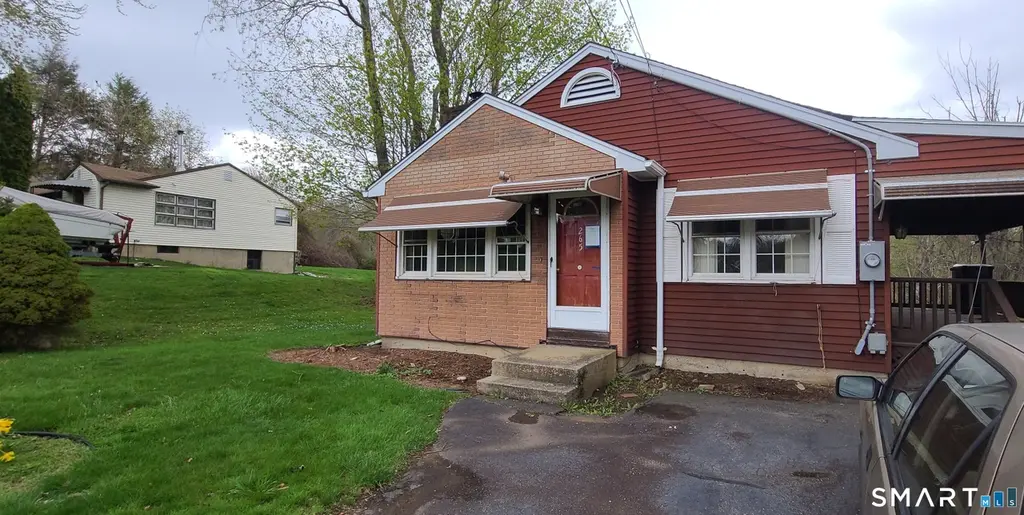
265 South St · Thomaston, CT
Flood risk 1/10 · Minimal
- FEMA flood zone
- X
- Chance of flooding over 30 yrs
- 0.0%
- Est. flood insurance / yr
- $473 – $860
Fire risk 4/10 · Minor
- Est. fire insurance / yr
- $829 – $1,539
Heat risk 4/10 · Minor
- Hot days now (above 95°F)
- 7 days/yr
- Hot days in 30 yrs
- 15 days/yr
Wind risk 6/10 · Moderate
- Chance of severe wind over 30 yrs
- 27.0%
Air-quality risk 2/10 · Minimal
- Unhealthy air days now
- 1 days/yr
- Unhealthy air days in 30 yrs
- 1 days/yr
Risk factors via First Street. Map © Google.
Why this score? — see what drove the D grade
The composite is a weighted blend of 9 inputs, each scored 0–100. Each bar is that input's sub-score; the figure is the points it added to the 100-point composite (weight × sub-score).
- ARV discount +15.0/15.0
- Cash flow +8.2/30.0
- Schools +4.5/10.0
- Livability +3.2/5.0
- 1% rule +3.0/10.0
- Rent growth +2.5/5.0
- Condition / age +2.5/5.0
- DSCR +2.2/10.0
- Appreciation +0.0/10.0
$239,900
🖨 Deal sheet (PDF) 📄 Offer letter ✓ Due diligence
Listing remarks
A rare offering in this area, you can own a piece of the lakeside lifestyle! This charming one-level ranch is the ultimate "diamond in the rough" for a first-time buyer ready to build sweat equity. The bones are all there: a cozy fireplace for chilly nights, an open kitchen perfect for hosting your first housewarming, and a covered deck for all-weather entertaining. The real "bonus feature" is the massive walkout basement-with its high ceilings, it's a blank canvas just waiting to become your future game room, home office, or guest suite. Best of all? You're just a short walk away from the lake! Plus, its location on a main route means you'll have some of the best-mainta
Key facts
- Covered deck
- Cozy fireplace
- High ceilings
Tags
Property features AI
Exterior
- Parking: Paved driveway and off-street parking; Approximately 4 parking spaces
- Utilities: Private well water; Public sewer connection; Oil tank located in basement; Electric service (standard)
- Home design: Single-family home
- Construction: Concrete foundation; Frame and brick construction; Clapboard and brick siding; Asphalt shingle roof; Red exterior color
- Exterior features: Awnings; Covered deck; Level to rolling lot; Walkable to water and in a water community; Private paved asphalt driveway
Interior
- Bedrooms: 3 bedrooms
- Bathrooms: 1 full bathroom
- Heating & cooling: Hot air heating; Oil-fired heat; 30-gallon oil hot water tank
- Interior features: One fireplace; Full walk-out basement; Full basement; Attic with hatch access; Total of 5 rooms; Central air conditioning
- Laundry & utility: Laundry in basement (lower level)
Neighborhood map
What this means for you Summary
Snapshot
- This is a 3-bed/1.0-bath single-family listed at $240k.
Deal economics
- At list price, monthly cash flow is $-222 ($-3k/yr) — negative.
- To cash-flow at today's rent, offer at most $201k (16.4% below list).
- To meet the 1% rule (rent ≥ 1% of price), the offer needs to be $193k (19.7% below list).
- Recommended offer: $193k (19.7% below list) — sets the bar for 1% rule.
- Cap rate 5.2% vs local median 4.3% in Thomaston — meaningfully above typical; check what's discounted (condition, days-on-market, listing class) to confirm the premium yield is real.
Location & tenants
- Location reads 64/100 on livability (#127 in CT) — a middle-class / working-renter tenant base. Strengths: crime A+, housing A-, cost of living B+; Watch: amenities F, commute F, employment D-.
- Plymouth School District (suburban): math 42% / reading 58% proficiency, ranked #78 of 153 in CT (top 51%) — acceptable for families but not a draw, mixed tenant base, ~2y average lease.
- Zoned schools: Plymouth Center School (math 47% / reading 67%, grade C+, #177 of 553 statewide, top 34%, 342 students, 48% FRL); Eli Terry Jr. Middle School (math 44% / reading 63%, grade C+, #70 of 175 statewide, top 40%, 279 students, 48% FRL); Terryville High School (math 44% / reading 64%, grade C-, #63 of 194 statewide, top 39%, 367 students, 43% FRL) — zoned schools average 46% FRL vs 22% district-wide (24 pts higher); higher-poverty schools than district average — tighter screening recommended.
- Market conditions: 18 active listings in the ZIP; 2 comparable units currently listed for rent nearby; 502 units permitted in Naugatuck Valley Planning Region in 2024 (171 in 5+ unit buildings).
Forward outlook
- Local home prices are declining (-3.0%/yr); year-one equity from $2k of loan paydown is wiped out by about $7k of value loss. Plan a longer hold.
Negotiation context
- It's been on market 42 days — a 3% lower offer ($233k) is reasonable based on typical stale-listing flexibility.
Risks & watch-outs
- Climate carrying-cost: major wind risk, 27% chance of damaging wind over 30y — expect insurance premiums to compound above CPI over the hold.
Questions for the listing agent
- What do current leases actually rent for vs. the listed asking? Can we see a recent rent roll and the last 12 months of T-12 income?
- It's been on market 42 days. Have you received any prior offers? Is the seller open to a 20% concession, seller financing, or rate buy-down credit?
- Built in 1966 — when were the roof, HVAC, electrical panel, plumbing, and water heater last replaced?
- Is there a deadline driving the sale (1031 exchange, divorce, estate, relocation)? That informs how much negotiation room exists.
- The area grade is low — what's the realistic commute time and amenity access for the typical tenant pool here? Any planned neighborhood developments (good or bad) we should know about?
- What's the average days-on-market for RENTAL listings here right now (not sales)? A rising rental-DOM trend means longer vacancies and softer asking-rent achievability than the comps imply.
- What's the recent tenant-quality profile in this submarket — average credit score on applications, eviction rate, late-payment / NSF rate, and stable-employment percentage? A property-management company in the area should have these aggregated.
- How much new for-sale + rental construction is in the pipeline within 1–3 miles? Heavy new supply typically softens prices + rents 12–24 months out; constrained supply supports both.
Investment metrics
- 1% rule
- 0.80% ✗
- Cap rate
- 5.18%
- Cash-on-cash
- -3.97%
- DSCR
- 0.82
- GRM
- 10.4
CMA / ARV
- ARV (median comp)
- $341,438
- List price
- $239,900
- Delta
- -29.74%
- Verdict
- UNDERPRICED
- Comps
- 20 within 1.0 mi
Show comp detail 5 sales within ~0.75 mi
| Address | Dist | Beds/Ba | Sqft | Sold | Price | $/sf | Match |
|---|---|---|---|---|---|---|---|
| 105 Lake Plymouth Blvd | 0.27mi | 2/1.0 (-1) | 1,024 (-4%) | 1mo | $330,000 | $322 | 74 |
| 349 Lake Plymouth Blvd | 0.38mi | 2/1.0 (-1) | 950 (-11%) | 4mo | $75,000 | $79 | 54 |
| 265 Lake Plymouth Blvd | 0.50mi | 3/1.0 | 1,232 (+15%) | 3mo | $300,000 | $244 | 49 |
| 271 Lake Plymouth Blvd | 0.49mi | 2/1.0 (-1) | 1,120 (+4%) | 21mo | $275,000 | $246 | 47 |
| 47 Hosier Rd | 0.50mi | 3/1.0 | 954 (-11%) | 16mo | $220,000 | $231 | 45 |
Match score weights: distance 35% · size 25% · config 20% · recency 20%. Top-matched comps best support the ARV.
Projected returns pro-forma
-3.0% appreciation · 3.0% rent growth · sell at horizon
- IRR
- -22.9%
- Equity multiple
- 0.21×
- Total profit
- $-52,959
- Equity at exit
- $35,770
- IRR
- -17.3%
- Equity multiple
- 0.05×
- Total profit
- $-64,026
- Equity at exit
- $20,742
Cash invested: $67,172 (down + closing). Projections, not guarantees.
Landlord ↔ Tenant lean methodology
- Overall (STATE)
- 27 Tenant-Leaning
- State Connecticut
- 27 Tenant-Leaning · D+7
- County
- — inherits STATE
- City
- — inherits STATE
ZIP-level market 06782
- Home prices YoY
- -10.9%
- Active inventory
- 18
- Price-to-rent
- 10.4×
Monthly cashflow live
- Estimated rent
- $1,926 medium interval (Pro) →
- Mortgage (P&I)
- −$1,258
- Tax from tax record
- −$386 /mo · $4,629/yr
- Insurance
- −$100
- HOA
- −$0
- Vacancy / Maint / Mgmt
- −$404
- Net cashflow
- $-222
Break-even live
Sensitivity live
| Price | -10% $-87 | -5% $-155 | +0% $-222 | +5% $-290 | +10% $-358 |
|---|---|---|---|---|---|
| Rent | -10% $-375 | -5% $-299 | +0% $-222 | +5% $-146 | +10% $-70 |
| Rate | -1.0pp $-102 | -0.5pp $-161 | base $-222 | +0.5pp $-285 | +1.0pp $-348 |
UW: 25.0% down · 7.5% · 30yr · 1.5% tax · 5.0% vac · 8.0% maint · 8.0% mgmt
Financing live
Cash to close
- Down payment
- $59,975
- Closing costs
- $7,197
- Reserves months
- —
- Total cash needed
- —
Loan-product check · same deal, 3 products live
Conventional
25% down · 7.5% · 30yr
- Down + closing
- —
- Monthly P&I
- —
- Monthly cashflow
- —
- DSCR
- —
- Eligible?
- —
Personal DTI + credit; lowest rate.
DSCR
20% down · 8.5% · 30yr
- Down + closing
- —
- Monthly P&I
- —
- Monthly cashflow
- —
- DSCR
- —
- Eligible?
- —
No personal income docs; deal must DSCR.
Hard money
10% down · 12.0% · 12mo
- Down + closing
- —
- Monthly P&I
- —
- Monthly cashflow
- —
- DSCR
- —
- Eligible?
- —
Short-term bridge; refi at stabilization.
Rent comps 2 comps
| Address | Beds | Baths | Sqft | Rent | $/sqft | DOM | Units | Dist |
|---|---|---|---|---|---|---|---|---|
| 8 Maple Ave Plymouth, CT | 2.0 | 1.0 | 834 | $1,500 | $1.80 | 45d | 1 | 1.04mi |
| 720 Main St Unit 1ST Plymouth, CT | 4.0 | 1.0 | 1120 | $2,300 | $2.05 | 4d | 1 | 1.12mi |
Listing history 5 events
-
2026-06-02status $239,900 Under Contract 42 DOM
-
2026-06-01days on market $239,900 Under Contract - Continue to Show 42 DOM
-
2026-05-31days on market $239,900 Under Contract - Continue to Show 41 DOM
-
2026-05-06historical Under Contract - Continue to Show 891-char remark
-
2026-04-20$239,900 Active 891-char remark
ⓘ Source: listings_history table (triggers on properties + properties_extension) + one-shot
backfill from property_details.listing_events for pre-trigger history.
Tax reassessment forecast CT · Partial reset (capped growth)
- Current annual tax
- $4,629 · $386/mo
- Projected year-2 tax
- $4,881 · $407/mo
- Expected delta
- +$252/yr (+$21/mo · 5.5%)
ⓘ Screening estimate from a state-policy table — verify with the county assessor before closing.
Climate risk First Street
- Flood 1/10 Low FEMA zone X · 0% chance over 30 yrs
- Wildfire 4/10 Moderate
- Heat 4/10 Moderate 7 d/yr ≥95°F today · 15 d/yr by 30 yrs out
- Wind 6/10 Major 27% chance of damaging wind over 30 yrs
- Air quality 2/10 Low 1 unhealthy d/yr today · 1 by 30 yrs out
Nearby sold comps map
Loading sold comps map…
Walkable amenities ~0.75 mi
Loading nearby amenities…
Taxation est. · year 1
- Rental income
- $23,109
- − Mortgage interest
- −$13,438
- − Property taxes
- −$4,629
- − Insurance
- −$1,200
- − Repairs & maintenance
- −$1,849
- − Management
- −$1,849
- − Depreciation
- −$6,979
- Taxable loss
- −$6,834
- Est. tax savings @ 24.0%
- +$1,640
- After-tax cash flow
- $-1,029/yr
For passive investors: Depreciation is non-cash, so a rental often shows a tax loss while cash-flowing — sheltering income. Rental losses are passive: they offset passive income freely, and up to $25,000/yr can offset ordinary (W-2) income if you actively participate and your MAGI is under $100k (phasing out to $0 by $150k); unused losses carry forward. On sale, claimed depreciation is recaptured at up to 25%, and gains may owe capital-gains tax (a 1031 exchange can defer both). Figures are a year-1 estimate at your 24.0% rate — not tax advice; consult a CPA.
Schools (NCES district)
- District
- Plymouth School District
- NCES district ID
- 0903330
- Math proficiency
- 42% ▼ -10.00%
- Reading proficiency
- 58% ▼ -2.00%
- Median HH income
- $71,517
- Composite
- 44.78/100
- National rank
- #2743
- State rank
- #78 of 153 in CT
Livability — Thomaston
- Score
- 64/100
- State rank
- #127
- US rank
- #14400
Category grades
Schools grade is shown separately in the Schools card above.
Census & demographics
- City population
- 7,493
- Population (ZIP)
- 2,098
Population outlook (Naugatuck Valley County) Hauer SSP2
- By 2040
- 496,846
Race, ethnicity, and origin ACS 2023
- Neighborhood character
- Predominantly White (85%)
- Race & ethnicity
- White 85% Black 6% Hispanic / Latino 5% Asian 4% Two or more races 1%
- Hispanic origin (detail)
- Puerto Rican 2%
- Common ancestry
- Lithuanian 7% Slovak 3% Romanian 3%
- Foreign-born
- 8% · China, Canada
- Languages at home
- 95% English-only · Chinese 2% Spanish 1% Other Indo-European 1%
Political lean MEDSL · Naugatuck Valley
- 2024 margin
- Lean R (+7.4) · D 45.6% · R 53.0% · Other 1.4%
- All cycles
- 2024: R+7.4
Not yet ingested
- Civics
- —
Market trends
- HPI YoY
- ▼ -24.38%
- Current HPI
- 199.1652
- Rent YoY
- —
- Metro
- —
- State GDP YoY
- ▲ 1.06%
- F500 in state
- 38
Industry mix (Fortune 500 HQ in CT)
| Industry | F500 HQs | Revenue |
|---|---|---|
| Industrial Machinery | 4 | $38B |
|
||
| Insurance | 3 | $71B |
|
||
| Financial Services | 2 | $25B |
|
||
| Transportation / Logistics | 2 | $18B |
|
||
| Healthcare | 1 | $247B |
|
||
| Telecommunications | 1 | $55B |
|
||
Price history
3 events — show timeline
- 2026-06-01 Pending — Smart MLS
- 2026-05-06 Contingent — Smart MLS
- 2026-04-20 Listed $239,900 Smart MLS
Property tax history
+1.8%/yrLatest (2023): $4,629 · +3.8% YoY. Source: county tax records.
Cash-flow waterfall
monthlySold comps — $/sqft
last 12 mo · ≤1 miLoading sold comps…