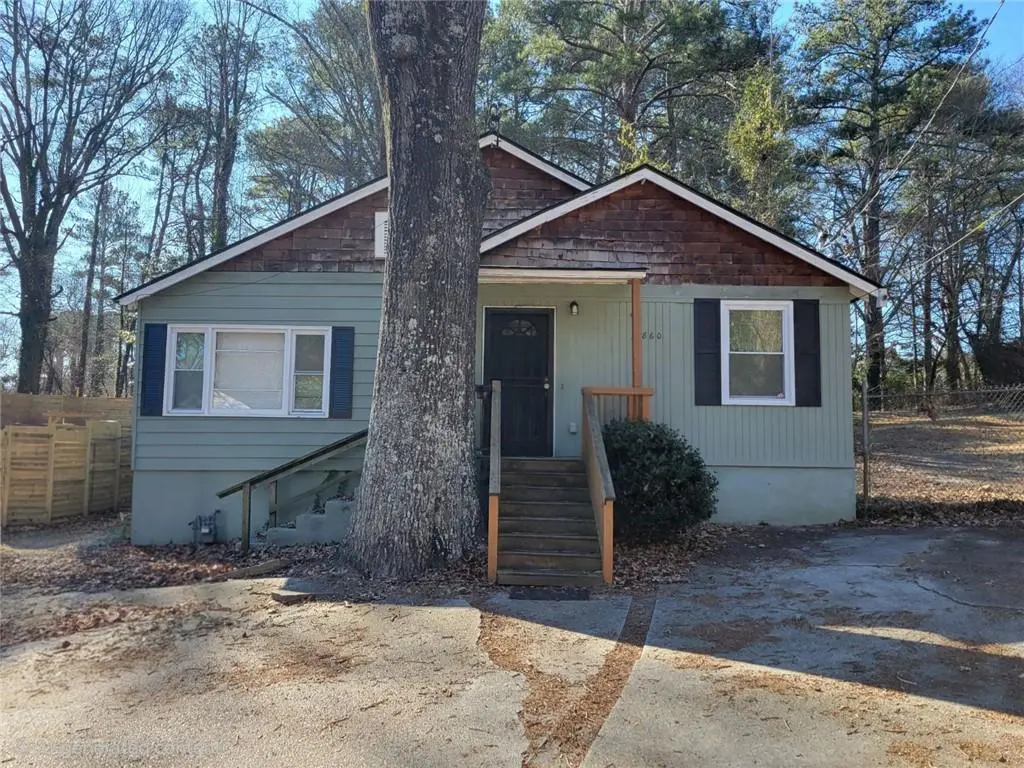
1860 North Ave NW · Atlanta, GA
Flood risk 1/10 · Minimal
- FEMA flood zone
- X (unshaded)
- Chance of flooding over 30 yrs
- 0.0%
- Est. flood insurance / yr
- $473 – $860
Fire risk 1/10 · Minimal
- Est. fire insurance / yr
- $963 – $1,789
Heat risk 5/10 · Moderate
- Hot days now (above 103°F)
- 7 days/yr
- Hot days in 30 yrs
- 16 days/yr
Wind risk 6/10 · Moderate
- Chance of severe wind over 30 yrs
- 27.0%
Air-quality risk 4/10 · Minor
- Unhealthy air days now
- 5 days/yr
- Unhealthy air days in 30 yrs
- 7 days/yr
Risk factors via First Street. Map © Google.
Why this score? — see what drove the B+ grade
The composite is a weighted blend of 9 inputs, each scored 0–100. Each bar is that input's sub-score; the figure is the points it added to the 100-point composite (weight × sub-score).
- Cash flow +28.7/30.0
- ARV discount +15.0/15.0
- DSCR +10.0/10.0
- 1% rule +8.9/10.0
- Livability +4.2/5.0
- Rent growth +3.3/5.0
- Schools +2.7/10.0
- Condition / age +2.5/5.0
- Appreciation +0.0/10.0
$235,000
🖨 Deal sheet 📄 Offer letter ✓ Due diligence
Listing remarks MLS
Priced for the savvy investor, this high-performance value-add property (light cleanup, minor repairs and tree removal-roof was replaced in 2022 and HVAC was replaced in 2021) offers an immediate foothold in Atlanta's rapidly appreciating Grove Park. Since 2022, the asset has established a robust performance history, currently generating an average monthly gross income of $3,764 (T-12) with a clear pro forma path to $4,805 and a projected 17.9% cash-on-cash return. This 1,770 sq ft residence features a high-density 7-bedroom, 2-bathroom layout perfectly optimized for a turnkey co-living investment. Situated on a quiet, well-maintained street backing up to a serene wooded buffer, the home offers a rare blend of privacy and premier accessibility-located just 250 feet from a MARTA stop and minutes from the heart of Downtown Atlanta. The property is strategically positioned to capitalize on the massive economic tailwinds surrounding Westside Park and major nearby redevelopments, including the 20-acre Cypress Grove project and the Microsoft-backed mixed-income community. With light renovations, an investor can maximize the existing revenue model in an "A+" location near prime shopping and dining. Featuring ample parking and situated in one of the city's most transformative growth corridors, 1860 North Avenue NW is a strategic asset ready to deliver immediate, scalable cash flow.
Key facts
- Hvac replaced
- Ample parking
- Roof replaced
Tags
Neighborhood map
What this means for you Summary
Snapshot
- This is a 6-bed/2.0-bath single-family listed at $235k.
Deal economics
- At list price, monthly cash flow is $781 ($9k/yr) — positive.
- The deal already cash-flows at list — no discount required.
- Meets the 1% rule at list price ($3k rent vs $235k).
- Recommended offer: $214k (9.0% below list) — sets the bar for market timing.
- Cap rate 10.3% vs local median 3.1% in Atlanta — top-decile yield for the area; either an underpriced asset or a hidden risk that comps aren't pricing in. Stress-test before assuming the spread holds.
Location & tenants
- Location reads 83/100 on livability (#6 in GA, #919 nationally) — a professional / high-income tenant draw. Strengths: amenities A+, commute A+, housing A+; Watch: schools C-, cost of living C-.
- Atlanta Public Schools (urban): math 28% / reading 35% proficiency, ranked #80 of 174 in GA (top 46%) — families likely to look elsewhere, expect single-tenant / working-renter base with shorter leases; 71% free/reduced lunch — lower-income household profile, screen leases tightly.
- Market conditions: Rents rising (+3.3%/yr); 722 active listings in the ZIP; 6 comparable units currently listed for rent nearby; rentals at typical pace (median 24d on market — plan ~3-4 weeks tenant-placement turnaround); solid renter incomes; 11,565 units permitted in Fulton County in 2024 (8,159 in 5+ unit buildings).
- At $3,259/mo this rent would consume 47% of the median local household income ($83k/yr) (locally 4182% of renters already pay >50% of income on rent) — very limited rent-growth headroom before tenants either downsize or default.
Forward outlook
- Local home prices are declining (-3.0%/yr); year-one equity from $2k of loan paydown is wiped out by about $7k of value loss. Plan a longer hold.
- Fulton County population projected at +38% by 2050 — long-run rental-demand tailwind backs the buy-and-hold thesis.
- At projected returns (-3.0% appreciation + 3.3% rent growth), your $66k cash investment doubles in ~8 years — after that, you're playing with house money.
Negotiation context
- It's been on market 112 days — a 9% lower offer ($214k) is reasonable based on typical stale-listing flexibility.
- 10 sale attempts since 9y ago with the ask held roughly flat each time — persistent listings suggest the price (not the market) is what's stuck; bring a comps-based counter.
Risks & watch-outs
- Watch-outs: built in 1940 — expect roof / HVAC / electrical / plumbing capex.
- Climate carrying-cost: major wind risk, 27% chance of damaging wind over 30y; extreme-heat days projected 7→16/yr by 2055 (HVAC capex compounding) — expect insurance premiums to compound above CPI over the hold.
Questions for the listing agent
- It's been on market 112 days. Have you received any prior offers? Is the seller open to a 9% concession, seller financing, or rate buy-down credit?
- Built in 1940 — when were the roof, HVAC, electrical panel, plumbing, and water heater last replaced?
- Why hasn't it sold? Are there any deal-killer items the seller is aware of (foundation, flood, title, zoning, code violations)?
- Is there a deadline driving the sale (1031 exchange, divorce, estate, relocation)? That informs how much negotiation room exists.
- What's the average days-on-market for RENTAL listings here right now (not sales)? A rising rental-DOM trend means longer vacancies and softer asking-rent achievability than the comps imply.
- What's the recent tenant-quality profile in this submarket — average credit score on applications, eviction rate, late-payment / NSF rate, and stable-employment percentage? A property-management company in the area should have these aggregated.
- How much new for-sale + rental construction is in the pipeline within 1–3 miles? Heavy new supply typically softens prices + rents 12–24 months out; constrained supply supports both.
Investment metrics
- 1% rule
- 1.39% ✓
- Cap rate
- 10.28%
- Cash-on-cash
- 14.24%
- DSCR
- 1.63
- GRM
- 6.0
CMA / ARV
- ARV (median comp)
- $362,458
- List price
- $235,000
- Delta
- -35.16%
- Verdict
- UNDERPRICED
- Comps
- 1 within 2.0 mi
Show comp detail 2 sales within ~0.75 mi
| Address | Dist | Beds/Ba | Sqft | Sold | Price | $/sf | Match |
|---|---|---|---|---|---|---|---|
| 397 Yonkers Ave NW | 0.44mi | 6/3.0 | 2,016 (+14%) | 12mo | $190,000 | $94 | 43 |
| 520 Holly St NW | 0.59mi | 5/3.0 (-1) | 1,895 (+7%) | 19mo | $385,000 | $203 | 36 |
Match score weights: distance 35% · size 25% · config 20% · recency 20%. Top-matched comps best support the ARV.
Projected returns pro-forma
-3.0% appreciation · 3.26% rent growth · sell at horizon
- IRR
- 4.9%
- Equity multiple
- 1.19×
- Total profit
- $12,671
- Equity at exit
- $35,039
- IRR
- 14.7%
- Equity multiple
- 2.20×
- Total profit
- $79,235
- Equity at exit
- $20,319
Cash invested: $65,800 (down + closing). Projections, not guarantees.
Landlord ↔ Tenant lean methodology
- Overall (STATE)
- 90 Strongly Landlord-Friendly
- State Georgia
- 90 Strongly Landlord-Friendly · R+3
- County
- — inherits STATE
- City
- — inherits STATE
ZIP-level market 30318
- Rents YoY
- 3.3%
- Active inventory
- 722
- Price-to-rent
- 6.0×
Monthly cashflow live
- Estimated rent
- $3,259 high interval (Pro) →
- Mortgage (P&I)
- −$1,232
- Tax from tax record
- −$464 /mo · $5,562/yr
- Insurance
- −$98
- HOA
- −$0
- Vacancy / Maint / Mgmt
- −$684
- Net cashflow
- $781
Break-even live
UW: 25.0% down · 7.5% · 30yr · 1.5% tax · 5.0% vac · 8.0% maint · 8.0% mgmt
Financing live
Cash to close
- Down payment
- $58,750
- Closing costs
- $7,050
- Reserves months
- —
- Total cash needed
- —
Loan-product check · same deal, 3 products live
Conventional
25% down · 7.5% · 30yr
- Down + closing
- —
- Monthly P&I
- —
- Monthly cashflow
- —
- DSCR
- —
- Eligible?
- —
Personal DTI + credit; lowest rate.
DSCR
20% down · 8.5% · 30yr
- Down + closing
- —
- Monthly P&I
- —
- Monthly cashflow
- —
- DSCR
- —
- Eligible?
- —
No personal income docs; deal must DSCR.
Hard money
10% down · 12.0% · 12mo
- Down + closing
- —
- Monthly P&I
- —
- Monthly cashflow
- —
- DSCR
- —
- Eligible?
- —
Short-term bridge; refi at stabilization.
Rent comps 6 comps
| Address | Beds | Baths | Sqft | Rent | $/sqft | DOM | Units | Dist |
|---|---|---|---|---|---|---|---|---|
| 1603 Ezra Church Dr NW Atlanta, GA | 5.0 | 4.0 | 2448 | $6,000 | $2.45 | 24d | 1 | 0.78mi |
| 2057 Verbena St NW Atlanta, GA | 5.0 | 3.0 | 1260 | $1,800 | $1.43 | 13d | 1 | 0.99mi |
| 2045 Lois Pl NW Unit A Atlanta, GA | 5.0 | 3.0 | 1344 | $3,450 | $2.57 | 18d | 1 | 1.24mi |
| 1080 Gun Club Rd NW Atlanta, GA | 5.0 | 3.0 | 2418 | $2,423 | $1.00 | 24d | 1 | 1.26mi |
| 841 Ridge Ave NW Atlanta, GA | 5.0 | 3.0 | 2196 | $2,423 | $1.10 | 20d | 1 | 1.33mi |
| 211 Laurel Ave SW Atlanta, GA | 5.0 | 3.0 | 2000 | $3,100 | $1.55 | 24d | 1 | 1.35mi |
Listing history 43 events
-
2026-06-18days on market $235,000 Active 112 DOM
-
2026-06-17days on market $235,000 Active 111 DOM
-
2026-06-16days on market $235,000 Active 110 DOM
-
2026-06-15days on market $235,000 Active 109 DOM
-
2026-06-13days on market $235,000 Active 107 DOM
-
2026-06-13days on market $235,000 Active 106 DOM
-
2026-06-09days on market $235,000 Active 103 DOM
-
2026-06-08days on market $235,000 Active 102 DOM
-
2026-06-07days on market $235,000 Active 101 DOM
-
2026-06-04days on market $235,000 Active 98 DOM
-
2026-06-03days on market $235,000 Active 97 DOM
-
2026-06-02days on market $235,000 Active 96 DOM
-
2026-06-01days on market $235,000 Active 95 DOM
-
2026-05-31days on market $235,000 Active 94 DOM
-
2026-02-26$235,000 New 1406-char remark
Show marketing remark (1418 chars)
Priced for the savvy investor, this high-performance value-add property (light cleanup, minor repairs and tree removal-roof was replaced in 2022 and HVAC was replaced in 2021) offers an immediate foothold in Atlanta’s rapidly appreciating Grove Park. Since 2022, the asset has established a robust performance history, currently generating an average monthly gross income of $3,764 (T-12) with a clear pro forma path to $4,805 and a projected 17.9% cash-on-cash return. This 1,770 sq ft residence features a high-density 7-bedroom, 2-bathroom layout perfectly optimized for a turnkey co-living investment. Situated on a quiet, well-maintained street backing up to a serene wooded buffer, the home offers a rare blend of privacy and premier accessibility—located just 250 feet from a MARTA stop and minutes from the heart of Downtown Atlanta. The property is strategically positioned to capitalize on the massive economic tailwinds surrounding Westside Park and major nearby redevelopments, including the 20-acre Cypress Grove project and the Microsoft-backed mixed-income community. With light renovations, an investor can maximize the existing revenue model in an "A+" location near prime shopping and dining. Featuring ample parking and situated in one of the city's most transformative growth corridors, 1860 North Avenue NW is a strategic asset ready to deliver immediate, scalable cash flow.
-
2026-02-26$235,000 Active 1418-char remark
Show marketing remark (1418 chars)
Priced for the savvy investor, this high-performance value-add property (light cleanup, minor repairs and tree removal-roof was replaced in 2022 and HVAC was replaced in 2021) offers an immediate foothold in Atlanta’s rapidly appreciating Grove Park. Since 2022, the asset has established a robust performance history, currently generating an average monthly gross income of $3,764 (T-12) with a clear pro forma path to $4,805 and a projected 17.9% cash-on-cash return. This 1,770 sq ft residence features a high-density 7-bedroom, 2-bathroom layout perfectly optimized for a turnkey co-living investment. Situated on a quiet, well-maintained street backing up to a serene wooded buffer, the home offers a rare blend of privacy and premier accessibility—located just 250 feet from a MARTA stop and minutes from the heart of Downtown Atlanta. The property is strategically positioned to capitalize on the massive economic tailwinds surrounding Westside Park and major nearby redevelopments, including the 20-acre Cypress Grove project and the Microsoft-backed mixed-income community. With light renovations, an investor can maximize the existing revenue model in an "A+" location near prime shopping and dining. Featuring ample parking and situated in one of the city's most transformative growth corridors, 1860 North Avenue NW is a strategic asset ready to deliver immediate, scalable cash flow.
-
2025-07-19historical $664
-
2025-07-13$664
-
2024-09-08historical
-
2024-09-08historical
-
2024-03-13$315,000 Active
-
2024-03-13$315,000 New
-
2021-09-13soldstatus $277,500
-
2021-09-03soldstatus $277,500 Closed
-
2021-08-30soldstatus $277,500 Sold
-
2021-08-07status Under Contract
-
2021-08-07historical Active Under Contract
-
2021-07-30$280,000 New
-
2021-07-28$280,000 Active
-
2019-12-03soldstatus $180,000
-
2019-12-02soldstatus $180,000 Sold
-
2019-11-15status Under Contract
-
2019-10-11price $195,000
-
2019-09-30soldstatus $80,000
-
2019-09-18$225,000 New
-
2017-05-05soldstatus $28,000 Sold
-
2017-04-28historical Pending
-
2017-04-26status Active
-
2017-04-24historical Pending
-
2017-04-11$34,900 Active
-
2008-11-05soldstatus $170,000
-
1979-08-15soldstatus $21,550
-
1976-06-01soldstatus $18,900
ⓘ Source: listings_history table (triggers on properties + properties_extension) + one-shot
backfill from property_details.listing_events for pre-trigger history.
Tax reassessment forecast GA · Resets to sale price
- Current annual tax
- $5,562 · $464/mo
- Projected year-2 tax
- $5,562 · $464/mo
- Expected delta
- $0/yr ($0/mo · 0.0%)
ⓘ Screening estimate from a state-policy table — verify with the county assessor before closing.
Climate risk First Street
- Flood 1/10 Low FEMA zone X (unshaded) · 0% chance over 30 yrs
- Wildfire 1/10 Low
- Heat 5/10 Major 7 d/yr ≥103°F today · 16 d/yr by 30 yrs out
- Wind 6/10 Major 27% chance of damaging wind over 30 yrs
- Air quality 4/10 Moderate 5 unhealthy d/yr today · 7 by 30 yrs out
Nearby sold comps map
Loading sold comps map…
Walkable amenities ~0.75 mi
Loading nearby amenities…
Taxation est. · year 1
- Rental income
- $39,111
- − Mortgage interest
- −$13,164
- − Property taxes
- −$5,562
- − Insurance
- −$1,175
- − Repairs & maintenance
- −$3,129
- − Management
- −$3,129
- − Depreciation
- −$6,836
- Taxable income
- $6,116
- Est. tax owed @ 24.0%
- −$1,468
- After-tax cash flow
- $7,904/yr
For passive investors: Depreciation is non-cash, so a rental often shows a tax loss while cash-flowing — sheltering income. Rental losses are passive: they offset passive income freely, and up to $25,000/yr can offset ordinary (W-2) income if you actively participate and your MAGI is under $100k (phasing out to $0 by $150k); unused losses carry forward. On sale, claimed depreciation is recaptured at up to 25%, and gains may owe capital-gains tax (a 1031 exchange can defer both). Figures are a year-1 estimate at your 24.0% rate — not tax advice; consult a CPA.
Schools (NCES district)
- District
- Atlanta Public Schools
- NCES district ID
- 1300120
- Math proficiency
- 28% ▼ -6.00%
- Reading proficiency
- 35% ▼ -2.00%
- Median HH income
- $48,306
- Composite
- 27.27/100
- National rank
- #7006
- State rank
- #80 of 174 in GA
Livability — Atlanta
- Score
- 83/100
- State rank
- #6
- US rank
- #919
Category grades
Schools grade is shown separately in the Schools card above.
Census & demographics
- Census place
- Atlanta, GA
- County
- Fulton County · 1,094,430 people
- City population
- 629,525
- Metro
- Atlanta-Sandy Springs-Alpharetta, GA
- Population (ZIP)
- 59,609
- Household income
- $83,116
- Rent vs Own
- Severe rent burden
- 4182.0
Population outlook (Fulton County) Hauer SSP2
- Today (2025)
- 1,203,707 people
- By 2030
- 1,299,706 · +8.0%
- By 2040
- 1,488,256 · +23.6%
- By 2050
- 1,664,580 · +38.3%
- By 2075
- 2,036,072 · +69.2%
- By 2100
- 2,222,402 · +84.6%
Race, ethnicity, and origin ACS 2023
- Neighborhood character
- Diverse neighborhood (Simpson 0.63)
- Race & ethnicity
- Black 49% White 35% Hispanic / Latino 7% Two or more races 6% Asian 5%
- Hispanic origin (detail)
- Mexican 2% Puerto Rican 1%
- Common ancestry
- Lithuanian 2% Slovak 2% Romanian 1%
- Foreign-born
- 8% · Canada, China, South Korea
- Languages at home
- 88% English-only · Spanish 4% Other Indo-European 2% Other Asian/Pacific 1%
Political lean MEDSL · Fulton
- 2024 margin
- Solid D (+44.9) · D 71.9% · R 27.0% · Other 1.1%
- 2008→2024 swing
- +9.8pp toward D · 2008: 35.0pp · 2024: 44.9pp
- All cycles
- 2024: D+44.9 2020: D+46.4 2016: D+42.1 2012: D+29.6 2008: D+35.0
Not yet ingested
- Civics
- —
Market trends
- HPI YoY
- ▼ -470.82%
- Current HPI
- 224.1493
- Rent YoY
- ▲ 3.26%
- Metro
- Atlanta-Sandy Springs-Alpharetta, GA
- State GDP YoY
- ▲ 2.66%
- F500 in state
- 28
Industry mix (Fortune 500 HQ in GA)
| Industry | F500 HQs | Revenue |
|---|---|---|
| Paper / Packaging | 2 | $29B |
|
||
| Retail | 1 | $160B |
|
||
| Transportation / Logistics | 1 | $91B |
|
||
| Airlines | 1 | $62B |
|
||
| Consumer Goods | 1 | $47B |
|
||
| Utilities | 1 | $25B |
|
||
Price history
+1143.4% since first listed29 events — show timeline
- 2026-02-26 Listed $235,000 FMLS
- 2026-02-26 Listed $235,000 GAMLS
- 2025-07-19 Rental Removed $664 ZUMPER1
- 2025-07-13 Listed for Rent $664 ZUMPER1
- 2024-09-08 Listing Removed — GAMLS
- 2024-09-08 Listing Removed — FMLS
- 2024-03-13 Listed $315,000 GAMLS
- 2024-03-13 Listed $315,000 FMLS
- 2021-09-13 Sold (Public Records) $277,500 Public Records
- 2021-09-03 Sold (MLS) $277,500 FMLS
- 2021-08-30 Sold (MLS) $277,500 GAMLS
- 2021-08-07 Pending — GAMLS
- 2021-08-07 Contingent — FMLS
- 2021-07-30 Listed $280,000 GAMLS
- 2021-07-28 Listed $280,000 FMLS
- 2019-12-03 Sold (Public Records) $180,000 Public Records
- 2019-12-02 Sold (MLS) $180,000 GAMLS
- 2019-11-15 Pending — GAMLS
- 2019-10-11 Price Changed $195,000 GAMLS
- 2019-09-30 Sold (Public Records) $80,000 Public Records
- 2019-09-18 Listed $225,000 GAMLS
- 2017-05-05 Sold (MLS) $28,000 FMLS
- 2017-04-28 Contingent — FMLS
- 2017-04-26 Relisted — FMLS
- 2017-04-24 Contingent — FMLS
- 2017-04-11 Listed $34,900 FMLS
- 2008-11-05 Sold (Public Records) $170,000 Public Records
- 1979-08-15 Sold (Public Records) $21,550 Public Records
- 1976-06-01 Sold (Public Records) $18,900 Public Records
Property tax history
+2.1%/yrLatest (2025): $5,562 · +17.6% YoY. Source: county tax records.
Cash-flow waterfall
monthlySold comps — $/sqft
last 12 mo · ≤1 miLoading sold comps…