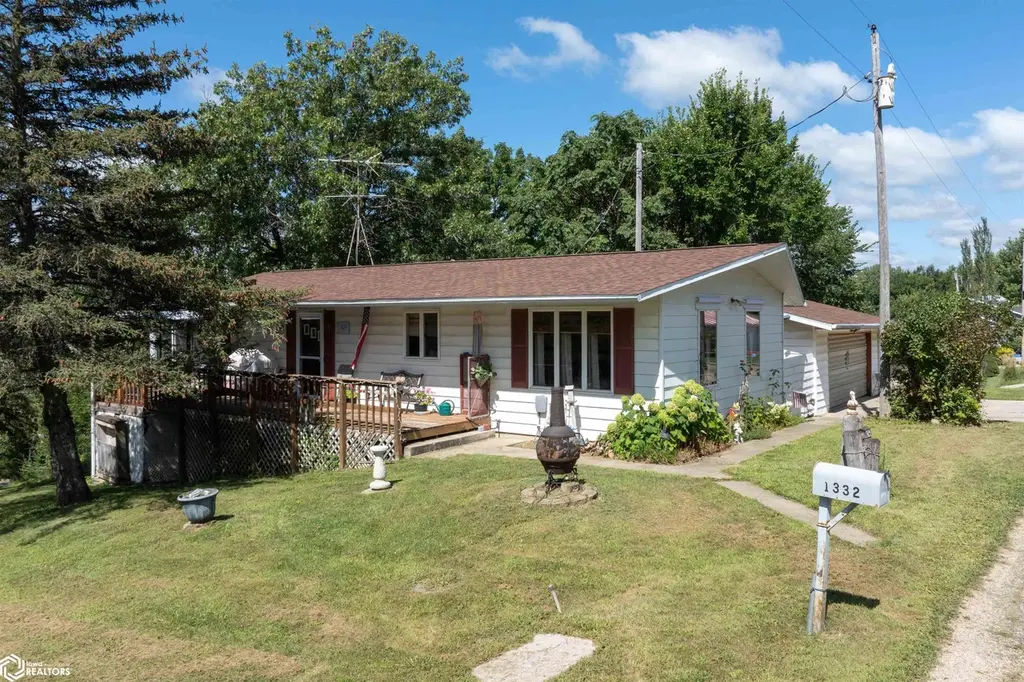
1332 Holiday Ln · Holiday Lake, IA
Flood risk 1/10 · Minimal
- FEMA flood zone
- X (unshaded)
- Chance of flooding over 30 yrs
- 0.0%
- Est. flood insurance / yr
- $473 – $860
Fire risk 3/10 · Minor
- Est. fire insurance / yr
- $902 – $1,676
Heat risk 2/10 · Minimal
- Hot days now (above 105°F)
- 7 days/yr
- Hot days in 30 yrs
- 15 days/yr
Wind risk 2/10 · Minimal
- Chance of severe wind over 30 yrs
- —
Air-quality risk 2/10 · Minimal
- Unhealthy air days now
- 0 days/yr
- Unhealthy air days in 30 yrs
- 1 days/yr
Risk factors via First Street. Map © Google.
Why this score? — see what drove the D grade
The composite is a weighted blend of 9 inputs, each scored 0–100. Each bar is that input's sub-score; the figure is the points it added to the 100-point composite (weight × sub-score).
- ARV discount +14.3/15.0
- Appreciation +9.3/10.0
- Schools +6.2/10.0
- Cash flow +5.0/30.0
- Livability +3.3/5.0
- Rent growth +2.5/5.0
- Condition / age +2.5/5.0
- 1% rule +0.2/10.0
- DSCR +0.0/10.0
$210,000
🖨 Deal sheet 📄 Offer letter ✓ Due diligence
Listing remarks MLS
Charming Lake View Home with Endless Potential! Enjoy beautiful lake views from the deck and 3-season porch of this off-lake home. The walkout basement includes a non-conforming bedroom, ½ bath, and ample storage space. 2 bedrooms and full bath upstairs. Offering an “as is” sale, this property has great potential for updates and personal touches. A perfect opportunity to create your own lake retreat!
Key facts
- Ample storage space
- Walkout basement
- Lake views
Tags
Neighborhood map
What this means for you Summary
Snapshot
- This is a 2-bed/1.5-bath single-family listed at $210k.
Deal economics
- At list price, monthly cash flow is $-496 ($-6k/yr) — negative.
- To cash-flow at today's rent, offer at most $122k (41.7% below list).
- To meet the 1% rule (rent ≥ 1% of price), the offer needs to be $110k (47.6% below list).
- Recommended offer: $110k (47.6% below list) — sets the bar for 1% rule.
- Cap rate 3.5% vs local median 1.8% in Holiday Lake — top-decile yield for the area; either an underpriced asset or a hidden risk that comps aren't pricing in. Stress-test before assuming the spread holds.
Location & tenants
- Location reads 66/100 on livability (#524 in IA) — a middle-class / working-renter tenant base. Strengths: crime A+, cost of living A+, housing A+; Watch: schools D, amenities F, commute F.
- Brooklyn-Guernsey-Malcom Community School District (rural): math 72% / reading 74% proficiency, ranked #101 of 289 in IA (top 35%) — strong family-tenant draw, lease renewals of 3-5y typical.
- Market conditions: 57 active listings in the ZIP; 27 units permitted in Poweshiek County in 2024 (0 in 5+ unit buildings).
Forward outlook
- In year one you build about $19k of equity ($1k loan paydown + $18k appreciation (8.6% local appreciation)).
- Poweshiek County population projected to shrink 3% by 2050 — rents likely to lag national; underwrite the cash flow, not the appreciation.
- By year 2, paydown + projected appreciation supports a ~$31k cash-out refi (75% LTV) — recoverable capital for the next deal without selling this one.
Negotiation context
- It's been on market 295 days — a 12% lower offer ($185k) is reasonable based on typical stale-listing flexibility.
- 2 sale attempts; this cycle's ask has dropped $40k (16%) from the opening price — seller is motivated, your offer sets the floor, not the list.
Questions for the listing agent
- What do current leases actually rent for vs. the listed asking? Can we see a recent rent roll and the last 12 months of T-12 income?
- It's been on market 295 days. Have you received any prior offers? Is the seller open to a 48% concession, seller financing, or rate buy-down credit?
- Built in 1962 — when were the roof, HVAC, electrical panel, plumbing, and water heater last replaced?
- Why hasn't it sold? Are there any deal-killer items the seller is aware of (foundation, flood, title, zoning, code violations)?
- Is there a deadline driving the sale (1031 exchange, divorce, estate, relocation)? That informs how much negotiation room exists.
- Schools are D-rated, which usually means shorter tenancies and higher turnover. Who's the typical renter profile here, and what's been the actual vacancy rate?
- The area grade is low — what's the realistic commute time and amenity access for the typical tenant pool here? Any planned neighborhood developments (good or bad) we should know about?
- What's the average days-on-market for RENTAL listings here right now (not sales)? A rising rental-DOM trend means longer vacancies and softer asking-rent achievability than the comps imply.
- What's the recent tenant-quality profile in this submarket — average credit score on applications, eviction rate, late-payment / NSF rate, and stable-employment percentage? A property-management company in the area should have these aggregated.
- How much new for-sale + rental construction is in the pipeline within 1–3 miles? Heavy new supply typically softens prices + rents 12–24 months out; constrained supply supports both.
Investment metrics
- 1% rule
- 0.52% ✗
- Cap rate
- 3.46%
- Cash-on-cash
- -10.13%
- DSCR
- 0.55
- GRM
- 15.9
CMA / ARV
- ARV (median comp)
- $247,431
- List price
- $210,000
- Delta
- -15.13%
- Verdict
- UNDERPRICED
- Comps
- 20 within 1.0 mi
Show comp detail 5 sales within ~0.75 mi
| Address | Dist | Beds/Ba | Sqft | Sold | Price | $/sf | Match |
|---|---|---|---|---|---|---|---|
| 1015 Lakeshore Dr | 0.08mi | 2/1.0 | 1,296 (-8%) | 12mo | $325,000 | $251 | 70 |
| 1296 Holiday Ln | 0.18mi | 2/2.0 | 1,344 (-5%) | 22mo | $234,000 | $174 | 64 |
| 5252 N Lakeshore Dr | 0.39mi | 3/2.0 (+1) | 1,296 (-8%) | 1mo | $475,000 | $367 | 60 |
| 3021 E Lakeshore Dr | 0.43mi | 2/1.0 | 1,294 (-8%) | 15mo | $449,900 | $348 | 52 |
| 3122 Holiday Ln | 0.37mi | 3/2.0 (+1) | 1,232 (-13%) | 10mo | $270,000 | $219 | 47 |
Match score weights: distance 35% · size 25% · config 20% · recency 20%. Top-matched comps best support the ARV.
Projected returns pro-forma
8.56% appreciation · 3.0% rent growth · sell at horizon
- IRR
- 13.8%
- Equity multiple
- 2.06×
- Total profit
- $62,461
- Equity at exit
- $167,624
- IRR
- 13.8%
- Equity multiple
- 4.49×
- Total profit
- $205,205
- Equity at exit
- $340,750
Cash invested: $58,800 (down + closing). Projections, not guarantees.
Landlord ↔ Tenant lean methodology
- Overall (STATE)
- 83 Strongly Landlord-Friendly
- State Iowa
- 83 Strongly Landlord-Friendly · R+6
- County
- — inherits STATE
- City
- — inherits STATE
ZIP-level market 52211
- Home prices YoY
- 2.6%
- Active inventory
- 57
- Price-to-rent
- 15.9×
Monthly cashflow live
- Estimated rent
- $1,100 medium interval (Pro) →
- Mortgage (P&I)
- −$1,101
- Tax from tax record
- −$177 /mo · $2,122/yr
- Insurance
- −$88
- HOA
- −$0
- Vacancy / Maint / Mgmt
- −$231
- Net cashflow
- $-496
Break-even live
UW: 25.0% down · 7.5% · 30yr · 1.5% tax · 5.0% vac · 8.0% maint · 8.0% mgmt
Financing live
Cash to close
- Down payment
- $52,500
- Closing costs
- $6,300
- Reserves months
- —
- Total cash needed
- —
Loan-product check · same deal, 3 products live
Conventional
25% down · 7.5% · 30yr
- Down + closing
- —
- Monthly P&I
- —
- Monthly cashflow
- —
- DSCR
- —
- Eligible?
- —
Personal DTI + credit; lowest rate.
DSCR
20% down · 8.5% · 30yr
- Down + closing
- —
- Monthly P&I
- —
- Monthly cashflow
- —
- DSCR
- —
- Eligible?
- —
No personal income docs; deal must DSCR.
Hard money
10% down · 12.0% · 12mo
- Down + closing
- —
- Monthly P&I
- —
- Monthly cashflow
- —
- DSCR
- —
- Eligible?
- —
Short-term bridge; refi at stabilization.
Listing history 19 events
-
2026-06-18days on market $210,000 Active 295 DOM
-
2026-06-17days on market $210,000 Active 294 DOM
-
2026-06-16days on market $210,000 Active 293 DOM
-
2026-06-15days on market $210,000 Active 292 DOM
-
2026-06-13days on market $210,000 Active 290 DOM
-
2026-06-12days on market $210,000 Active 289 DOM
-
2026-06-09days on market $210,000 Active 286 DOM
-
2026-06-08days on market $210,000 Active 285 DOM
-
2026-06-07days on market $210,000 Active 284 DOM
-
2026-06-07days on market $210,000 Active 283 DOM
-
2026-06-04days on market $210,000 Active 280 DOM
-
2026-06-02pricedays on market $210,000 Active 279 DOM
-
2026-06-01days on market $220,000 Active 278 DOM
-
2026-05-31days on market $220,000 Active 277 DOM
-
2026-05-31days on market $220,000 Active 276 DOM
-
2026-02-26status Active 422-char remark
Show marketing remark (422 chars)
Charming Lake View Home with Endless Potential! Enjoy beautiful lake views from the deck and 3-season porch of this off-lake home. The walkout basement includes a non-conforming bedroom, ½ bath, and ample storage space. 2 bedrooms and full bath upstairs. Offering an “as is” sale, this property has great potential for updates and personal touches. A perfect opportunity to create your own lake retreat!
-
2026-02-26price $220,000 422-char remark
Show marketing remark (422 chars)
Charming Lake View Home with Endless Potential! Enjoy beautiful lake views from the deck and 3-season porch of this off-lake home. The walkout basement includes a non-conforming bedroom, ½ bath, and ample storage space. 2 bedrooms and full bath upstairs. Offering an “as is” sale, this property has great potential for updates and personal touches. A perfect opportunity to create your own lake retreat!
-
2025-09-23price $240,000 422-char remark
Show marketing remark (422 chars)
Charming Lake View Home with Endless Potential! Enjoy beautiful lake views from the deck and 3-season porch of this off-lake home. The walkout basement includes a non-conforming bedroom, ½ bath, and ample storage space. 2 bedrooms and full bath upstairs. Offering an “as is” sale, this property has great potential for updates and personal touches. A perfect opportunity to create your own lake retreat!
-
2025-08-22$250,000 Active 422-char remark
Show marketing remark (422 chars)
Charming Lake View Home with Endless Potential! Enjoy beautiful lake views from the deck and 3-season porch of this off-lake home. The walkout basement includes a non-conforming bedroom, ½ bath, and ample storage space. 2 bedrooms and full bath upstairs. Offering an “as is” sale, this property has great potential for updates and personal touches. A perfect opportunity to create your own lake retreat!
ⓘ Source: listings_history table (triggers on properties + properties_extension) + one-shot
backfill from property_details.listing_events for pre-trigger history.
Tax reassessment forecast IA · Partial reset (capped growth)
- Current annual tax
- $2,122 · $177/mo
- Projected year-2 tax
- $2,710 · $226/mo
- Expected delta
- +$588/yr (+$49/mo · 27.7%)
ⓘ Screening estimate from a state-policy table — verify with the county assessor before closing.
Climate risk First Street
- Flood 1/10 Low FEMA zone X (unshaded) · 0% chance over 30 yrs
- Wildfire 3/10 Moderate
- Heat 2/10 Low 7 d/yr ≥105°F today · 15 d/yr by 30 yrs out
- Wind 2/10 Low
- Air quality 2/10 Low 0 unhealthy d/yr today · 1 by 30 yrs out
Nearby sold comps map
Loading sold comps map…
Walkable amenities ~0.75 mi
Loading nearby amenities…
Taxation est. · year 1
- Rental income
- $13,205
- − Mortgage interest
- −$11,763
- − Property taxes
- −$2,122
- − Insurance
- −$1,050
- − Repairs & maintenance
- −$1,056
- − Management
- −$1,056
- − Depreciation
- −$6,109
- Taxable loss
- −$9,952
- Est. tax savings @ 24.0%
- +$2,389
- After-tax cash flow
- $-3,567/yr
For passive investors: Depreciation is non-cash, so a rental often shows a tax loss while cash-flowing — sheltering income. Rental losses are passive: they offset passive income freely, and up to $25,000/yr can offset ordinary (W-2) income if you actively participate and your MAGI is under $100k (phasing out to $0 by $150k); unused losses carry forward. On sale, claimed depreciation is recaptured at up to 25%, and gains may owe capital-gains tax (a 1031 exchange can defer both). Figures are a year-1 estimate at your 24.0% rate — not tax advice; consult a CPA.
Schools (NCES district)
- District
- Brooklyn-Guernsey-Malcom Community School District
- NCES district ID
- 1905490
- Math proficiency
- 72% ▼ -4.00%
- Reading proficiency
- 74% ▲ 2.00%
- Median HH income
- $49,307
- Composite
- 61.79/100
- National rank
- #734
- State rank
- #101 of 289 in IA
Livability — Holiday Lake
- Score
- 66/100
- State rank
- #524
- US rank
- #11725
Category grades
Schools grade is shown separately in the Schools card above.
Census & demographics
- Census place
- Holiday Lake, IA
- Population (ZIP)
- 2,671
Population outlook (Poweshiek County) Hauer SSP2
- Today (2025)
- 18,601 people
- By 2030
- 18,342 · -1.4%
- By 2040
- 17,944 · -3.5%
- By 2050
- 18,029 · -3.1%
- By 2075
- 19,945 · +7.2%
- By 2100
- 22,637 · +21.7%
Race, ethnicity, and origin ACS 2023
- Neighborhood character
- Predominantly White (98%)
- Race & ethnicity
- White 98% Hispanic / Latino 2%
- Common ancestry
- English 4% Slovak 3% Iranian 2%
- Foreign-born
- 2% · Canada
- Languages at home
- 98% English-only · Spanish 1%
Political lean MEDSL · Poweshiek
- 2024 margin
- R (+17.0) · D 40.8% · R 57.8% · Other 1.5%
- 2008→2024 swing
- -28.7pp toward R · 2008: 11.8pp · 2024: -17.0pp
- All cycles
- 2024: R+17.0 2020: R+13.3 2016: R+6.8 2012: D+9.1 2008: D+11.8
Not yet ingested
- Civics
- —
Market trends
- HPI YoY
- ▲ 8.56%
- Current HPI
- 332.4308
- Rent YoY
- —
- Metro
- —
- State GDP YoY
- ▲ 2.48%
- F500 in state
- 4
Industry mix (Fortune 500 HQ in IA)
| Industry | F500 HQs | Revenue |
|---|---|---|
| Financial Services | 1 | $16B |
|
||
| Retail / Convenience | 1 | $15B |
|
||
Price history
-12.0% since first listed4 events — show timeline
- 2026-02-26 Relisted — IAR
- 2026-02-26 Price Changed $220,000 IAR
- 2025-09-23 Price Changed $240,000 IAR
- 2025-08-22 Listed $250,000 IAR
Property tax history
+5.6%/yrLatest (2025): $2,122 · -2.5% YoY. Source: county tax records.
Cash-flow waterfall
monthlySold comps — $/sqft
last 12 mo · ≤1 miLoading sold comps…