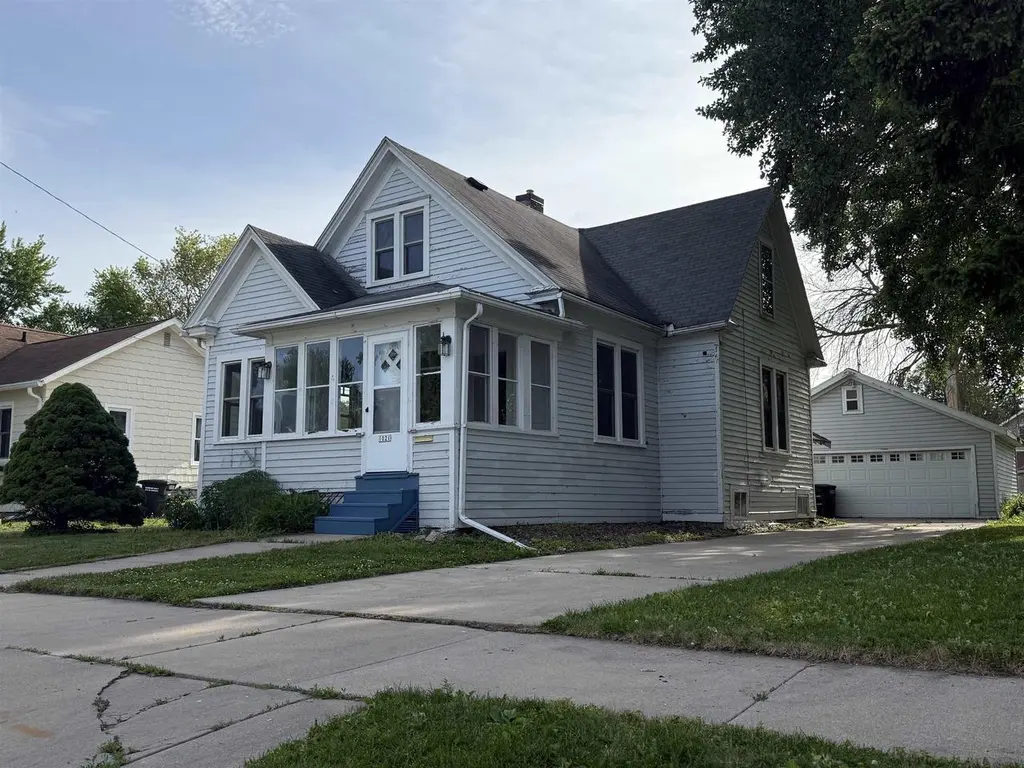
1021 Eastman St · Oshkosh, WI
Flood risk 1/10 · Minimal
- FEMA flood zone
- X (unshaded)
- Chance of flooding over 30 yrs
- 0.0%
- Est. flood insurance / yr
- $507 – $1,088
Fire risk 1/10 · Minimal
- Est. fire insurance / yr
- $636 – $1,182
Heat risk 2/10 · Minimal
- Hot days now (above 97°F)
- 7 days/yr
- Hot days in 30 yrs
- 13 days/yr
Wind risk 2/10 · Minimal
- Chance of severe wind over 30 yrs
- —
Air-quality risk 2/10 · Minimal
- Unhealthy air days now
- 1 days/yr
- Unhealthy air days in 30 yrs
- 2 days/yr
Risk factors via First Street. Map © Google.
Why this score? — see what drove the B- grade
The composite is a weighted blend of 9 inputs, each scored 0–100. Each bar is that input's sub-score; the figure is the points it added to the 100-point composite (weight × sub-score).
- Cash flow +27.0/30.0
- DSCR +9.3/10.0
- 1% rule +8.2/10.0
- ARV discount +7.5/15.0
- Livability +4.2/5.0
- Rent growth +3.7/5.0
- Schools +2.9/10.0
- Condition / age +2.5/5.0
- Appreciation +0.0/10.0
$139,900
🖨 Deal sheet (PDF) 📄 Offer letter ✓ Due diligence
Listing remarks
Opportunity is knocking! Bring your vision and creativity to this spacious 3-bedroom, 1-bath home offering nearly 2,000 square feet of potential in the City of Oshkosh. Featuring beautiful hardwood floors, first-floor laundry, generous room sizes, and plenty of original character, this property is ready for its next chapter. Whether you're looking for your next renovation project, investment opportunity, or a chance to build sweat equity, you'll appreciate the possibilities this home has to offer. Rumored to be one of the first homes built east of Main Street, this property may even come with a unique piece of Oshkosh history. Property is being sold as is, where is. Please allow 24 hours fo
Key facts
- Hardwood floors
- First-floor laundry
- 6,534 sq ft lot
Tags
Property features AI
Finance
- Other: Estimated above-grade finished area in the 1,751–2,000 sq ft range
Exterior
- Parking: Detached 2-car garage with opener
- Utilities: Municipal water; Municipal sewer; Natural gas
- Home design: 1.5-story single-family home; Construction completed; Residential zoning
- Construction: Built (year per assessor/public record); Less than 1/2 acre lot (about 0.15 acre)
- Exterior features: Cedar exterior; Sidewalks
Interior
- Kitchen: Dishwasher; Range/oven; Refrigerator; Formal dining room adjacent to the kitchen
- Bedrooms: Primary bedroom on upper level, about 11 x 12; Second bedroom on upper level, about 13 x 11; Third bedroom on upper level, about 10 x 7
- Flooring: Wood floors
- Bathrooms: At least one tub; One full bathroom
- Heating & cooling: Forced air heating (natural gas); Central air
- Interior features: Cable/satellite available; High-speed internet available; Wood floors
- Laundry & utility: Washer; Dryer; Crawl space with partial finish, sump pump, block foundation
Neighborhood map
What this means for you Summary
Snapshot
- This is a 4-bed/1.0-bath other listed at $140k.
Deal economics
- At list price, monthly cash flow is $390 ($5k/yr) — positive.
- The deal already cash-flows at list — no discount required.
- Meets the 1% rule at list price ($2k rent vs $140k).
- Recommended offer: $138k (1.5% below list) — sets the bar for market timing.
- Cap rate 9.6% vs local median 3.7% in Oshkosh — top-decile yield for the area; either an underpriced asset or a hidden risk that comps aren't pricing in. Stress-test before assuming the spread holds.
Location & tenants
- Location reads 85/100 on livability (#29 in WI, #574 nationally) — a professional / high-income tenant draw. Strengths: cost of living A+, housing A+, health & safety A+.
- Oshkosh Area School District (urban): math 33% / reading 34% proficiency, ranked #246 of 342 in WI (top 72%) — families likely to look elsewhere, expect single-tenant / working-renter base with shorter leases.
- Market conditions: Rents rising fast (+5.0%/yr); 82 active listings in the ZIP; 14 comparable units currently listed for rent nearby; rentals at typical pace (median 22d on market — plan ~3-4 weeks tenant-placement turnaround); 43% of comp listings sitting > 30 days — soft ceiling on asking rent; 652 units permitted in Winnebago County in 2024 (333 in 5+ unit buildings).
- This rent runs 36% of the median local income ($62k/yr) — at the standard rent-burdened threshold; future hikes will face affordability resistance.
Forward outlook
- Local home prices are declining (-3.0%/yr); year-one equity from $967 of loan paydown is wiped out by about $4k of value loss. Plan a longer hold.
- Winnebago County population projected at +3% by 2050 — modest demand growth; plan on rents tracking national, not racing it.
- At projected returns (-3.0% appreciation + 5.0% rent growth), your $39k cash investment doubles in ~8 years — after that, you're playing with house money.
Negotiation context
- It's been on market 15 days — a 2% lower offer ($138k) is reasonable based on typical stale-listing flexibility.
- Current owner paid $90k; list at $140k implies a 56% gain — meaningful room to come down on a strong offer.
Risks & watch-outs
- Watch-outs: built in 1900 — expect roof / HVAC / electrical / plumbing capex.
Questions for the listing agent
- Built in 1900 — when were the roof, HVAC, electrical panel, plumbing, and water heater last replaced?
- Is there a deadline driving the sale (1031 exchange, divorce, estate, relocation)? That informs how much negotiation room exists.
- What's the average days-on-market for RENTAL listings here right now (not sales)? A rising rental-DOM trend means longer vacancies and softer asking-rent achievability than the comps imply.
- What's the recent tenant-quality profile in this submarket — average credit score on applications, eviction rate, late-payment / NSF rate, and stable-employment percentage? A property-management company in the area should have these aggregated.
- How much new for-sale + rental construction is in the pipeline within 1–3 miles? Heavy new supply typically softens prices + rents 12–24 months out; constrained supply supports both.
Investment metrics
- 1% rule
- 1.32% ✓
- Cap rate
- 9.64%
- Cash-on-cash
- 11.94%
- DSCR
- 1.53
- GRM
- 6.3
CMA / ARV
No comps found within radius.
Projected returns pro-forma
-3.0% appreciation · 4.97% rent growth · sell at horizon
- IRR
- 3.9%
- Equity multiple
- 1.15×
- Total profit
- $5,979
- Equity at exit
- $20,860
- IRR
- 15.3%
- Equity multiple
- 2.37×
- Total profit
- $53,502
- Equity at exit
- $12,096
Cash invested: $39,172 (down + closing). Projections, not guarantees.
Landlord ↔ Tenant lean methodology
- Overall (STATE)
- 73 Landlord-Friendly
- State Wisconsin
- 73 Landlord-Friendly · R+2
- County
- — inherits STATE
- City
- — inherits STATE
ZIP-level market 54901
- Rents YoY
- 5.0%
- Active inventory
- 82
- Price-to-rent
- 6.3×
Monthly cashflow live
- Estimated rent
- $1,849 high interval (Pro) →
- Mortgage (P&I)
- −$734
- Tax from tax record
- −$279 /mo · $3,346/yr
- Insurance
- −$58
- HOA
- −$0
- Vacancy / Maint / Mgmt
- −$388
- Net cashflow
- $390
Break-even live
Sensitivity live
| Price | -10% $469 | -5% $429 | +0% $390 | +5% $350 | +10% $311 |
|---|---|---|---|---|---|
| Rent | -10% $244 | -5% $317 | +0% $390 | +5% $463 | +10% $536 |
| Rate | -1.0pp $460 | -0.5pp $425 | base $390 | +0.5pp $353 | +1.0pp $317 |
UW: 25.0% down · 7.5% · 30yr · 1.5% tax · 5.0% vac · 8.0% maint · 8.0% mgmt
Financing live
Cash to close
- Down payment
- $34,975
- Closing costs
- $4,197
- Reserves months
- —
- Total cash needed
- —
Loan-product check · same deal, 3 products live
Conventional
25% down · 7.5% · 30yr
- Down + closing
- —
- Monthly P&I
- —
- Monthly cashflow
- —
- DSCR
- —
- Eligible?
- —
Personal DTI + credit; lowest rate.
DSCR
20% down · 8.5% · 30yr
- Down + closing
- —
- Monthly P&I
- —
- Monthly cashflow
- —
- DSCR
- —
- Eligible?
- —
No personal income docs; deal must DSCR.
Hard money
10% down · 12.0% · 12mo
- Down + closing
- —
- Monthly P&I
- —
- Monthly cashflow
- —
- DSCR
- —
- Eligible?
- —
Short-term bridge; refi at stabilization.
Rent comps 14 comps
| Address | Beds | Baths | Sqft | Rent | $/sqft | DOM | Units | Dist |
|---|---|---|---|---|---|---|---|---|
| 319 E Irving Ave Oshkosh, WI | 3.0 | 1.5 | 1384 | $1,250 | $0.90 | 44d | 1 | 0.37mi |
| 728 Franklin St Oshkosh, WI | 5.0 | 1.0 | 1540 | $2,250 | $1.46 | 22d | 1 | 0.47mi |
| 685 Franklin St Unit B Oshkosh, WI | 4.0 | 2.0 | 1721 | $1,700 | $0.99 | 22d | 1 | 0.54mi |
| 733 Wright St Oshkosh, WI | 5.0 | 2.0 | 1642 | $2,200 | $1.34 | 44d | 1 | 0.57mi |
| 418 W Irving Ave Oshkosh, WI | 4.0 | 1.5 | 1536 | $2,225 | $1.45 | 44d | 1 | 0.58mi |
| 835 Wisconsin St Unit 2D Oshkosh, WI | 4.0 | 1.0 | 1400 | $1,399 | $1.00 | 22d | 1 | 0.59mi |
| 825 Wisconsin St Apt 3A Oshkosh, WI | 4.0 | 1.0 | 1400 | $1,449 | $1.03 | 44d | 1 | 0.60mi |
| 825 Wisconsin St Unit 2C Oshkosh, WI | 4.0 | 1.0 | 1400 | $1,399 | $1.00 | 22d | 1 | 0.60mi |
| 513 Evans St Unit 1514469P Oshkosh, WI | 3.0 | 1.5 | 1270 | $2,909 | $2.29 | 22d | 1 | 0.78mi |
| 306 Wisconsin St Oshkosh, WI | 3.0 | 1.0 | 1500 | $1,500 | $1.00 | 44d | 1 | 0.83mi |
| 306 Wisconsin St Oshkosh, WI | 4.0 | 1.0 | 1500 | $2,000 | $1.33 | 22d | 1 | 0.83mi |
| 95 Dawes St Oshkosh, WI | 3.0 | 2.0 | 1520 | $1,650 | $1.09 | 44d | 1 | 0.95mi |
| 500 Marion Rd Unit F204 Oshkosh, WI | 4.0 | 2.0 | 1528 | $2,000 | $1.31 | 22d | 1 | 1.01mi |
| 1113 Harney Ave Unit 1061625P Oshkosh, WI | 3.0 | 2.0 | 1991 | $3,154 | $1.58 | 14d | 1 | 1.37mi |
Listing history 12 events
-
2026-06-19days on market $139,900 Active 15 DOM
-
2026-06-18days on market $139,900 Active 14 DOM
-
2026-06-17days on market $139,900 Active 13 DOM
-
2026-06-16days on market $139,900 Active 12 DOM
-
2026-06-15days on market $139,900 Active 11 DOM
-
2026-06-14days on market $139,900 Active 9 DOM
-
2026-06-13days on market $139,900 Active 8 DOM
-
2026-06-10days on market $139,900 Active 6 DOM
-
2026-06-09days on market $139,900 Active 5 DOM
-
2026-06-08days on market $139,900 Active 4 DOM
-
2026-06-07remarks 699-char remark
-
2026-06-07$139,900 Active 3 DOM
ⓘ Source: listings_history table (triggers on properties + properties_extension) + one-shot
backfill from property_details.listing_events for pre-trigger history.
Tax reassessment forecast WI · Partial reset (capped growth)
- Current annual tax
- $3,346 · $279/mo
- Projected year-2 tax
- $3,346 · $279/mo
- Expected delta
- $0/yr ($0/mo · 0.0%)
ⓘ Screening estimate from a state-policy table — verify with the county assessor before closing.
Climate risk First Street
- Flood 1/10 Low FEMA zone X (unshaded) · 0% chance over 30 yrs
- Wildfire 1/10 Low
- Heat 2/10 Low 7 d/yr ≥97°F today · 13 d/yr by 30 yrs out
- Wind 2/10 Low
- Air quality 2/10 Low 1 unhealthy d/yr today · 2 by 30 yrs out
Nearby sold comps map
Loading sold comps map…
Walkable amenities ~0.75 mi
Loading nearby amenities…
Taxation est. · year 1
- Rental income
- $22,184
- − Mortgage interest
- −$7,837
- − Property taxes
- −$3,346
- − Insurance
- −$700
- − Repairs & maintenance
- −$1,775
- − Management
- −$1,775
- − Depreciation
- −$4,070
- Taxable income
- $2,683
- Est. tax owed @ 24.0%
- −$644
- After-tax cash flow
- $4,033/yr
For passive investors: Depreciation is non-cash, so a rental often shows a tax loss while cash-flowing — sheltering income. Rental losses are passive: they offset passive income freely, and up to $25,000/yr can offset ordinary (W-2) income if you actively participate and your MAGI is under $100k (phasing out to $0 by $150k); unused losses carry forward. On sale, claimed depreciation is recaptured at up to 25%, and gains may owe capital-gains tax (a 1031 exchange can defer both). Figures are a year-1 estimate at your 24.0% rate — not tax advice; consult a CPA.
Schools (NCES district)
- District
- Oshkosh Area School District
- NCES district ID
- 5511190
- Math proficiency
- 33% ▼ -7.00%
- Reading proficiency
- 34% ▼ -2.00%
- Median HH income
- $48,048
- Composite
- 28.92/100
- National rank
- #6634
- State rank
- #246 of 342 in WI
Livability — Oshkosh
- Score
- 85/100
- State rank
- #29
- US rank
- #574
Category grades
Schools grade is shown separately in the Schools card above.
Census & demographics
- Census place
- Oshkosh, WI
- County
- Winnebago County · 155,689 people
- City population
- 81,810
- Metro
- Oshkosh-Neenah, WI
- Population (ZIP)
- 37,294
- Household income
- $61,794
- Rent vs Own
- Severe rent burden
- 1484.0
Population outlook (Winnebago County) Hauer SSP2
- Today (2025)
- 175,480 people
- By 2030
- 177,928 · +1.4%
- By 2040
- 180,873 · +3.1%
- By 2050
- 181,302 · +3.3%
- By 2075
- 184,071 · +4.9%
- By 2100
- 175,932 · +0.3%
Race, ethnicity, and origin ACS 2023
- Neighborhood character
- Predominantly White (80%)
- Race & ethnicity
- White 80% Black 6% Hispanic / Latino 6% Two or more races 5% Asian 4%
- Hispanic origin (detail)
- Mexican 3% Puerto Rican 2%
- Common ancestry
- Romanian 6% Portuguese 4% Lithuanian 2%
- Foreign-born
- 4% · Canada
- Languages at home
- 93% English-only · Other Asian/Pacific 2% Spanish 2% Arabic 1%
Political lean MEDSL · Winnebago
- 2024 margin
- Toss-up / Even · D 46.9% · R 51.7% · Other 1.4%
- 2008→2024 swing
- -16.4pp toward R · 2008: 11.7pp · 2024: -4.8pp
- All cycles
- 2024: R+4.8 2020: R+4.0 2016: R+7.4 2012: D+3.8 2008: D+11.7
Not yet ingested
- Civics
- —
Market trends
- HPI YoY
- ▼ -128.12%
- Current HPI
- 187.7253
- Rent YoY
- ▲ 4.97%
- Metro
- Oshkosh-Neenah, WI
- State GDP YoY
- ▲ 2.10%
- F500 in state
- 20
Industry mix (Fortune 500 HQ in WI)
| Industry | F500 HQs | Revenue |
|---|---|---|
| Industrial Machinery | 4 | $23B |
|
||
| Industrial Technology | 2 | $36B |
|
||
| Insurance | 1 | $36B |
|
||
| Professional Services | 1 | $19B |
|
||
| Utilities | 1 | $9B |
|
||
| Consumer Goods | 1 | $3B |
|
||
Price history
+55.6% since first listed2 events — show timeline
- 2026-06-03 Listed $139,900 RANW
- 2006-08-28 Sold (Public Records) $89,900 Public Records
Property tax history
+4.3%/yrLatest (2024): $3,346 · +15.0% YoY. Source: county tax records.
Cash-flow waterfall
monthlySold comps — $/sqft
last 12 mo · ≤1 miLoading sold comps…