 Duplex
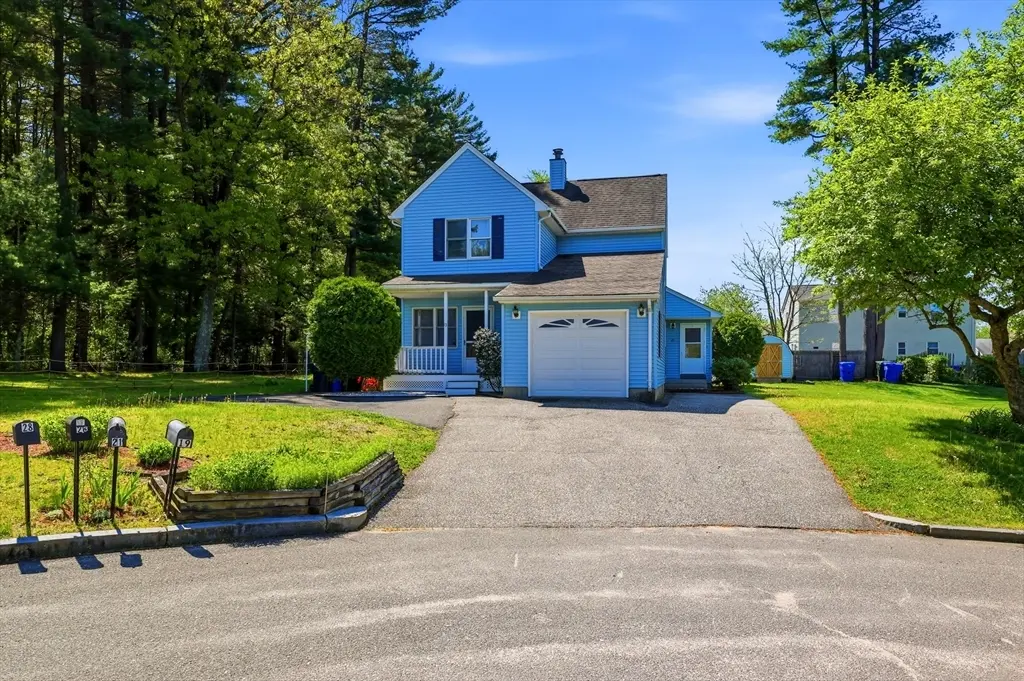
19-21 Wedgewood Cir · Springfield, MA
Flood risk No data
- FEMA flood zone
- —
- Chance of flooding over 30 yrs
- —
- Est. flood insurance / yr
- —
Fire risk No data
- Est. fire insurance / yr
- —
Heat risk No data
- Hot days now (above threshold)
- —
- Hot days in 30 yrs
- —
Wind risk No data
- Chance of severe wind over 30 yrs
- —
Air-quality risk No data
- Unhealthy air days now
- —
- Unhealthy air days in 30 yrs
- —
Risk factors via First Street. Map © Google.
Why this score? — see what drove the D- grade
The composite is a weighted blend of 9 inputs, each scored 0–100. Each bar is that input's sub-score; the figure is the points it added to the 100-point composite (weight × sub-score).
- Cash flow +13.4/30.0
- ARV discount +7.5/15.0
- DSCR +4.0/10.0
- 1% rule +3.8/10.0
- Livability +3.7/5.0
- Rent growth +2.5/5.0
- Condition / age +2.2/5.0
- Schools +1.6/10.0
- Appreciation +0.0/10.0
$399,000
🖨 Deal sheet 📄 Offer letter ✓ Due diligence
Multi-family units
County records classify this as Multi-Family (2-4 Unit). Listing-text estimate: 2 units. confirmed
Listing remarks MLS
DYNAMIC DUO-12 YR YOUNG DUPLEX. ONE UNIT HAS 5 RMS, 2 BEDRMS, & 2 FULL BATHS, PLUS GARAGE. 2ND UNIT HAS 3 RMS, 1BDRM, 1 FULL BATH. ALL THIS IS SET ON QUIET DEAD END STREET, W/LARGE PRIVATE YARD.
Key facts
- Multi-family house
- Cul-de-sac
- Patio
Tags
Property features AI
Finance
- HOA & community: Not a senior community
Exterior
- Parking: 1-car garage (1 covered space); 6 open parking spaces; Total 7 parking spaces; Off-street paved driveway parking
- Utilities: Public water; Public sewer; Individually metered electric with 100 amp service and circuit breakers; Connections available for electric range, gas dryer, electric dryer, and icemaker; Utilities vary per unit
- Home design: Two-family side-by-side property; 3 stories; Blue exterior
- Construction: Frame construction; Shingle roof; Concrete perimeter foundation; Built (year per public records)
- Exterior features: Porch; Patio; Rain gutters; Shed(s); Cul-de-sac lot; Cleared, gentle sloping to level terrain; Public road frontage on a publicly maintained road
Interior
- Kitchen: Range; Dishwasher; Disposal; Refrigerator; Plumbed for ice maker
- Flooring: Vinyl; Carpet
- Bathrooms: 3 full bathrooms
- Heating & cooling: Central forced air heating (2 heating units); Window air conditioning units; Thermostat (energy efficient)
- Interior features: 7 total rooms; Storage; Bathroom with tub and shower; Kitchen
- Laundry & utility: Washer and dryer included; Washer hookup; Gas dryer hookup; Electric dryer hookup
Neighborhood map
What this means for you Summary
Snapshot
- This is a 1×2bd/2ba + 1×1bd/1ba units multifamily listed at $399k. Condition is rated fair.
Deal economics
- At list price, monthly cash flow is $8 ($101/yr) — positive. Per door: $4/mo.
- The deal already cash-flows at list — no discount required.
- To meet the 1% rule (rent ≥ 1% of price), the offer needs to be $350k (12.3% below list).
- Recommended offer: $350k (12.3% below list) — sets the bar for 1% rule.
- Cap rate 6.3% vs local median 5.1% in Springfield — meaningfully above typical; check what's discounted (condition, days-on-market, listing class) to confirm the premium yield is real.
Location & tenants
- Location reads 73/100 on livability (#97 in MA) — a middle-class / working-renter tenant base. Strengths: commute A+, health & safety A+, amenities A; Watch: schools D, crime F, employment D-.
- Springfield (urban): math 13% / reading 25% proficiency, ranked #296 of 302 in MA (top 98%) — low school quality limits family demand, transient renter base, plan for 1-2y turnover; 81% free/reduced lunch — lower-income household profile, screen leases tightly.
- Market conditions: 13 active listings in the ZIP; 453 units permitted in Hampden County in 2024 (116 in 5+ unit buildings).
Forward outlook
- Local home prices are declining (-3.0%/yr); year-one equity from $3k of loan paydown is wiped out by about $12k of value loss. Plan a longer hold.
- Hampden County population projected at +5% by 2050 — modest demand growth; plan on rents tracking national, not racing it.
Negotiation context
- It's been on market 23 days — a 2% lower offer ($393k) is reasonable based on typical stale-listing flexibility.
- 2 sale attempts since 28y ago with the ask held roughly flat each time — persistent listings suggest the price (not the market) is what's stuck; bring a comps-based counter.
- Current owner paid $84k; list at $399k implies a 372% gain — meaningful room to come down on a strong offer.
Questions for the listing agent
- Can we see the unit-by-unit rent roll, current vacancy, and any below-market leases? What's the average tenancy length?
- What capital expenditures (roof, boiler, parking lot, exteriors) have been made in the last 5 years, and what's planned in the next 2?
- Have any recent inspections been done? Can we get a copy of the seller's disclosures and any deferred-maintenance estimates?
- Is there a deadline driving the sale (1031 exchange, divorce, estate, relocation)? That informs how much negotiation room exists.
- Schools are D-rated, which usually means shorter tenancies and higher turnover. Who's the typical renter profile here, and what's been the actual vacancy rate?
- Crime grade is F in this area — have there been break-ins, vandalism, or insurance claims at this property in the last 3 years? What carrier currently insures it and at what premium?
- The area grade is low — what's the realistic commute time and amenity access for the typical tenant pool here? Any planned neighborhood developments (good or bad) we should know about?
- What's the average days-on-market for RENTAL listings here right now (not sales)? A rising rental-DOM trend means longer vacancies and softer asking-rent achievability than the comps imply.
- What's the recent tenant-quality profile in this submarket — average credit score on applications, eviction rate, late-payment / NSF rate, and stable-employment percentage? A property-management company in the area should have these aggregated.
- How much new apartment / multifamily construction is in the pipeline within 1–3 miles? Heavy new supply (>2% of stock underway) typically softens rents 12–24 months out; light construction supports rent growth.
Investment metrics
- 1% rule
- 0.88% ✗
- Cap rate
- 6.32%
- Cash-on-cash
- 0.09%
- DSCR
- 1.00
- GRM
- 9.5
CMA / ARV
No comps found within radius.
Projected returns pro-forma
-3.0% appreciation · 3.0% rent growth · sell at horizon
- IRR
- -16.1%
- Equity multiple
- 0.43×
- Total profit
- $-64,068
- Equity at exit
- $59,492
- IRR
- -7.8%
- Equity multiple
- 0.51×
- Total profit
- $-54,886
- Equity at exit
- $34,498
Cash invested: $111,720 (down + closing). Projections, not guarantees.
Landlord ↔ Tenant lean methodology
- Overall (STATE)
- 20 Strongly Tenant-Friendly
- State Massachusetts
- 20 Strongly Tenant-Friendly · D+15
- County
- — inherits STATE
- City
- — inherits STATE
ZIP-level market 01129
- Home prices YoY
- -34.2%
- Active inventory
- 13
- Price-to-rent
- 18.4×
Monthly cashflow live
- Estimated rent
- $3,501 high interval (Pro) →
- Mortgage (P&I)
- −$2,092
- Tax est. 1.5%
- −$499 /mo · $5,985/yr
- Insurance
- −$166
- HOA
- −$0
- Vacancy / Maint / Mgmt
- −$735
- Net cashflow
- $8
Break-even live
2-unit breakdown (identical units grouped — click to expand)
| Units | Beds | Baths | Est. rent |
|---|---|---|---|
| 1× unit | 2 | 2 | $1,804 |
| 1× unit | 1 | 1 | $1,696 |
| Total (2 units) | $3,501 | ||
UW: 25.0% down · 7.5% · 30yr · 1.5% tax · 5.0% vac · 8.0% maint · 8.0% mgmt
Financing live
Cash to close
- Down payment
- $99,750
- Closing costs
- $11,970
- Reserves months
- —
- Total cash needed
- —
Loan-product check · same deal, 3 products live
Conventional
25% down · 7.5% · 30yr
- Down + closing
- —
- Monthly P&I
- —
- Monthly cashflow
- —
- DSCR
- —
- Eligible?
- —
Personal DTI + credit; lowest rate.
DSCR
20% down · 8.5% · 30yr
- Down + closing
- —
- Monthly P&I
- —
- Monthly cashflow
- —
- DSCR
- —
- Eligible?
- —
No personal income docs; deal must DSCR.
Hard money
10% down · 12.0% · 12mo
- Down + closing
- —
- Monthly P&I
- —
- Monthly cashflow
- —
- DSCR
- —
- Eligible?
- —
Short-term bridge; refi at stabilization.
Listing history 19 events
-
2026-06-18days on market $399,000 Active 23 DOM
-
2026-06-17days on market $399,000 Active 22 DOM
-
2026-06-16days on market $399,000 Active 21 DOM
-
2026-06-15days on market $399,000 Active 20 DOM
-
2026-06-14days on market $399,000 Active 18 DOM
-
2026-06-13days on market $399,000 Active 17 DOM
-
2026-06-10days on market $399,000 Active 15 DOM
-
2026-06-09days on market $399,000 Active 14 DOM
-
2026-06-08days on market $399,000 Active 13 DOM
-
2026-06-07days on market $399,000 Active 12 DOM
-
2026-06-05days on market $399,000 Active 9 DOM
-
2026-06-03days on market $399,000 Active 8 DOM
-
2026-06-02days on market $399,000 Active 7 DOM
-
2026-06-01days on market $399,000 Active 6 DOM
-
2026-05-31days on market $399,000 Active 5 DOM
-
2026-05-30statusdays on market $399,000 Active 4 DOM
-
2026-05-26$399,000 New
-
1999-02-19soldstatus $84,500 198-char remark
Show marketing remark (198 chars)
DYNAMIC DUO-12 YR YOUNG DUPLEX. ONE UNIT HAS 5 RMS, 2 BEDRMS, & 2 FULL BATHS, PLUS GARAGE. 2ND UNIT HAS 3 RMS, 1BDRM, 1 FULL BATH. ALL THIS IS SET ON QUIET DEAD END STREET, W/LARGE PRIVATE YARD.
-
1998-03-23$90,000 198-char remark
Show marketing remark (198 chars)
DYNAMIC DUO-12 YR YOUNG DUPLEX. ONE UNIT HAS 5 RMS, 2 BEDRMS, & 2 FULL BATHS, PLUS GARAGE. 2ND UNIT HAS 3 RMS, 1BDRM, 1 FULL BATH. ALL THIS IS SET ON QUIET DEAD END STREET, W/LARGE PRIVATE YARD.
ⓘ Source: listings_history table (triggers on properties + properties_extension) + one-shot
backfill from property_details.listing_events for pre-trigger history.
Nearby sold comps map
Loading sold comps map…
Walkable amenities ~0.75 mi
Loading nearby amenities…
Taxation est. · year 1
- Rental income
- $42,012
- − Mortgage interest
- −$22,350
- − Property taxes
- −$5,985
- − Insurance
- −$1,995
- − Repairs & maintenance
- −$3,361
- − Management
- −$3,361
- − Depreciation
- −$11,607
- Taxable loss
- −$6,647
- Est. tax savings @ 24.0%
- +$1,595
- After-tax cash flow
- $1,696/yr
For passive investors: Depreciation is non-cash, so a rental often shows a tax loss while cash-flowing — sheltering income. Rental losses are passive: they offset passive income freely, and up to $25,000/yr can offset ordinary (W-2) income if you actively participate and your MAGI is under $100k (phasing out to $0 by $150k); unused losses carry forward. On sale, claimed depreciation is recaptured at up to 25%, and gains may owe capital-gains tax (a 1031 exchange can defer both). Figures are a year-1 estimate at your 24.0% rate — not tax advice; consult a CPA.
Condition & rehab AI · 12 photos
This multi-family home requires moderate renovations to improve its condition and increase its resale and rental value.
Repairs flagged
- Major Exterior siding — Weathered and in need of repainting.
- Major Carpeted floors — Worn and need replacing.
- Major Bathroom fixtures — Outdated and in need of replacement.
- Major Kitchen cabinets and appliances — Dated and need updating.
- Major Landscaping — Overgrown and in need of maintenance.
Value-add opportunities
- Both Painting exterior siding — Enhances curb appeal and value
- Both Replacing carpeted floors — Improves living space and value
- Both Updating bathroom fixtures — Enhances functionality and value
- Both Updating kitchen cabinets and appliances — Modernizes space and value
- Both Maintaining landscaping — Enhances curb appeal and value
Renovation cost estimate screening
| Repair item | Severity | Est. cost |
|---|---|---|
| Exterior siding · Weathered and in need of repainting. | Major | $15,000–50,000 |
| Carpeted floors · Worn and need replacing. | Major | $15,000–50,000 |
| Bathroom fixtures · Outdated and in need of replacement. | Major | $15,000–50,000 |
| Kitchen cabinets and appliances · Dated and need updating. | Major | $15,000–50,000 |
| Landscaping · Overgrown and in need of maintenance. | Major | $15,000–50,000 |
| Total estimated repair cost · 5 items | $75,000–250,000 |
Value-add ROI direction
- Both Painting exterior siding — Enhances curb appeal and value ↑
- Both Replacing carpeted floors — Improves living space and value ↑
- Both Updating bathroom fixtures — Enhances functionality and value ↑
- Both Updating kitchen cabinets and appliances — Modernizes space and value ↑
- Both Maintaining landscaping — Enhances curb appeal and value ↑
ⓘ Cost ranges are severity-bucket heuristics (US national rule-of-thumb). Get contractor quotes + a written scope before underwriting a rehab budget.
Schools (NCES district)
- District
- Springfield
- NCES district ID
- 2511130
- Math proficiency
- 13% ▼ -12.00%
- Reading proficiency
- 25% ▼ -5.00%
- Median HH income
- $34,938
- Composite
- 15.6/100
- National rank
- #9293
- State rank
- #296 of 302 in MA
Livability — Springfield
- Score
- 73/100
- State rank
- #97
- US rank
- #5195
Category grades
Schools grade is shown separately in the Schools card above.
Census & demographics
- Census place
- Springfield, MA
- City population
- 61,006
- Population (ZIP)
- 5,993
Population outlook (Hampden County) Hauer SSP2
- Today (2025)
- 485,646 people
- By 2030
- 491,517 · +1.2%
- By 2040
- 500,539 · +3.1%
- By 2050
- 508,827 · +4.8%
- By 2075
- 539,167 · +11.0%
- By 2100
- 545,698 · +12.4%
Race, ethnicity, and origin ACS 2023
- Neighborhood character
- Diverse neighborhood (Simpson 0.61)
- Race & ethnicity
- White 54% Hispanic / Latino 30% Two or more races 15% Black 9% Asian 2%
- Hispanic origin (detail)
- Mexican 2% Puerto Rican 23% Dominican 3%
- Common ancestry
- Lithuanian 9% Romanian 5% Russian 2%
- Foreign-born
- 6% · Canada
- Languages at home
- 80% English-only · Spanish 17% Other Indo-European 2% Russian/Polish/Slavic 1%
Political lean MEDSL · Hampden
- 2024 margin
- Lean D (+8.9) · D 53.4% · R 44.5% · Other 2.1%
- 2008→2024 swing
- -16.4pp toward R · 2008: 25.3pp · 2024: 8.9pp
- All cycles
- 2024: D+8.9 2020: D+17.7 2016: D+16.0 2012: D+25.4 2008: D+25.3
Not yet ingested
- Civics
- —
Market trends
- HPI YoY
- ▼ -168.23%
- Current HPI
- 323.033
- Rent YoY
- —
- Metro
- —
- State GDP YoY
- ▲ 2.28%
- F500 in state
- 38
Industry mix (Fortune 500 HQ in MA)
| Industry | F500 HQs | Revenue |
|---|---|---|
| Technology | 3 | $17B |
|
||
| Insurance | 2 | $84B |
|
||
| Retail | 2 | $76B |
|
||
| Life Sciences | 1 | $43B |
|
||
| Energy Technology | 1 | $31B |
|
||
| Aerospace / Defense | 1 | $18B |
|
||
Price history
+343.3% since first listed3 events — show timeline
- 2026-05-26 Listed $399,000 MLS PIN
- 1999-02-19 Sold (MLS) $84,500 MLS PIN
- 1998-03-23 Listed $90,000 MLS PIN
Cash-flow waterfall
monthlySold comps — $/sqft
last 12 mo · ≤1 miLoading sold comps…