Lot 25 &26 Edgewater Beach Clb · Haskell, TX
Flood risk No data
- FEMA flood zone
- —
- Chance of flooding over 30 yrs
- —
- Est. flood insurance / yr
- —
Fire risk No data
- Est. fire insurance / yr
- —
Heat risk No data
- Hot days now (above threshold)
- —
- Hot days in 30 yrs
- —
Wind risk No data
- Chance of severe wind over 30 yrs
- —
Air-quality risk No data
- Unhealthy air days now
- —
- Unhealthy air days in 30 yrs
- —
Risk factors via First Street. Map © Google.
Why this score? — see what drove the D+ grade
The composite is a weighted blend of 9 inputs, each scored 0–100. Each bar is that input's sub-score; the figure is the points it added to the 100-point composite (weight × sub-score).
- Cash flow +15.2/30.0
- ARV discount +7.5/15.0
- Appreciation +6.5/10.0
- DSCR +4.7/10.0
- 1% rule +4.2/10.0
- Livability +3.4/5.0
- Schools +2.8/10.0
- Rent growth +2.5/5.0
- Condition / age +2.0/5.0
$89,900
🖨 Deal sheet (PDF) 📄 Offer letter ✓ Due diligence
Listing remarks MLS
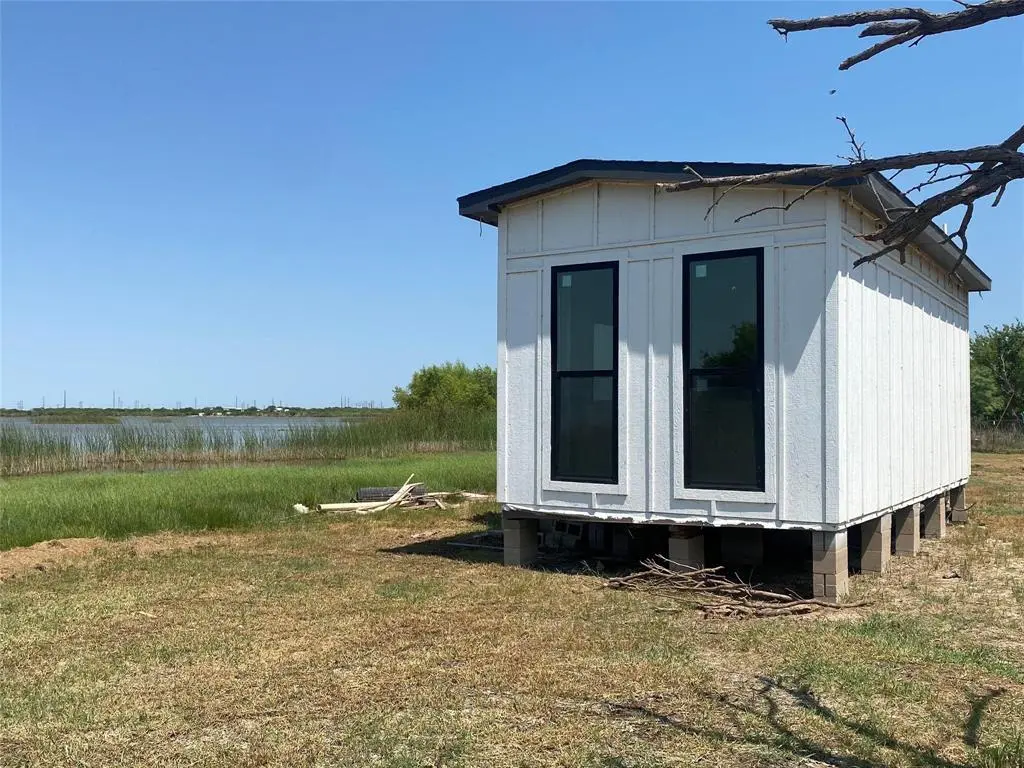
Two prime waterfront lots on Lake Stamford offering privacy, scenery, and endless potential. This property includes a fenced area and a one-bedroom tiny home featuring a built-in kitchen and bathroom. The tiny home still needs to be finished out, giving buyers the chance to customize it to their needs. Utilities are not yet connected; electricity is available, water is run to the unit, and sewer will need to be added. Enjoy beautiful lake views and peaceful surroundings—ideal for a weekend retreat, rental opportunity, or future build. A fantastic location with room to grow and make it your own. Buyer to verify all information.
Key facts
- Built-in kitchen
- Fenced area
- Lake views
Tags
Neighborhood map
What this means for you Summary
Snapshot
- This is a 1-bed/1.0-bath single-family listed at $90k. Condition is rated fair.
Deal economics
- At list price, monthly cash flow is $31 ($371/yr) — positive.
- The deal already cash-flows at list — no discount required.
- To meet the 1% rule (rent ≥ 1% of price), the offer needs to be $83k (8.2% below list).
- Recommended offer: $83k (8.2% below list) — sets the bar for 1% rule.
Location & tenants
- Location reads 67/100 on livability (#573 in TX) — a middle-class / working-renter tenant base. Strengths: crime A+, cost of living A+, housing A+; Watch: health & safety C-, amenities F, commute F.
- Haskell CISD (town): math 31% / reading 36% proficiency, ranked #561 of 826 in TX (top 68%) — families likely to look elsewhere, expect single-tenant / working-renter base with shorter leases; 63% free/reduced lunch — lower-income household profile, screen leases tightly.
- Zoned schools: Haskell El (math 27% / reading 37%, grade F, #2,268 of 4,322 statewide, top 55%, 267 students, 68% FRL); Haskell J H (math 27% / reading 32%, grade F, #1,077 of 1,662 statewide, top 66%, 124 students, 71% FRL); Haskell H S (math 54% / reading 44%, grade D, #509 of 1,632 statewide, top 34%, 148 students, 60% FRL) — zoned schools at 66% FRL track the district average.
- Market conditions: 44 active listings in the ZIP.
Forward outlook
- In year one you build about $3k of equity ($622 loan paydown + $3k appreciation (3.1% local appreciation)).
- Haskell County population projected at +6% by 2050 — modest demand growth; plan on rents tracking national, not racing it.
- At projected returns (3.1% appreciation + 3.0% rent growth), your $25k cash investment doubles in ~6 years — after that, you're playing with house money.
- By year 10, paydown + projected appreciation supports a ~$33k cash-out refi (75% LTV) — recoverable capital for the next deal without selling this one.
Negotiation context
- It's been on market 66 days — a 6% lower offer ($85k) is reasonable based on typical stale-listing flexibility.
- 3 sale attempts with the ask held roughly flat each time — persistent listings suggest the price (not the market) is what's stuck; bring a comps-based counter.
Questions for the listing agent
- It's been on market 66 days. Have you received any prior offers? Is the seller open to a 8% concession, seller financing, or rate buy-down credit?
- Have any recent inspections been done? Can we get a copy of the seller's disclosures and any deferred-maintenance estimates?
- Why hasn't it sold? Are there any deal-killer items the seller is aware of (foundation, flood, title, zoning, code violations)?
- Is there a deadline driving the sale (1031 exchange, divorce, estate, relocation)? That informs how much negotiation room exists.
- Schools are D-rated, which usually means shorter tenancies and higher turnover. Who's the typical renter profile here, and what's been the actual vacancy rate?
- The area grade is low — what's the realistic commute time and amenity access for the typical tenant pool here? Any planned neighborhood developments (good or bad) we should know about?
- What's the average days-on-market for RENTAL listings here right now (not sales)? A rising rental-DOM trend means longer vacancies and softer asking-rent achievability than the comps imply.
- What's the recent tenant-quality profile in this submarket — average credit score on applications, eviction rate, late-payment / NSF rate, and stable-employment percentage? A property-management company in the area should have these aggregated.
- How much new for-sale + rental construction is in the pipeline within 1–3 miles? Heavy new supply typically softens prices + rents 12–24 months out; constrained supply supports both.
Investment metrics
- 1% rule
- 0.92% ✗
- Cap rate
- 6.71%
- Cash-on-cash
- 1.47%
- DSCR
- 1.07
- GRM
- 9.1
CMA / ARV
- ARV (median comp)
- $53,102
- List price
- $89,900
- Delta
- 69.30%
- Verdict
- OVERPRICED
- Comps
- 20 within 1.0 mi
Show comp detail 2 sales within ~0.75 mi
| Address | Dist | Beds/Ba | Sqft | Sold | Price | $/sf | Match |
|---|---|---|---|---|---|---|---|
| 205 N Avenue D | 0.13mi | 2/1.0 (+1) | 862 (-4%) | 20mo | $30,000 | $35 | 65 |
| 303 S Avenue C | 0.28mi | 2/1.0 (+1) | 816 (-9%) | 6mo | $50,000 | $61 | 61 |
Match score weights: distance 35% · size 25% · config 20% · recency 20%. Top-matched comps best support the ARV.
Projected returns pro-forma
3.09% appreciation · 3.0% rent growth · sell at horizon
- IRR
- 9.1%
- Equity multiple
- 1.53×
- Total profit
- $13,250
- Equity at exit
- $40,891
- IRR
- 11.6%
- Equity multiple
- 2.74×
- Total profit
- $43,898
- Equity at exit
- $63,384
Cash invested: $25,172 (down + closing). Projections, not guarantees.
Landlord ↔ Tenant lean methodology
- Overall (STATE)
- 87 Strongly Landlord-Friendly
- State Texas
- 87 Strongly Landlord-Friendly · R+5
- County
- — inherits STATE
- City
- — inherits STATE
ZIP-level market 79521
- Home prices YoY
- 2.6%
- Active inventory
- 44
- Price-to-rent
- 9.1×
Monthly cashflow live
- Estimated rent
- $826 medium interval (Pro) →
- Mortgage (P&I)
- −$471
- Tax est. 1.5%
- −$112 /mo · $1,348/yr
- Insurance
- −$37
- HOA
- −$0
- Vacancy / Maint / Mgmt
- −$173
- Net cashflow
- $31
Break-even live
Sensitivity live
| Price | -10% $93 | -5% $62 | +0% $31 | +5% $0 | +10% $-31 |
|---|---|---|---|---|---|
| Rent | -10% $-34 | -5% $-2 | +0% $31 | +5% $64 | +10% $96 |
| Rate | -1.0pp $76 | -0.5pp $54 | base $31 | +0.5pp $8 | +1.0pp $-16 |
UW: 25.0% down · 7.5% · 30yr · 1.5% tax · 5.0% vac · 8.0% maint · 8.0% mgmt
Financing live
Cash to close
- Down payment
- $22,475
- Closing costs
- $2,697
- Reserves months
- —
- Total cash needed
- —
Loan-product check · same deal, 3 products live
Conventional
25% down · 7.5% · 30yr
- Down + closing
- —
- Monthly P&I
- —
- Monthly cashflow
- —
- DSCR
- —
- Eligible?
- —
Personal DTI + credit; lowest rate.
DSCR
20% down · 8.5% · 30yr
- Down + closing
- —
- Monthly P&I
- —
- Monthly cashflow
- —
- DSCR
- —
- Eligible?
- —
No personal income docs; deal must DSCR.
Hard money
10% down · 12.0% · 12mo
- Down + closing
- —
- Monthly P&I
- —
- Monthly cashflow
- —
- DSCR
- —
- Eligible?
- —
Short-term bridge; refi at stabilization.
Listing history 21 events
-
2026-06-21days on market $89,900 Active 66 DOM
-
2026-06-21days on market $89,900 Active 65 DOM
-
2026-06-18days on market $89,900 Active 63 DOM
-
2026-06-17days on market $89,900 Active 62 DOM
-
2026-06-16days on market $89,900 Active 61 DOM
-
2026-06-15days on market $89,900 Active 60 DOM
-
2026-06-13days on market $89,900 Active 58 DOM
-
2026-06-12days on market $89,900 Active 57 DOM
-
2026-06-10days on market $89,900 Active 54 DOM
-
2026-06-08days on market $89,900 Active 53 DOM
-
2026-06-08days on market $89,900 Active 52 DOM
-
2026-06-05days on market $89,900 Active 50 DOM
-
2026-06-03days on market $89,900 Active 48 DOM
-
2026-06-02days on market $89,900 Active 47 DOM
-
2026-06-01days on market $89,900 Active 46 DOM
-
2026-05-31days on market $89,900 Active 45 DOM
-
2026-04-16$89,900 Active 642-char remark
Show marketing remark (642 chars)
Two prime waterfront lots on Lake Stamford offering privacy, scenery, and endless potential. This property includes a fenced area and a one-bedroom tiny home featuring a built-in kitchen and bathroom. The tiny home still needs to be finished out, giving buyers the chance to customize it to their needs. Utilities are not yet connected; electricity is available, water is run to the unit, and sewer will need to be added. Enjoy beautiful lake views and peaceful surroundings—ideal for a weekend retreat, rental opportunity, or future build. A fantastic location with room to grow and make it your own. Buyer to verify all information.
-
2026-03-31historical
-
2025-10-21status Active
-
2025-10-03historical Active Contingent
-
2025-09-05$97,500 Active
ⓘ Source: listings_history table (triggers on properties + properties_extension) + one-shot
backfill from property_details.listing_events for pre-trigger history.
Nearby sold comps map
Loading sold comps map…
Walkable amenities ~0.75 mi
Loading nearby amenities…
Taxation est. · year 1
- Rental income
- $9,906
- − Mortgage interest
- −$5,036
- − Property taxes
- −$1,348
- − Insurance
- −$450
- − Repairs & maintenance
- −$793
- − Management
- −$793
- − Depreciation
- −$2,615
- Taxable loss
- −$1,128
- Est. tax savings @ 24.0%
- +$271
- After-tax cash flow
- $641/yr
For passive investors: Depreciation is non-cash, so a rental often shows a tax loss while cash-flowing — sheltering income. Rental losses are passive: they offset passive income freely, and up to $25,000/yr can offset ordinary (W-2) income if you actively participate and your MAGI is under $100k (phasing out to $0 by $150k); unused losses carry forward. On sale, claimed depreciation is recaptured at up to 25%, and gains may owe capital-gains tax (a 1031 exchange can defer both). Figures are a year-1 estimate at your 24.0% rate — not tax advice; consult a CPA.
Condition & rehab AI · 7 photos
The home requires significant repairs and maintenance, including exterior siding, roof, flooring, interior walls, and landscaping. Improvements to these areas will significantly increase its value.
Repairs flagged
- Major exterior siding — Significant damage and wear
- Major roof — Significant damage and wear
- Major flooring — Significant damage and wear
- Major interior walls/paint — Significant damage and wear
- Major landscaping — Overgrown grass and debris
Value-add opportunities
- Both HVAC system — Improving HVAC system will enhance comfort and energy efficiency
- Both exterior siding and roof repair — Repairing the exterior siding and roof will improve the home's appearance and increase its value
- Both landscaping and curb appeal — Improving the landscaping and curb appeal will enhance the home's appearance and increase its value
Renovation cost estimate screening
| Repair item | Severity | Est. cost |
|---|---|---|
| exterior siding · Significant damage and wear | Major | $15,000–50,000 |
| roof · Significant damage and wear | Major | $15,000–50,000 |
| flooring · Significant damage and wear | Major | $15,000–50,000 |
| interior walls/paint · Significant damage and wear | Major | $15,000–50,000 |
| landscaping · Overgrown grass and debris | Major | $15,000–50,000 |
| Total estimated repair cost · 5 items | $75,000–250,000 |
Value-add ROI direction
- Both HVAC system — Improving HVAC system will enhance comfort and energy efficiency ↑
- Both exterior siding and roof repair — Repairing the exterior siding and roof will improve the home's appearance and increase its value ↑
- Both landscaping and curb appeal — Improving the landscaping and curb appeal will enhance the home's appearance and increase its value ↑
ⓘ Cost ranges are severity-bucket heuristics (US national rule-of-thumb). Get contractor quotes + a written scope before underwriting a rehab budget.
Schools (NCES district)
- District
- Haskell CISD
- NCES district ID
- 4822740
- Math proficiency
- 31% ▼ -18.00%
- Reading proficiency
- 36% ▼ -8.00%
- Median HH income
- $41,661
- Composite
- 28.29/100
- National rank
- #6791
- State rank
- #561 of 826 in TX
Livability — Haskell
- Score
- 67/100
- State rank
- #573
- US rank
- #10965
Category grades
Schools grade is shown separately in the Schools card above.
Census & demographics
- Census place
- Haskell, TX
- Population (ZIP)
- 3,470
Population outlook (Haskell County) Hauer SSP2
- Today (2025)
- 5,679 people
- By 2030
- 5,693 · +0.2%
- By 2040
- 5,769 · +1.6%
- By 2050
- 6,012 · +5.9%
- By 2075
- 6,792 · +19.6%
- By 2100
- 6,531 · +15.0%
Race, ethnicity, and origin ACS 2023
- Neighborhood character
- Predominantly White (70%)
- Race & ethnicity
- White 70% Hispanic / Latino 22% Black 7% Two or more races 4%
- Hispanic origin (detail)
- Mexican 18%
- Common ancestry
- Serbian 4% Slovak 3% Lithuanian 2%
- Foreign-born
- 7% · Canada
- Languages at home
- 79% English-only · Spanish 19% Other Indo-European 1%
Political lean MEDSL · Haskell
- 2024 margin
- Solid R (+71.5) · D 13.9% · R 85.4%
- 2008→2024 swing
- -38.9pp toward R · 2008: -32.6pp · 2024: -71.5pp
- All cycles
- 2024: R+71.5 2020: R+67.2 2016: R+61.7 2012: R+43.4 2008: R+32.6
Not yet ingested
- Civics
- —
Market trends
- HPI YoY
- ▲ 3.09%
- Current HPI
- 121.407
- Rent YoY
- —
- Metro
- —
- State GDP YoY
- ▲ 3.95%
- F500 in state
- 110
Industry mix (Fortune 500 HQ in TX)
| Industry | F500 HQs | Revenue |
|---|---|---|
| Energy | 16 | $1,198B |
|
||
| Technology | 5 | $198B |
|
||
| Engineering / Construction | 4 | $72B |
|
||
| Energy Services | 3 | $60B |
|
||
| Utilities | 3 | $41B |
|
||
| Healthcare | 2 | $330B |
|
||
Price history
-7.8% since first listed5 events — show timeline
- 2026-04-16 Listed $89,900 NTREIS
- 2026-03-31 Listing Removed — NTREIS
- 2025-10-21 Relisted — NTREIS
- 2025-10-03 Contingent — NTREIS
- 2025-09-05 Listed $97,500 NTREIS
Cash-flow waterfall
monthlySold comps — $/sqft
last 12 mo · ≤1 miLoading sold comps…