1805 Lavonia Ln · Pasadena, TX
Flood risk 1/10 · Minimal
- FEMA flood zone
- X (unshaded)
- Chance of flooding over 30 yrs
- 0.0%
- Est. flood insurance / yr
- $507 – $1,088
Fire risk 1/10 · Minimal
- Est. fire insurance / yr
- $1,222 – $2,270
Heat risk 10/10 · Severe
- Hot days now (above 109°F)
- 7 days/yr
- Hot days in 30 yrs
- 24 days/yr
Wind risk 9/10 · Severe
- Chance of severe wind over 30 yrs
- 99.0%
Air-quality risk 2/10 · Minimal
- Unhealthy air days now
- 2 days/yr
- Unhealthy air days in 30 yrs
- 2 days/yr
Risk factors via First Street. Map © Google.
Why this score? — see what drove the C- grade
The composite is a weighted blend of 9 inputs, each scored 0–100. Each bar is that input's sub-score; the figure is the points it added to the 100-point composite (weight × sub-score).
- Cash flow +17.2/30.0
- ARV discount +15.0/15.0
- 1% rule +6.0/10.0
- DSCR +5.4/10.0
- Livability +3.3/5.0
- Schools +2.6/10.0
- Rent growth +2.5/5.0
- Condition / age +2.5/5.0
- Appreciation +0.0/10.0
$155,000
🖨 Deal sheet (PDF) 📄 Offer letter ✓ Due diligence
Listing remarks
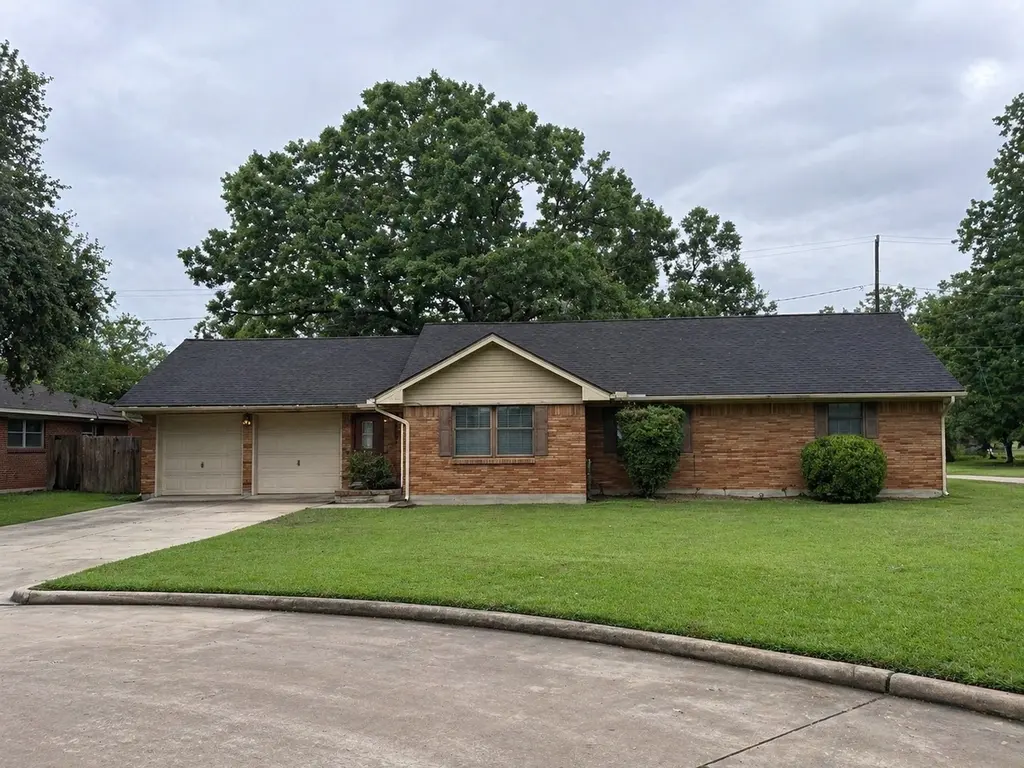
Nestled in the heart of Pasadena, this Mid Century/Ranch style home has three-bedroom, two-baths a formal dining and living space. The primary suite includes a private bath, creating a relaxing retreat at the end of the day. The corner lot enhances the outdoor experience, offering additional yard space for gatherings, pets, or future customization. With its established neighborhood setting, this home provides a welcoming atmosphere while still being conveniently located near major thoroughfares, shopping, dining, and local schools. Located in Pasadena—part of the greater Houston metro area—residents enjoy easy access to employment hubs, petrochemical industries, and nearby coast
Key facts
- 8,999 sq ft lot
- 2 garage spots
- Built 1960
Property features AI
Finance
- HOA & community: Curbs
Exterior
- Parking: Attached garage; 2 garage spaces
- Utilities: Public water; Public sewer
- Home design: Residential property; Full ownership; Single-story entry (all main rooms listed as first floor)
- Construction: Built in 1960; Brick and wood siding exterior; Composition roof; Slab foundation
- Exterior features: Corner lot in a subdivision
Interior
- Kitchen: Dishwasher; Electric range; Oven; Disposal
- Bedrooms: Primary bedroom on the first floor (13x14); Bedroom on the first floor (12x12); Bedroom on the first floor (12x11)
- Flooring: Carpet; Tile
- Bathrooms: 2 full bathrooms
- Heating & cooling: Central heating (gas); Central electric air conditioning
- Interior features: Ceiling fans
- Laundry & utility: Washer hookup; Electric dryer hookup; Gas dryer hookup
Neighborhood map
What this means for you Summary
Snapshot
- This is a 3-bed/2.0-bath single-family listed at $155k.
Deal economics
- At list price, monthly cash flow is $110 ($1k/yr) — positive.
- The deal already cash-flows at list — no discount required.
- Meets the 1% rule at list price ($2k rent vs $155k).
- Cap rate 7.1% vs local median 3.4% in Pasadena — top-decile yield for the area; either an underpriced asset or a hidden risk that comps aren't pricing in. Stress-test before assuming the spread holds.
Location & tenants
- Location reads 66/100 on livability (#600 in TX) — a middle-class / working-renter tenant base. Strengths: cost of living A+, housing A+; Watch: employment D+, crime F, amenities F.
- Pasadena ISD (suburban): math 29% / reading 32% proficiency, ranked #612 of 826 in TX (top 74%) — families likely to look elsewhere, expect single-tenant / working-renter base with shorter leases; 71% free/reduced lunch — lower-income household profile, screen leases tightly.
- Zoned schools: Mae Smythe El (math 19% / reading 20%, grade F, #3,583 of 4,322 statewide, top 86%, 700 students, 92% FRL); Bobby Shaw Middle (math 19% / reading 20%, grade F, #1,445 of 1,662 statewide, top 88%, 692 students, 95% FRL); Sam Rayburn H S (math 52% / reading 36%, grade F, #697 of 1,632 statewide, top 43%, 2,645 students, 86% FRL) — zoned schools average 91% FRL vs 71% district-wide (20 pts higher); higher-poverty schools than district average — tighter screening recommended.
- Market conditions: 99 active listings in the ZIP; 10 comparable units currently listed for rent nearby; rentals leasing fast (median 6d on market — plan ~1-2 weeks tenant-placement turnaround); 29,883 units permitted in Harris County in 2024 (8,621 in 5+ unit buildings).
- This rent runs 33% of the median local income ($62k/yr) — at the standard rent-burdened threshold; future hikes will face affordability resistance.
Forward outlook
- Local home prices are declining (-3.0%/yr); year-one equity from $1k of loan paydown is wiped out by about $5k of value loss. Plan a longer hold.
- Harris County population projected at +47% by 2050 — long-run rental-demand tailwind backs the buy-and-hold thesis.
Negotiation context
- Only 8 days on market — expect competitive offers; lowballing is unlikely to land.
- 2 sale attempts with the ask held roughly flat each time — persistent listings suggest the price (not the market) is what's stuck; bring a comps-based counter.
Risks & watch-outs
- Watch-outs: property tax is 2.7% of price.
- Climate carrying-cost: severe wind risk, 99% chance of damaging wind over 30y; extreme-heat days projected 7→24/yr by 2055 (HVAC capex compounding) — expect insurance premiums to compound above CPI over the hold.
Questions for the listing agent
- Built in 1960 — when were the roof, HVAC, electrical panel, plumbing, and water heater last replaced?
- Property tax is high relative to price — has the assessment been appealed recently, and will the sale trigger a re-assessment?
- Is there a deadline driving the sale (1031 exchange, divorce, estate, relocation)? That informs how much negotiation room exists.
- Schools are D-rated, which usually means shorter tenancies and higher turnover. Who's the typical renter profile here, and what's been the actual vacancy rate?
- Crime grade is F in this area — have there been break-ins, vandalism, or insurance claims at this property in the last 3 years? What carrier currently insures it and at what premium?
- What's the average days-on-market for RENTAL listings here right now (not sales)? A rising rental-DOM trend means longer vacancies and softer asking-rent achievability than the comps imply.
- What's the recent tenant-quality profile in this submarket — average credit score on applications, eviction rate, late-payment / NSF rate, and stable-employment percentage? A property-management company in the area should have these aggregated.
- How much new for-sale + rental construction is in the pipeline within 1–3 miles? Heavy new supply typically softens prices + rents 12–24 months out; constrained supply supports both.
Investment metrics
- 1% rule
- 1.10% ✓
- Cap rate
- 7.15%
- Cash-on-cash
- 3.05%
- DSCR
- 1.14
- GRM
- 7.6
CMA / ARV
- ARV (median comp)
- $233,941
- List price
- $155,000
- Delta
- -33.74%
- Verdict
- UNDERPRICED
- Comps
- 20 within 1.0 mi
Show comp detail 12 sales within ~0.75 mi
| Address | Dist | Beds/Ba | Sqft | Sold | Price | $/sf | Match |
|---|---|---|---|---|---|---|---|
| 1807 Marlock Ln | 0.07mi | 3/2.0 | 1,693 (+9%) | 4mo | $239,900 | $142 | 78 |
| 1607 Zapp Ln Ln | 0.14mi | 3/2.0 | 1,441 (-7%) | 5mo | $180,000 | $125 | 78 |
| 1605 Marlock Ln | 0.11mi | 3/2.0 | 1,365 (-12%) | 2mo | $177,000 | $130 | 74 |
| 1312 Leneva Ln | 0.35mi | 4/2.5 (+1) | 1,633 (+6%) | 1mo | $269,999 | $165 | 66 |
| 2120 Chestnut Ln | 0.45mi | 3/2.0 | 1,409 (-9%) | 1mo | $239,995 | $170 | 63 |
| 1407 Marlock Ln | 0.29mi | 4/2.0 (+1) | 1,713 (+11%) | 8mo | $209,900 | $123 | 57 |
| 2214 Purdue St | 0.57mi | 4/3.0 (+1) | 1,600 (+3%) | 3mo | $245,900 | $154 | 56 |
| 1905 Concord Rd | 0.38mi | 3/1.5 | 1,325 (-14%) | 1mo | $232,000 | $175 | 55 |
| 2910 Rose St | 0.67mi | 3/2.0 | 1,410 (-9%) | 0mo | $220,000 | $156 | 54 |
| 2607 Easy St | 0.36mi | 4/2.0 (+1) | 1,765 (+14%) | 8mo | $280,000 | $159 | 48 |
| 2611 Prairie Ave | 0.63mi | 3/1.0 | 1,384 (-10%) | 1mo | $225,000 | $163 | 48 |
| 2204 Chestnut Ln | 0.51mi | 4/2.0 (+1) | 1,728 (+12%) | 8mo | $165,900 | $96 | 46 |
Match score weights: distance 35% · size 25% · config 20% · recency 20%. Top-matched comps best support the ARV.
Projected returns pro-forma
-3.0% appreciation · 3.0% rent growth · sell at horizon
- IRR
- -11.4%
- Equity multiple
- 0.59×
- Total profit
- $-17,969
- Equity at exit
- $23,111
- IRR
- -2.1%
- Equity multiple
- 0.86×
- Total profit
- $-6,100
- Equity at exit
- $13,402
Cash invested: $43,400 (down + closing). Projections, not guarantees.
Landlord ↔ Tenant lean methodology
- Overall (STATE)
- 87 Strongly Landlord-Friendly
- State Texas
- 87 Strongly Landlord-Friendly · R+5
- County
- — inherits STATE
- City
- — inherits STATE
ZIP-level market 77502
- Home prices YoY
- -14.2%
- Active inventory
- 99
- Price-to-rent
- 7.6×
Monthly cashflow live
- Estimated rent
- $1,698 high interval (Pro) →
- Mortgage (P&I)
- −$813
- Tax from tax record
- −$354 /mo · $4,247/yr
- Insurance
- −$65
- HOA
- −$0
- Vacancy / Maint / Mgmt
- −$357
- Net cashflow
- $110
Break-even live
Sensitivity live
| Price | -10% $198 | -5% $154 | +0% $110 | +5% $66 | +10% $23 |
|---|---|---|---|---|---|
| Rent | -10% $-24 | -5% $43 | +0% $110 | +5% $177 | +10% $244 |
| Rate | -1.0pp $188 | -0.5pp $150 | base $110 | +0.5pp $70 | +1.0pp $29 |
UW: 25.0% down · 7.5% · 30yr · 1.5% tax · 5.0% vac · 8.0% maint · 8.0% mgmt
Financing live
Cash to close
- Down payment
- $38,750
- Closing costs
- $4,650
- Reserves months
- —
- Total cash needed
- —
Loan-product check · same deal, 3 products live
Conventional
25% down · 7.5% · 30yr
- Down + closing
- —
- Monthly P&I
- —
- Monthly cashflow
- —
- DSCR
- —
- Eligible?
- —
Personal DTI + credit; lowest rate.
DSCR
20% down · 8.5% · 30yr
- Down + closing
- —
- Monthly P&I
- —
- Monthly cashflow
- —
- DSCR
- —
- Eligible?
- —
No personal income docs; deal must DSCR.
Hard money
10% down · 12.0% · 12mo
- Down + closing
- —
- Monthly P&I
- —
- Monthly cashflow
- —
- DSCR
- —
- Eligible?
- —
Short-term bridge; refi at stabilization.
Rent comps 10 comps
| Address | Beds | Baths | Sqft | Rent | $/sqft | DOM | Units | Dist |
|---|---|---|---|---|---|---|---|---|
| 2001 Burke Rd Pasadena, TX | 1.0–3.0 | 1.0–1.5 | 989 | $1,479 | $1.50 | 2d | 6 | 0.22mi |
| 2513 Leslie St Pasadena, TX | 3.0 | 2.0 | 1849 | $1,895 | $1.02 | 3d | 1 | 0.33mi |
| 2320 Cherry Brook Ln Apt 510 Pasadena, TX | 3.0 | 2.0 | 1209 | $1,167 | $0.97 | 3d | 1 | 0.69mi |
| 1118 Madison Ave Pasadena, TX | 3.0 | 2.0 | 1653 | $1,700 | $1.03 | 44d | 1 | 0.95mi |
| 719 Burke Rd Pasadena, TX | 3.0 | 2.0 | 1158 | $2,000 | $1.73 | 5d | 1 | 1.09mi |
| 707 Preston Ave Pasadena, TX | 3.0 | 2.0 | 1250 | $1,089 | $0.87 | 22d | 1 | 1.11mi |
| 1307 Camden Rd Pasadena, TX | 3.0 | 1.5 | 1170 | $1,585 | $1.35 | 6d | 1 | 1.15mi |
| 3500 Red Bluff Rd Pasadena, TX | 1.0–3.0 | 1.0–2.0 | 936 | $1,699 | $1.82 | 2d | 81 | 1.22mi |
| 1110 Parkside Dr Pasadena, TX | 2.0 | 2.0 | 1120 | $1,167 | $1.04 | 44d | 1 | 1.45mi |
| 3119 Chestershire Dr Pasadena, TX | 3.0 | 1.0 | 1081 | $1,625 | $1.50 | 44d | 1 | 1.46mi |
Listing history 6 events
-
2026-05-06status Pending 773-char remark
-
2026-04-28$155,000 Active 773-char remark
-
2026-04-16historical $1,899
-
2026-04-04$1,899
-
2008-05-28soldstatus
-
1988-01-02soldstatus
ⓘ Source: listings_history table (triggers on properties + properties_extension) + one-shot
backfill from property_details.listing_events for pre-trigger history.
Tax reassessment forecast TX · Resets to sale price
- Current annual tax
- $4,247 · $354/mo
- Projected year-2 tax
- $4,247 · $354/mo
- Expected delta
- $0/yr ($0/mo · 0.0%)
ⓘ Screening estimate from a state-policy table — verify with the county assessor before closing.
Climate risk First Street
- Flood 1/10 Low FEMA zone X (unshaded) · 0% chance over 30 yrs
- Wildfire 1/10 Low
- Heat 10/10 Extreme 7 d/yr ≥109°F today · 24 d/yr by 30 yrs out
- Wind 9/10 Extreme 99% chance of damaging wind over 30 yrs
- Air quality 2/10 Low 2 unhealthy d/yr today · 2 by 30 yrs out
Nearby sold comps map
Loading sold comps map…
Walkable amenities ~0.75 mi
Loading nearby amenities…
Taxation est. · year 1
- Rental income
- $20,378
- − Mortgage interest
- −$8,682
- − Property taxes
- −$4,247
- − Insurance
- −$775
- − Repairs & maintenance
- −$1,630
- − Management
- −$1,630
- − Depreciation
- −$4,509
- Taxable loss
- −$1,095
- Est. tax savings @ 24.0%
- +$263
- After-tax cash flow
- $1,586/yr
For passive investors: Depreciation is non-cash, so a rental often shows a tax loss while cash-flowing — sheltering income. Rental losses are passive: they offset passive income freely, and up to $25,000/yr can offset ordinary (W-2) income if you actively participate and your MAGI is under $100k (phasing out to $0 by $150k); unused losses carry forward. On sale, claimed depreciation is recaptured at up to 25%, and gains may owe capital-gains tax (a 1031 exchange can defer both). Figures are a year-1 estimate at your 24.0% rate — not tax advice; consult a CPA.
Schools (NCES district)
- District
- Pasadena ISD
- NCES district ID
- 4834320
- Math proficiency
- 29% ▼ -17.00%
- Reading proficiency
- 32% ▼ -9.00%
- Median HH income
- $45,163
- Composite
- 26.15/100
- National rank
- #7275
- State rank
- #612 of 826 in TX
Livability — Pasadena
- Score
- 66/100
- State rank
- #600
- US rank
- #11438
Category grades
Schools grade is shown separately in the Schools card above.
Census & demographics
- Census place
- Pasadena, TX
- County
- Harris County · 4,702,590 people
- City population
- 109,190
- Metro
- Houston-The Woodlands-Sugar Land, TX
- Population (ZIP)
- 36,371
- Household income
- $62,500
- Rent vs Own
- Severe rent burden
- 1285.0
Population outlook (Harris County) Hauer SSP2
- Today (2025)
- 5,571,493 people
- By 2030
- 6,089,821 · +9.3%
- By 2040
- 7,142,806 · +28.2%
- By 2050
- 8,185,864 · +46.9%
- By 2075
- 10,574,329 · +89.8%
- By 2100
- 12,109,958 · +117.4%
Race, ethnicity, and origin ACS 2023
- Neighborhood character
- Predominantly Hispanic (83%)
- Race & ethnicity
- Hispanic / Latino 83% Two or more races 37% White 12% Black 4%
- Hispanic origin (detail)
- Mexican 75% Puerto Rican 1% Cuban 2%
- Common ancestry
- Italian 1%
- Foreign-born
- 30% · Canada
- Languages at home
- 40% English-only · Spanish 60%
Political lean MEDSL · Harris
- 2024 margin
- Lean D (+5.5) · D 52.0% · R 46.4% · Other 1.6%
- 2008→2024 swing
- +3.9pp toward D · 2008: 1.6pp · 2024: 5.5pp
- All cycles
- 2024: D+5.5 2020: D+13.3 2016: D+12.4 2012: D+0.1 2008: D+1.6
Not yet ingested
- Civics
- —
Market trends
- HPI YoY
- ▼ -46.12%
- Current HPI
- 278.9293
- Rent YoY
- —
- Metro
- Houston-The Woodlands-Sugar Land, TX
- State GDP YoY
- ▲ 3.95%
- F500 in state
- 110
Industry mix (Fortune 500 HQ in TX)
| Industry | F500 HQs | Revenue |
|---|---|---|
| Energy | 16 | $1,198B |
|
||
| Technology | 5 | $198B |
|
||
| Engineering / Construction | 4 | $72B |
|
||
| Energy Services | 3 | $60B |
|
||
| Utilities | 3 | $41B |
|
||
| Healthcare | 2 | $330B |
|
||
Price history
+8062.2% since first listed7 events — show timeline
- 2026-06-18 Sold (MLS) — HARMLS
- 2026-05-06 Pending — HARMLS
- 2026-04-28 Listed $155,000 HARMLS
- 2026-04-16 Rental Removed $1,899 Tricon
- 2026-04-04 Listed for Rent $1,899 Tricon
- 2008-05-28 Sold (Public Records) — Public Records
- 1988-01-02 Sold (Public Records) — Public Records
Property tax history
+2.0%/yrLatest (2025): $4,247 · +0.8% YoY. Source: county tax records.
Cash-flow waterfall
monthlySold comps — $/sqft
last 12 mo · ≤1 miLoading sold comps…