2236 Par Ln · Richmond, TX
Flood risk 6/10 · Moderate
- FEMA flood zone
- X
- Chance of flooding over 30 yrs
- 0.72%
- Est. flood insurance / yr
- $507 – $1,088
Fire risk 3/10 · Minor
- Est. fire insurance / yr
- $1,222 – $2,270
Heat risk 9/10 · Severe
- Hot days now (above 110°F)
- 7 days/yr
- Hot days in 30 yrs
- 23 days/yr
Wind risk 9/10 · Severe
- Chance of severe wind over 30 yrs
- 99.0%
Air-quality risk 2/10 · Minimal
- Unhealthy air days now
- 1 days/yr
- Unhealthy air days in 30 yrs
- 1 days/yr
Risk factors via First Street. Map © Google.
Why this score? — see what drove the B grade
The composite is a weighted blend of 9 inputs, each scored 0–100. Each bar is that input's sub-score; the figure is the points it added to the 100-point composite (weight × sub-score).
- Cash flow +26.5/30.0
- ARV discount +15.0/15.0
- DSCR +9.0/10.0
- 1% rule +8.7/10.0
- Schools +4.6/10.0
- Livability +3.5/5.0
- Condition / age +2.5/5.0
- Rent growth +2.0/5.0
- Appreciation +0.0/10.0
$170,000
🖨 Deal sheet 📄 Offer letter ✓ Due diligence
Listing remarks
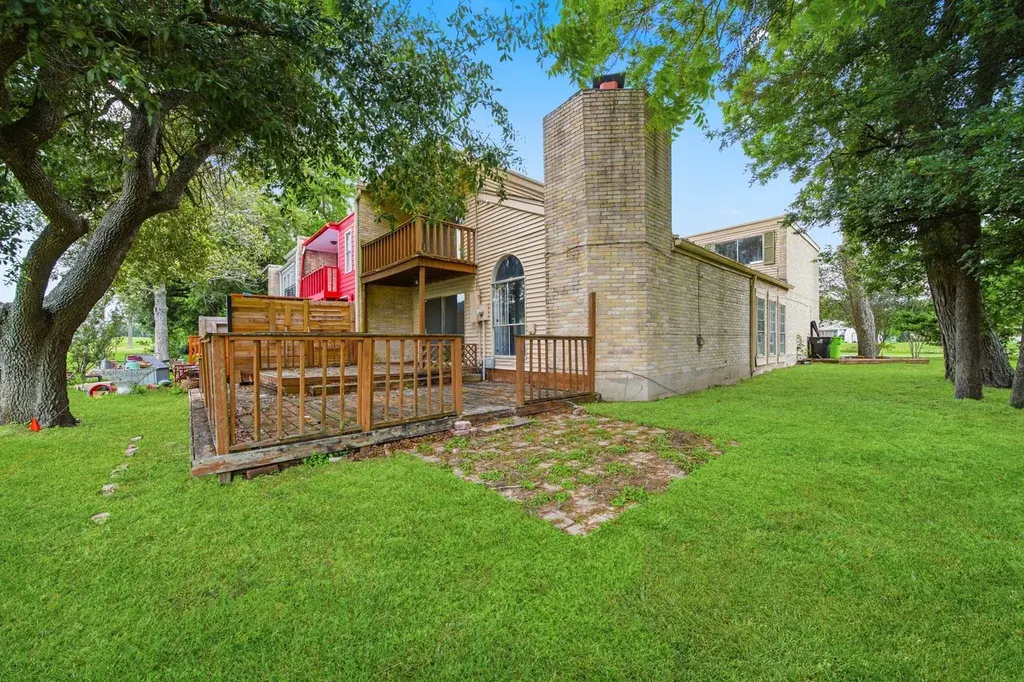
Opportunity is knocking with this spacious 4 bed, 2.5 bath townhome full of character and potential! Featuring soaring high ceilings, exposed brick, a cozy brick fireplace, sun-filled living spaces, and a bright sunroom, this home just needs a little TLC to truly shine. All bedrooms offer walk-in closets, plus major updates include 2 AC units replaced in 2023. Per previous sellers, the composition roof was replaced in 2018 and the flat roof area in 2020. Step outside to a great back deck with no back neighbors, overlooking the greenbelt with a park just across the way! Tons of sunlight, tons of opportunity, and tons of potential in a fantastic location! Sold AS IS.
Key facts
- Exposed brick
- Brick fireplace
- Walk-in closets
Tags
Property features AI
Finance
- HOA & community: Golfcrest Association with a $40 monthly fee covering common areas
Exterior
- Parking: Attached garage (1 car)
- Utilities: Public water; Public sewer
- Home design: Residential property; Two stories; Built in 1975; Slab foundation
- Construction: Brick and cement siding construction; Composition roof; Slab foundation; Built in 1975
- Exterior features: Composition roof; Brick and cement siding exterior; Lot approximately 1,782 square feet
Interior
- Bathrooms: Two full bathrooms; One half bathroom
- Heating & cooling: Central heating (gas); Central electric air conditioning
- Interior features: Two fireplaces; Four total rooms
Neighborhood map
What this means for you Summary
Snapshot
- This is a 3-bed/2.0-bath townhouse listed at $170k.
Deal economics
- At list price, monthly cash flow is $448 ($5k/yr) — positive.
- The deal already cash-flows at list — no discount required.
- Meets the 1% rule at list price ($2k rent vs $170k).
- Cap rate 9.5% vs local median 2.6% in Richmond — top-decile yield for the area; either an underpriced asset or a hidden risk that comps aren't pricing in. Stress-test before assuming the spread holds.
Location & tenants
- Location reads 70/100 on livability (#363 in TX) — a middle-class / working-renter tenant base. Strengths: cost of living A+, housing A+, health & safety B+; Watch: schools C-, crime C-, amenities F.
- Lamar CISD (suburban): math 50% / reading 53% proficiency, ranked #116 of 826 in TX (top 14%) — acceptable for families but not a draw, mixed tenant base, ~2y average lease.
- Market conditions: Rents soft (-1.8%/yr); 1332 active listings in the ZIP; 6 comparable units currently listed for rent nearby; rentals at typical pace (median 25d on market — plan ~3-4 weeks tenant-placement turnaround); solid renter incomes; 12,093 units permitted in Fort Bend County in 2024 (815 in 5+ unit buildings).
Forward outlook
- Local home prices are declining (-3.0%/yr); year-one equity from $1k of loan paydown is wiped out by about $5k of value loss. Plan a longer hold.
- Fort Bend County population projected at +75% by 2050 — long-run rental-demand tailwind backs the buy-and-hold thesis.
Negotiation context
- Only 8 days on market — expect competitive offers; lowballing is unlikely to land.
- 10 sale attempts since 3y ago with the ask held roughly flat each time — persistent listings suggest the price (not the market) is what's stuck; bring a comps-based counter.
Risks & watch-outs
- Watch-outs: property tax is 2.8% of price.
- Climate carrying-cost: major flood risk; severe wind risk, 99% chance of damaging wind over 30y; extreme-heat days projected 7→23/yr by 2055 (HVAC capex compounding) — expect insurance premiums to compound above CPI over the hold.
Questions for the listing agent
- Built in 1975 — when were the roof, HVAC, electrical panel, plumbing, and water heater last replaced?
- Property tax is high relative to price — has the assessment been appealed recently, and will the sale trigger a re-assessment?
- What does the HOA fee cover, when was the last increase, and are there any pending special assessments or reserve-fund shortfalls?
- Is there a deadline driving the sale (1031 exchange, divorce, estate, relocation)? That informs how much negotiation room exists.
- What's the average days-on-market for RENTAL listings here right now (not sales)? A rising rental-DOM trend means longer vacancies and softer asking-rent achievability than the comps imply.
- What's the recent tenant-quality profile in this submarket — average credit score on applications, eviction rate, late-payment / NSF rate, and stable-employment percentage? A property-management company in the area should have these aggregated.
- How much new for-sale + rental construction is in the pipeline within 1–3 miles? Heavy new supply typically softens prices + rents 12–24 months out; constrained supply supports both.
Investment metrics
- 1% rule
- 1.37% ✓
- Cap rate
- 9.45%
- Cash-on-cash
- 11.28%
- DSCR
- 1.50
- GRM
- 6.1
CMA / ARV
- ARV (median comp)
- $311,338
- List price
- $170,000
- Delta
- -45.40%
- Verdict
- UNDERPRICED
- Comps
- 20 within 1.0 mi
Show comp detail 1 sale within ~0.75 mi
| Address | Dist | Beds/Ba | Sqft | Sold | Price | $/sf | Match |
|---|---|---|---|---|---|---|---|
| 2242 Par Ln | 0.02mi | 3/2.5 | 1,772 (-13%) | 13mo | $180,000 | $102 | 64 |
Match score weights: distance 35% · size 25% · config 20% · recency 20%. Top-matched comps best support the ARV.
Projected returns pro-forma
-3.0% appreciation · 0.0% rent growth · sell at horizon
- IRR
- -3.3%
- Equity multiple
- 0.88×
- Total profit
- $-5,708
- Equity at exit
- $25,348
- IRR
- 2.1%
- Equity multiple
- 1.13×
- Total profit
- $6,008
- Equity at exit
- $14,698
Cash invested: $47,600 (down + closing). Projections, not guarantees.
Landlord ↔ Tenant lean methodology
- Overall (STATE)
- 87 Strongly Landlord-Friendly
- State Texas
- 87 Strongly Landlord-Friendly · R+5
- County
- — inherits STATE
- City
- — inherits STATE
ZIP-level market 77469
- Home prices YoY
- -25.1%
- Rents YoY
- -1.8%
- Active inventory
- 1332
- Price-to-rent
- 6.1×
Monthly cashflow live
- Estimated rent
- $2,333 high interval (Pro) →
- Mortgage (P&I)
- −$891
- Tax from tax record
- −$393 /mo · $4,717/yr
- Insurance
- −$71
- HOA
- −$40
- Vacancy / Maint / Mgmt
- −$490
- Net cashflow
- $448
Break-even live
UW: 25.0% down · 7.5% · 30yr · 1.5% tax · 5.0% vac · 8.0% maint · 8.0% mgmt
Financing live
Cash to close
- Down payment
- $42,500
- Closing costs
- $5,100
- Reserves months
- —
- Total cash needed
- —
Loan-product check · same deal, 3 products live
Conventional
25% down · 7.5% · 30yr
- Down + closing
- —
- Monthly P&I
- —
- Monthly cashflow
- —
- DSCR
- —
- Eligible?
- —
Personal DTI + credit; lowest rate.
DSCR
20% down · 8.5% · 30yr
- Down + closing
- —
- Monthly P&I
- —
- Monthly cashflow
- —
- DSCR
- —
- Eligible?
- —
No personal income docs; deal must DSCR.
Hard money
10% down · 12.0% · 12mo
- Down + closing
- —
- Monthly P&I
- —
- Monthly cashflow
- —
- DSCR
- —
- Eligible?
- —
Short-term bridge; refi at stabilization.
Rent comps 6 comps
| Address | Beds | Baths | Sqft | Rent | $/sqft | DOM | Units | Dist |
|---|---|---|---|---|---|---|---|---|
| 23643 Gibson Forest Dr Richmond, TX | 4.0 | 2.5 | 1753 | $2,499 | $1.43 | 17d | 1 | 0.79mi |
| 1803 Cypress Dr Richmond, TX | 3.0 | 2.0 | 1601 | $1,875 | $1.17 | 24d | 1 | 0.93mi |
| 722 Riveredge Dr Richmond, TX | 3.0 | 3.0 | 2488 | $2,601 | $1.05 | 44d | 1 | 0.98mi |
| 1308 Wilson Dr Rosenberg, TX | 3.0 | 2.0 | 1835 | $2,171 | $1.18 | 44d | 1 | 1.15mi |
| 7404 Town Center Blvd Rosenberg, TX | 3.0 | 1.0–2.0 | 1078 | $1,989 | $1.85 | 3d | 24 | 1.15mi |
| 3101 Vista Dr Rosenberg, TX | 1.0–3.0 | 1.0–2.5 | 1080 | $2,053 | $1.90 | 3d | 19 | 1.17mi |
HOA detail
- Monthly dues
- $40 · $480/yr
Listing history 36 events
-
2026-06-18days on market $170,000 Active 8 DOM
-
2026-06-17days on market $170,000 Active 7 DOM
-
2026-06-16days on market $170,000 Active 6 DOM
-
2026-06-15days on market $170,000 Active 5 DOM
-
2026-06-13days on market $170,000 Active 3 DOM
-
2026-06-08statusdays on market $170,000 Active 31 DOM
-
2026-06-07statusdays on market $170,000 Active Under Contract 30 DOM
-
2026-06-04days on market $170,000 Active 27 DOM
-
2026-06-03days on market $170,000 Active 26 DOM
-
2026-06-02days on market $170,000 Active 25 DOM
-
2026-06-01days on market $170,000 Active 24 DOM
-
2026-05-31days on market $170,000 Active 23 DOM
-
2026-05-08$170,000 Active 673-char remark
-
2026-01-28historical
-
2025-07-09price $210,000
-
2025-07-09status Active
-
2025-06-24status Pending
-
2025-06-23status Pending
-
2025-06-10price $211,000
-
2025-03-19price $150,000
-
2025-03-18$150,000 Active
-
2025-03-18historical
-
2024-09-20$209,990 Active
-
2024-09-20historical
-
2024-08-20price $215,000
-
2024-08-07$219,000 Active
-
2024-08-07historical
-
2024-07-22$229,990 Active
-
2023-06-01soldstatus
-
2023-05-31soldstatus Sold
-
2023-04-28status Pending
-
2023-04-24status Option Pending
-
2023-04-21status Active
-
2023-04-17status Option Pending
-
2023-04-07$215,000 Active
-
2022-03-18soldstatus
ⓘ Source: listings_history table (triggers on properties + properties_extension) + one-shot
backfill from property_details.listing_events for pre-trigger history.
Tax reassessment forecast TX · Resets to sale price
- Current annual tax
- $4,717 · $393/mo
- Projected year-2 tax
- $4,717 · $393/mo
- Expected delta
- $0/yr ($0/mo · 0.0%)
ⓘ Screening estimate from a state-policy table — verify with the county assessor before closing.
Climate risk First Street
- Flood 6/10 Major FEMA zone X · 72% chance over 30 yrs
- Wildfire 3/10 Moderate
- Heat 9/10 Extreme 7 d/yr ≥110°F today · 23 d/yr by 30 yrs out
- Wind 9/10 Extreme 99% chance of damaging wind over 30 yrs
- Air quality 2/10 Low 1 unhealthy d/yr today · 1 by 30 yrs out
Nearby sold comps map
Loading sold comps map…
Walkable amenities ~0.75 mi
Loading nearby amenities…
Taxation est. · year 1
- Rental income
- $27,995
- − Mortgage interest
- −$9,523
- − Property taxes
- −$4,717
- − Insurance
- −$850
- − Repairs & maintenance
- −$2,240
- − Management
- −$2,240
- − HOA
- −$480
- − Depreciation
- −$4,945
- Taxable income
- $3,000
- Est. tax owed @ 24.0%
- −$720
- After-tax cash flow
- $4,651/yr
For passive investors: Depreciation is non-cash, so a rental often shows a tax loss while cash-flowing — sheltering income. Rental losses are passive: they offset passive income freely, and up to $25,000/yr can offset ordinary (W-2) income if you actively participate and your MAGI is under $100k (phasing out to $0 by $150k); unused losses carry forward. On sale, claimed depreciation is recaptured at up to 25%, and gains may owe capital-gains tax (a 1031 exchange can defer both). Figures are a year-1 estimate at your 24.0% rate — not tax advice; consult a CPA.
Schools (NCES district)
- District
- Lamar CISD
- NCES district ID
- 4826580
- Math proficiency
- 50% ▼ -12.00%
- Reading proficiency
- 53% ▼ -4.00%
- Median HH income
- $75,213
- Composite
- 46.43/100
- National rank
- #2452
- State rank
- #116 of 826 in TX
Livability — Richmond
- Score
- 70/100
- State rank
- #363
- US rank
- #7780
Category grades
Schools grade is shown separately in the Schools card above.
Census & demographics
- Census place
- Richmond, TX
- County
- Fort Bend County · 836,777 people
- City population
- 158,237
- Metro
- Houston-The Woodlands-Sugar Land, TX
- Population (ZIP)
- 69,826
- Household income
- $102,125
- Rent vs Own
- Severe rent burden
- 1292.0
Population outlook (Fort Bend County) Hauer SSP2
- Today (2025)
- 1,004,526 people
- By 2030
- 1,153,104 · +14.8%
- By 2040
- 1,453,718 · +44.7%
- By 2050
- 1,753,781 · +74.6%
- By 2075
- 2,455,772 · +144.5%
- By 2100
- 2,930,528 · +191.7%
Race, ethnicity, and origin ACS 2023
- Neighborhood character
- Highly diverse neighborhood (Simpson 0.76)
- Race & ethnicity
- Hispanic / Latino 29% White 27% Black 25% Two or more races 15% Asian 15%
- Hispanic origin (detail)
- Mexican 21%
- Common ancestry
- Romanian 1% Lithuanian 1%
- Foreign-born
- 24% · Canada, Vietnam, China
- Languages at home
- 65% English-only · Spanish 17% Other Indo-European 7% Other Asian/Pacific 2%
Political lean MEDSL · Fort Bend
- 2024 margin
- Toss-up / Even · D 49.5% · R 47.9% · Other 2.6%
- 2008→2024 swing
- +4.0pp toward D · 2008: -2.4pp · 2024: 1.6pp
- All cycles
- 2024: D+1.6 2020: D+10.6 2016: D+6.6 2012: R+6.8 2008: R+2.4
Not yet ingested
- Civics
- —
Market trends
- HPI YoY
- ▼ -78.66%
- Current HPI
- 234.9892
- Rent YoY
- ▼ -1.81%
- Metro
- Houston-The Woodlands-Sugar Land, TX
- State GDP YoY
- ▲ 3.95%
- F500 in state
- 110
Industry mix (Fortune 500 HQ in TX)
| Industry | F500 HQs | Revenue |
|---|---|---|
| Energy | 16 | $1,198B |
|
||
| Technology | 5 | $198B |
|
||
| Engineering / Construction | 4 | $72B |
|
||
| Energy Services | 3 | $60B |
|
||
| Utilities | 3 | $41B |
|
||
| Healthcare | 2 | $330B |
|
||
Price history
-20.9% since first listed28 events — show timeline
- 2026-06-10 Listed $170,000 HARMLS
- 2026-06-08 Relisted — HARMLS
- 2026-06-07 Listing Removed — HARMLS
- 2026-06-04 Contingent — HARMLS
- 2026-05-08 Listed $170,000 HARMLS
- 2026-01-28 Listing Removed — HARMLS
- 2025-07-09 Price Changed $210,000 HARMLS
- 2025-07-09 Relisted — HARMLS
- 2025-06-24 Pending — HARMLS
- 2025-06-23 Pending — HARMLS
- 2025-06-10 Price Changed $211,000 HARMLS
- 2025-03-19 Price Changed $150,000 HARMLS
- 2025-03-18 Listing Removed — HARMLS
- 2025-03-18 Listed $150,000 HARMLS
- 2024-09-20 Listing Removed — HARMLS
- 2024-09-20 Listed $209,990 HARMLS
- 2024-08-20 Price Changed $215,000 HARMLS
- 2024-08-07 Listing Removed — HARMLS
- 2024-08-07 Listed $219,000 HARMLS
- 2024-07-22 Listed $229,990 HARMLS
- 2023-06-01 Sold (Public Records) — Public Records
- 2023-05-31 Sold (MLS) — HARMLS
- 2023-04-28 Pending — HARMLS
- 2023-04-24 Pending — HARMLS
- 2023-04-21 Relisted — HARMLS
- 2023-04-17 Pending — HARMLS
- 2023-04-07 Listed $215,000 HARMLS
- 2022-03-18 Sold (Public Records) — Public Records
Property tax history
+4.9%/yrLatest (2025): $4,717 · -4.5% YoY. Source: county tax records.
Cash-flow waterfall
monthlySold comps — $/sqft
last 12 mo · ≤1 miLoading sold comps…