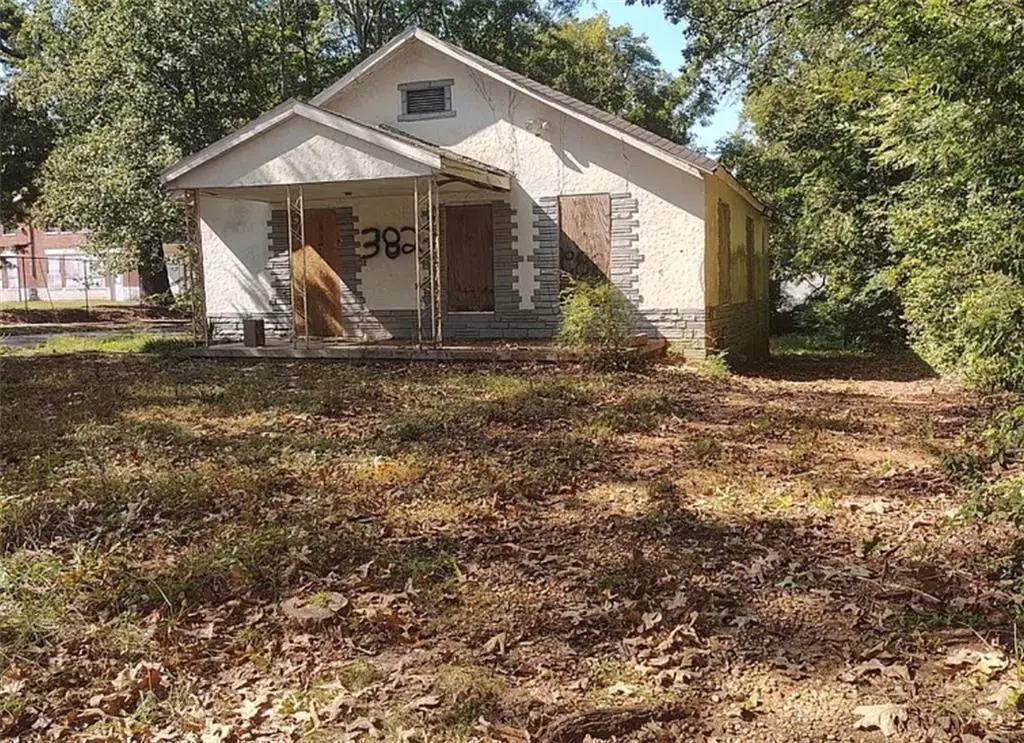
382 Southbend Ave · Atlanta, GA
Flood risk 1/10 · Minimal
- FEMA flood zone
- X (unshaded)
- Chance of flooding over 30 yrs
- 0.0%
- Est. flood insurance / yr
- $473 – $860
Fire risk 1/10 · Minimal
- Est. fire insurance / yr
- $963 – $1,789
Heat risk 5/10 · Moderate
- Hot days now (above 105°F)
- 7 days/yr
- Hot days in 30 yrs
- 18 days/yr
Wind risk 6/10 · Moderate
- Chance of severe wind over 30 yrs
- 27.0%
Air-quality risk 4/10 · Minor
- Unhealthy air days now
- 4 days/yr
- Unhealthy air days in 30 yrs
- 6 days/yr
Risk factors via First Street. Map © Google.
Why this score? — see what drove the B+ grade
The composite is a weighted blend of 9 inputs, each scored 0–100. Each bar is that input's sub-score; the figure is the points it added to the 100-point composite (weight × sub-score).
- Cash flow +30.0/30.0
- ARV discount +15.0/15.0
- DSCR +10.0/10.0
- 1% rule +9.2/10.0
- Livability +4.2/5.0
- Rent growth +3.3/5.0
- Schools +2.7/10.0
- Condition / age +2.5/5.0
- Appreciation +0.0/10.0
$125,000
🖨 Deal sheet 📄 Offer letter ✓ Due diligence
Listing remarks MLS
Don't miss this prime investment opportunity in the rapidly growing Lakewood Heights community! This property is a true blank canvas ready for your vision. ? Property Highlights: 2 Surveys Completed - saving you time and money 2 Sets of Architectural Plans included Preferred Builder Available to streamline your renovation or rebuild Renovation Ready with huge upside potential Located at 382 South Bend Ave SE, Atlanta, this property sits in a desirable and revitalizing neighborhood just minutes from Downtown Atlanta, the BeltLine, and Hartsfield-Jackson Airport. Whether you're looking for a fix-and-flip, long-term rental, or a custom dream home, this is your chance to capitalize on a solid deal in one of Atlanta's hottest investment zones.
Key facts
- 1 acre lot
- 2 parking spots
- Built 1980
Property features AI
Finance
- Other: Directions available; Road surface type: paved
- Financial info: Single-unit property in the community
- HOA & community: Association fee paid annually
Exterior
- Parking: Driveway with two parking spaces; Open parking available
- Utilities: Public water; Public sewer; Electric service with 220 volts; Cable, electricity, phone, sewer, and water available
- Home design: One-level home; Accessible features throughout including accessible bedroom, full bath, hallway(s), kitchen, kitchen appliances, and washer/dryer; Fee simple ownership; Property listed as fixer
- Construction: HardiPlank type siding, stucco, and vinyl siding; Shingle roof; Brick/mortar and pillar/post/pier foundation; Built with energy-efficient appliances, thermostat, water heater, and windows
- Exterior features: Covered patio/porch; Paved road frontage on a city street
Interior
- Kitchen: White cabinets; Eat-in kitchen; Kitchen island; Pantry; Dishwasher; Microwave; Refrigerator
- Bedrooms: Three bedrooms with the master on the main level
- Flooring: Laminate flooring
- Bathrooms: Two full bathrooms on the main level; Master bath with double vanity and separate tub/shower
- Heating & cooling: Central heating; Central air; Ceiling fans; Wall unit(s)
- Interior features: Crown molding; Double vanity in master bath; High 10-ft ceilings on main; Recessed lighting; Electric fireplace; Double-pane windows; 2+ common walls; Home theater
- Laundry & utility: Main-level laundry room; Washer and dryer included; Tankless water heater
Neighborhood map
What this means for you Summary
Snapshot
- This is a 2-bed/1.0-bath single-family listed at $125k.
Deal economics
- At list price, monthly cash flow is $540 ($6k/yr) — positive.
- The deal already cash-flows at list — no discount required.
- Meets the 1% rule at list price ($2k rent vs $125k).
- Recommended offer: $121k (3.0% below list) — sets the bar for market timing.
- Cap rate 11.5% vs local median 3.1% in Atlanta — top-decile yield for the area; either an underpriced asset or a hidden risk that comps aren't pricing in. Stress-test before assuming the spread holds.
Location & tenants
- Location reads 83/100 on livability (#6 in GA, #919 nationally) — a professional / high-income tenant draw. Strengths: amenities A+, commute A+, housing A+; Watch: cost of living C-.
- Atlanta Public Schools (urban): math 28% / reading 35% proficiency, ranked #80 of 174 in GA (top 46%) — families likely to look elsewhere, expect single-tenant / working-renter base with shorter leases; 71% free/reduced lunch — lower-income household profile, screen leases tightly.
- Zoned schools: South Atlanta High School (math 2% / reading 12%, grade F, #385 of 424 statewide, top 92%, 928 students, 100% FRL) — zoned schools average 100% FRL vs 71% district-wide (29 pts higher); higher-poverty schools than district average — tighter screening recommended.
- Zoned-school proficiency averages 7% at this address vs 32% district-wide (-24 pts) — the specific schools serving this property underperform the Atlanta Public Schools average; the district grade overstates school quality for this exact location.
- Market conditions: Rents rising (+3.2%/yr); 378 active listings in the ZIP; 40 comparable units currently listed for rent nearby; rentals at typical pace (median 19d on market — plan ~3-4 weeks tenant-placement turnaround); 11,565 units permitted in Fulton County in 2024 (8,159 in 5+ unit buildings).
- This rent runs 42% of the median local income ($51k/yr) — at the standard rent-burdened threshold; future hikes will face affordability resistance.
Forward outlook
- Local home prices are declining (-3.0%/yr); year-one equity from $864 of loan paydown is wiped out by about $4k of value loss. Plan a longer hold.
- Fulton County population projected at +38% by 2050 — long-run rental-demand tailwind backs the buy-and-hold thesis.
- At projected returns (-3.0% appreciation + 3.2% rent growth), your $35k cash investment doubles in ~7 years — after that, you're playing with house money.
Negotiation context
- It's been on market 45 days — a 3% lower offer ($121k) is reasonable based on typical stale-listing flexibility.
- 26 sale attempts since 8y ago with the ask held roughly flat each time — persistent listings suggest the price (not the market) is what's stuck; bring a comps-based counter.
Risks & watch-outs
- Climate carrying-cost: major wind risk, 27% chance of damaging wind over 30y; extreme-heat days projected 7→18/yr by 2055 (HVAC capex compounding) — expect insurance premiums to compound above CPI over the hold.
Questions for the listing agent
- It's been on market 45 days. Have you received any prior offers? Is the seller open to a 3% concession, seller financing, or rate buy-down credit?
- Is there a deadline driving the sale (1031 exchange, divorce, estate, relocation)? That informs how much negotiation room exists.
- What's the average days-on-market for RENTAL listings here right now (not sales)? A rising rental-DOM trend means longer vacancies and softer asking-rent achievability than the comps imply.
- What's the recent tenant-quality profile in this submarket — average credit score on applications, eviction rate, late-payment / NSF rate, and stable-employment percentage? A property-management company in the area should have these aggregated.
- How much new for-sale + rental construction is in the pipeline within 1–3 miles? Heavy new supply typically softens prices + rents 12–24 months out; constrained supply supports both.
Investment metrics
- 1% rule
- 1.42% ✓
- Cap rate
- 11.48%
- Cash-on-cash
- 18.51%
- DSCR
- 1.82
- GRM
- 5.9
CMA / ARV
- ARV (median comp)
- $232,500
- List price
- $125,000
- Delta
- -46.24%
- Verdict
- UNDERPRICED
- Comps
- 20 within 1.0 mi
Show comp detail 12 sales within ~0.75 mi
| Address | Dist | Beds/Ba | Sqft | Sold | Price | $/sf | Match |
|---|---|---|---|---|---|---|---|
| 1825 Shadydale Ave SE | 0.52mi | 3/1.5 (+1) | 1,046 (0%) | 0mo | $155,000 | $148 | 68 |
| 5 Adair Ave SE | 0.68mi | 3/1.0 (+1) | 1,032 (-1%) | 4mo | $140,000 | $136 | 57 |
| 1688 Oak Knoll Cir SE | 0.31mi | 3/2.0 (+1) | 1,160 (+11%) | 2mo | $295,000 | $254 | 57 |
| 1970 Compton Dr SE | 0.50mi | 3/2.0 (+1) | 1,000 (-4%) | 5mo | $239,500 | $240 | 56 |
| 366 Wyndham Way SE | 0.46mi | 3/1.0 (+1) | 1,147 (+10%) | 2mo | $187,000 | $163 | 56 |
| 209 Harper Rd SE | 0.68mi | 3/2.0 (+1) | 1,059 (+1%) | 2mo | $253,000 | $239 | 56 |
| 1591 Jonesboro Rd SE | 0.38mi | 2/1.0 | 1,175 (+12%) | 8mo | $214,900 | $183 | 55 |
| 710 Thomasville Blvd SE | 0.64mi | 3/2.0 (+1) | 1,084 (+4%) | 0mo | $213,000 | $196 | 55 |
| 1101 Oak Knoll Ter SE | 0.23mi | 3/2.0 (+1) | 901 (-14%) | 4mo | $165,000 | $183 | 54 |
| 172 Meador Way SE | 0.61mi | 3/2.0 (+1) | 1,000 (-4%) | 3mo | $138,900 | $139 | 52 |
| 1864 Shadydale Ave SE | 0.51mi | 3/2.0 (+1) | 1,184 (+13%) | 4mo | $259,900 | $220 | 42 |
| 1926 Lakewood Ter SE | 0.42mi | 3/2.0 (+1) | 1,200 (+15%) | 8mo | $220,000 | $183 | 40 |
Match score weights: distance 35% · size 25% · config 20% · recency 20%. Top-matched comps best support the ARV.
Projected returns pro-forma
-3.0% appreciation · 3.23% rent growth · sell at horizon
- IRR
- 10.5%
- Equity multiple
- 1.42×
- Total profit
- $14,563
- Equity at exit
- $18,638
- IRR
- 19.8%
- Equity multiple
- 2.68×
- Total profit
- $58,754
- Equity at exit
- $10,808
Cash invested: $35,000 (down + closing). Projections, not guarantees.
Landlord ↔ Tenant lean methodology
- Overall (STATE)
- 90 Strongly Landlord-Friendly
- State Georgia
- 90 Strongly Landlord-Friendly · R+3
- County
- — inherits STATE
- City
- — inherits STATE
ZIP-level market 30315
- Rents YoY
- 3.2%
- Active inventory
- 378
- Price-to-rent
- 5.9×
Monthly cashflow live
- Estimated rent
- $1,775 high interval (Pro) →
- Mortgage (P&I)
- −$656
- Tax from tax record
- −$155 /mo · $1,856/yr
- Insurance
- −$52
- HOA
- −$0
- Vacancy / Maint / Mgmt
- −$373
- Net cashflow
- $540
Break-even live
UW: 25.0% down · 7.5% · 30yr · 1.5% tax · 5.0% vac · 8.0% maint · 8.0% mgmt
Financing live
Cash to close
- Down payment
- $31,250
- Closing costs
- $3,750
- Reserves months
- —
- Total cash needed
- —
Loan-product check · same deal, 3 products live
Conventional
25% down · 7.5% · 30yr
- Down + closing
- —
- Monthly P&I
- —
- Monthly cashflow
- —
- DSCR
- —
- Eligible?
- —
Personal DTI + credit; lowest rate.
DSCR
20% down · 8.5% · 30yr
- Down + closing
- —
- Monthly P&I
- —
- Monthly cashflow
- —
- DSCR
- —
- Eligible?
- —
No personal income docs; deal must DSCR.
Hard money
10% down · 12.0% · 12mo
- Down + closing
- —
- Monthly P&I
- —
- Monthly cashflow
- —
- DSCR
- —
- Eligible?
- —
Short-term bridge; refi at stabilization.
Rent comps 40 comps
| Address | Beds | Baths | Sqft | Rent | $/sqft | DOM | Units | Dist |
|---|---|---|---|---|---|---|---|---|
| 1770 Richmond Cir SE Unit 500F Atlanta, GA | 2.0 | 2.0 | 1200 | $1,750 | $1.46 | 24d | 1 | 0.12mi |
| 1770 Richmond Cir SE Unit 1000E Atlanta, GA | 2.0 | 2.0 | 1200 | $1,365 | $1.14 | 24d | 1 | 0.12mi |
| 1754 Richmond Cir SE Atlanta, GA | 2.0 | 2.0 | 1200 | $1,750 | $1.46 | 8d | 2 | 0.16mi |
| 340 Adelle St SE Atlanta, GA | 3.0 | 1.0 | 1122 | $1,500 | $1.34 | 3d | 1 | 0.29mi |
| 1875 Conrad Ave SE Atlanta, GA | 3.0 | 2.0 | 1088 | $1,803 | $1.66 | 22d | 1 | 0.37mi |
| 2087 Lakewood Trl SE Atlanta, GA | 3.0 | 2.5 | 1056 | $2,256 | $2.14 | 24d | 1 | 0.42mi |
| 2085 Browns Mill Rd SE Atlanta, GA | 1.0 | 1.0 | 1200 | $695 | $0.58 | 24d | 1 | 0.54mi |
| 51 Bowen Ave SE Atlanta, GA | 1.0 | 1.0 | 800 | $1,025 | $1.28 | 2d | 1 | 0.55mi |
| 172 Meador Way SE Atlanta, GA | 3.0 | 2.0 | 1100 | $1,950 | $1.77 | 24d | 1 | 0.60mi |
| 52 Claire Dr SE Atlanta, GA | 2.0 | 2.0 | 800 | $1,750 | $2.19 | 19d | 1 | 0.60mi |
| 1515 Jonesboro Rd SE Atlanta, GA | 3.0 | 2.0 | 1360 | $2,300 | $1.69 | 13d | 1 | 0.68mi |
| 402 McDonough Blvd SE Atlanta, GA | 3.0 | 3.5 | 1270 | $2,350 | $1.85 | 24d | 1 | 0.70mi |
| 386 Lindsey Dr SE Atlanta, GA | 3.0 | 1.0 | 1040 | $1,808 | $1.74 | 15d | 1 | 0.70mi |
| 76 Schell Rd SE Atlanta, GA | 3.0 | 1.0 | 1080 | $1,623 | $1.50 | 24d | 1 | 0.72mi |
| 1455 Jonesboro Rd SE Atlanta, GA | 2.0 | 1.0 | 700 | $2,000 | $2.86 | 24d | 1 | 0.80mi |
| 95 Thirkield Ave SE Atlanta, GA | 3.0 | 2.0 | 1096 | $1,850 | $1.69 | 16d | 1 | 0.84mi |
| 91 Thirkield Ave SE Atlanta, GA | 2.0 | 1.0 | 1092 | $1,995 | $1.83 | 24d | 1 | 0.84mi |
| 117 Thayer Ave SE Atlanta, GA | 3.0 | 1.0 | 1241 | $1,666 | $1.34 | 14d | 1 | 0.87mi |
| 2255 Rhinehill Rd SE Atlanta, GA | 1.0 | 1.0 | 1482 | $638 | $0.43 | 8d | 1 | 0.87mi |
| 752 McDonough Blvd SE Atlanta, GA | 3.0 | 2.0 | 1120 | $1,895 | $1.69 | 24d | 1 | 0.90mi |
| 672 Cassanova St SE Unit A Atlanta, GA | 1.0 | 1.0 | 1045 | $2,000 | $1.91 | 2d | 1 | 0.95mi |
| 672 Cassanova St SE Unit A Atlanta, GA | 1.0 | 1.0 | 1025 | $2,000 | $1.95 | 18d | 1 | 0.95mi |
| 672 Cassanova St SE Unit B Atlanta, GA | 2.0 | 1.5 | 1245 | $2,300 | $1.85 | 18d | 1 | 0.95mi |
| 1389 Cozy Ct SE Atlanta, GA | 1.0 | 1.0 | 1500 | $1,350 | $0.90 | 24d | 1 | 0.98mi |
| 1389 Cozy Ct SE Atlanta, GA | 1.0 | 1.0 | 1500 | $1,350 | $0.90 | 5d | 1 | 0.98mi |
| 1394 Cozy Cir SE Atlanta, GA | 3.0 | 3.0 | 1500 | $2,850 | $1.90 | 14d | 1 | 0.98mi |
| 141 McDonough Blvd SE Atlanta, GA | 3.0 | 2.0 | 1242 | $2,250 | $1.81 | 24d | 1 | 1.01mi |
| 2145 Macon Dr SW Atlanta, GA | 3.0 | 1.0 | 1059 | $1,450 | $1.37 | 24d | 1 | 1.03mi |
| 73 Polar Rock Rd SW Atlanta, GA | 3.0 | 1.0 | 1098 | $1,850 | $1.68 | 10d | 1 | 1.04mi |
| 1267 Zucchini Cir SE Atlanta, GA | 3.0 | 3.0 | 1500 | $3,800 | $2.53 | 24d | 1 | 1.07mi |
| 1267 Zucchini Cir SE Atlanta, GA | 3.0 | 3.0 | 1500 | $3,300 | $2.20 | 8d | 1 | 1.07mi |
| 1940 Fisher Rd SE Atlanta, GA | 2.0 | 1.0 | 760 | $1,300 | $1.71 | 24d | 1 | 1.09mi |
| 250 Amal Dr SW #7009 Atlanta, GA | 3.0 | 2.5 | 1440 | $1,850 | $1.28 | 8d | 1 | 1.10mi |
| 972 Welch St SE Atlanta, GA | 3.0 | 2.0 | 1100 | $900 | $0.82 | 5d | 1 | 1.12mi |
| 2332 Baywood Dr SE Atlanta, GA | 3.0 | 2.0 | 1100 | $1,400 | $1.27 | 18d | 1 | 1.13mi |
| 976 McKay Dr SE Atlanta, GA | 3.0 | 1.0 | 1200 | $1,695 | $1.41 | 3d | 1 | 1.14mi |
| 174 Moury Ave SW Atlanta, GA | 1.0–3.0 | 1.0–2.0 | 926 | $1,604 | $1.73 | 3d | 6 | 1.14mi |
| 245 Amal Dr SW #3004 Atlanta, GA | 2.0 | 2.0 | 1402 | $1,800 | $1.28 | 22d | 1 | 1.17mi |
| 825 Hank Aaron Dr SW Atlanta, GA | 2.0 | 2.0 | 861 | $1,470 | $1.71 | 24d | 1 | 1.19mi |
| 2308 Lakewood Ave SW Unit A Atlanta, GA | 1.0 | 1.0 | 1112 | $895 | $0.80 | 24d | 1 | 1.19mi |
Listing history 50 events
-
2026-06-09status $125,000 Pending 45 DOM
-
2026-06-08days on market $125,000 Active Under Contract 45 DOM
Show marketing remark (774 chars)
Don't miss this prime investment opportunity in the rapidly growing Lakewood Heights community! This property is a true blank canvas ready for your vision. ? Property Highlights: 2 Surveys Completed - saving you time and money 2 Sets of Architectural Plans included Preferred Builder Available to streamline your renovation or rebuild Renovation Ready with huge upside potential Located at 382 South Bend Ave SE, Atlanta, this property sits in a desirable and revitalizing neighborhood just minutes from Downtown Atlanta, the BeltLine, and Hartsfield-Jackson Airport. Whether you're looking for a fix-and-flip, long-term rental, or a custom dream home, this is your chance to capitalize on a solid deal in one of Atlanta's hottest investment zones.
-
2026-06-07days on market $125,000 Active Under Contract 44 DOM
-
2026-06-04days on market $125,000 Active Under Contract 41 DOM
-
2026-06-03days on market $125,000 Active Under Contract 40 DOM
-
2026-06-02statusdays on market $125,000 Active Under Contract 39 DOM
-
2026-06-01days on market $125,000 Active 38 DOM
-
2026-05-31days on market $125,000 Active 37 DOM
-
2026-04-20$125,000 New 774-char remark
Show marketing remark (774 chars)
Don't miss this prime investment opportunity in the rapidly growing Lakewood Heights community! This property is a true blank canvas ready for your vision. ? Property Highlights: 2 Surveys Completed - saving you time and money 2 Sets of Architectural Plans included Preferred Builder Available to streamline your renovation or rebuild Renovation Ready with huge upside potential Located at 382 South Bend Ave SE, Atlanta, this property sits in a desirable and revitalizing neighborhood just minutes from Downtown Atlanta, the BeltLine, and Hartsfield-Jackson Airport. Whether you're looking for a fix-and-flip, long-term rental, or a custom dream home, this is your chance to capitalize on a solid deal in one of Atlanta's hottest investment zones.
-
2026-04-20$125,000 Active 798-char remark
Show marketing remark (774 chars)
Don't miss this prime investment opportunity in the rapidly growing Lakewood Heights community! This property is a true blank canvas ready for your vision. ? Property Highlights: 2 Surveys Completed - saving you time and money 2 Sets of Architectural Plans included Preferred Builder Available to streamline your renovation or rebuild Renovation Ready with huge upside potential Located at 382 South Bend Ave SE, Atlanta, this property sits in a desirable and revitalizing neighborhood just minutes from Downtown Atlanta, the BeltLine, and Hartsfield-Jackson Airport. Whether you're looking for a fix-and-flip, long-term rental, or a custom dream home, this is your chance to capitalize on a solid deal in one of Atlanta's hottest investment zones.
-
2026-02-28historical
-
2025-08-25$149,900 New
-
2024-12-30soldstatus $135,000
-
2024-12-27soldstatus $135,000 Sold
-
2024-12-27soldstatus $135,000 Closed
-
2024-12-23status Under Contract
-
2024-12-23status Pending
-
2024-12-04historical Active Under Contract
-
2024-11-20$145,000 New
-
2024-11-20$145,000 Active
-
2024-10-14historical
-
2024-09-18price $150,000
-
2024-07-14$175,000 Active
-
2023-11-07historical
-
2023-10-09status Back On Market
-
2023-08-22status Under Contract
-
2023-08-21status Back On Market
-
2023-08-18status Under Contract
-
2023-08-07$145,000 New
-
2022-11-04historical
-
2022-09-15status Back On Market
-
2022-09-14status Under Contract
-
2022-09-12status Back On Market
-
2022-09-04status Under Contract
-
2022-08-05$175,500 New
-
2022-04-02historical
-
2022-01-29status Active
-
2022-01-27historical
-
2022-01-21historical Active Under Contract
-
2021-11-01$165,500 New
-
2019-01-02historical
-
2019-01-02historical
-
2018-12-11status Back on Market
-
2018-12-03historical
-
2018-12-02status Active
-
2018-12-02historical
-
2018-11-13status Active
-
2018-11-13status Back on Market
-
2018-11-13historical Contingent - Due Diligence
-
2018-11-13status Under Contract
ⓘ Source: listings_history table (triggers on properties + properties_extension) + one-shot
backfill from property_details.listing_events for pre-trigger history.
Tax reassessment forecast GA · Resets to sale price
- Current annual tax
- $1,856 · $155/mo
- Projected year-2 tax
- $1,856 · $155/mo
- Expected delta
- $0/yr ($0/mo · 0.0%)
ⓘ Screening estimate from a state-policy table — verify with the county assessor before closing.
Climate risk First Street
- Flood 1/10 Low FEMA zone X (unshaded) · 0% chance over 30 yrs
- Wildfire 1/10 Low
- Heat 5/10 Major 7 d/yr ≥105°F today · 18 d/yr by 30 yrs out
- Wind 6/10 Major 27% chance of damaging wind over 30 yrs
- Air quality 4/10 Moderate 4 unhealthy d/yr today · 6 by 30 yrs out
Nearby sold comps map
Loading sold comps map…
Walkable amenities ~0.75 mi
Loading nearby amenities…
Taxation est. · year 1
- Rental income
- $21,297
- − Mortgage interest
- −$7,002
- − Property taxes
- −$1,856
- − Insurance
- −$625
- − Repairs & maintenance
- −$1,704
- − Management
- −$1,704
- − Depreciation
- −$3,636
- Taxable income
- $4,770
- Est. tax owed @ 24.0%
- −$1,145
- After-tax cash flow
- $5,333/yr
For passive investors: Depreciation is non-cash, so a rental often shows a tax loss while cash-flowing — sheltering income. Rental losses are passive: they offset passive income freely, and up to $25,000/yr can offset ordinary (W-2) income if you actively participate and your MAGI is under $100k (phasing out to $0 by $150k); unused losses carry forward. On sale, claimed depreciation is recaptured at up to 25%, and gains may owe capital-gains tax (a 1031 exchange can defer both). Figures are a year-1 estimate at your 24.0% rate — not tax advice; consult a CPA.
Schools (NCES district)
- District
- Atlanta Public Schools
- NCES district ID
- 1300120
- Math proficiency
- 28% ▼ -6.00%
- Reading proficiency
- 35% ▼ -2.00%
- Median HH income
- $48,306
- Composite
- 27.27/100
- National rank
- #7006
- State rank
- #80 of 174 in GA
Livability — Atlanta
- Score
- 83/100
- State rank
- #6
- US rank
- #919
Category grades
Schools grade is shown separately in the Schools card above.
Census & demographics
- Census place
- Atlanta, GA
- County
- Fulton County · 1,094,430 people
- City population
- 629,525
- Metro
- Atlanta-Sandy Springs-Alpharetta, GA
- Population (ZIP)
- 34,264
- Household income
- $50,822
- Rent vs Own
- Severe rent burden
- 2962.0
Population outlook (Fulton County) Hauer SSP2
- Today (2025)
- 1,203,707 people
- By 2030
- 1,299,706 · +8.0%
- By 2040
- 1,488,256 · +23.6%
- By 2050
- 1,664,580 · +38.3%
- By 2075
- 2,036,072 · +69.2%
- By 2100
- 2,222,402 · +84.6%
Race, ethnicity, and origin ACS 2023
- Neighborhood character
- Predominantly Black (72%)
- Race & ethnicity
- Black 72% White 14% Hispanic / Latino 10% Two or more races 4%
- Hispanic origin (detail)
- Mexican 4%
- Common ancestry
- Romanian 1% Italian 1% Lithuanian 1%
- Foreign-born
- 5% · Canada
- Languages at home
- 90% English-only · Spanish 9% French/Haitian/Cajun 1%
Political lean MEDSL · Fulton
- 2024 margin
- Solid D (+44.9) · D 71.9% · R 27.0% · Other 1.1%
- 2008→2024 swing
- +9.8pp toward D · 2008: 35.0pp · 2024: 44.9pp
- All cycles
- 2024: D+44.9 2020: D+46.4 2016: D+42.1 2012: D+29.6 2008: D+35.0
Not yet ingested
- Civics
- —
Market trends
- HPI YoY
- ▼ -281.87%
- Current HPI
- 176.673
- Rent YoY
- ▲ 3.23%
- Metro
- Atlanta-Sandy Springs-Alpharetta, GA
- State GDP YoY
- ▲ 2.66%
- F500 in state
- 28
Industry mix (Fortune 500 HQ in GA)
| Industry | F500 HQs | Revenue |
|---|---|---|
| Paper / Packaging | 2 | $29B |
|
||
| Retail | 1 | $160B |
|
||
| Transportation / Logistics | 1 | $91B |
|
||
| Airlines | 1 | $62B |
|
||
| Consumer Goods | 1 | $47B |
|
||
| Utilities | 1 | $25B |
|
||
Price history
+89.4% since first listed68 events — show timeline
- 2026-06-19 Relisted — GAMLS
- 2026-06-19 Relisted — FMLS
- 2026-06-09 Pending — FMLS
- 2026-06-08 Contingent — GAMLS
- 2026-06-02 Contingent — FMLS
- 2026-04-20 Listed $125,000 FMLS
- 2026-04-20 Listed $125,000 GAMLS
- 2026-02-28 Listing Removed — GAMLS
- 2025-08-25 Listed $149,900 GAMLS
- 2024-12-30 Sold (Public Records) $135,000 Public Records
- 2024-12-27 Sold (MLS) $135,000 FMLS
- 2024-12-27 Sold (MLS) $135,000 GAMLS
- 2024-12-23 Pending — GAMLS
- 2024-12-23 Pending — FMLS
- 2024-12-04 Contingent — GAMLS
- 2024-11-20 Listed $145,000 FMLS
- 2024-11-20 Listed $145,000 GAMLS
- 2024-10-14 Listing Removed — FMLS
- 2024-09-18 Price Changed $150,000 FMLS
- 2024-07-14 Listed $175,000 FMLS
- 2023-11-07 Listing Removed — GAMLS
- 2023-10-09 Relisted — GAMLS
- 2023-08-22 Pending — GAMLS
- 2023-08-21 Relisted — GAMLS
- 2023-08-18 Pending — GAMLS
- 2023-08-07 Listed $145,000 GAMLS
- 2022-11-04 Listing Removed — GAMLS
- 2022-09-15 Relisted — GAMLS
- 2022-09-14 Pending — GAMLS
- 2022-09-12 Relisted — GAMLS
- 2022-09-04 Pending — GAMLS
- 2022-08-05 Listed $175,500 GAMLS
- 2022-04-02 Listing Removed — GAMLS
- 2022-01-29 Relisted — GAMLS
- 2022-01-27 Listing Removed — GAMLS
- 2022-01-21 Contingent — GAMLS
- 2021-11-01 Listed $165,500 GAMLS
- 2019-01-02 Listing Removed — GAMLS
- 2019-01-02 Listing Removed — FMLS
- 2018-12-11 Relisted — GAMLS
- 2018-12-03 Listing Removed — GAMLS
- 2018-12-02 Relisted — FMLS
- 2018-12-02 Listing Removed — FMLS
- 2018-11-13 Relisted — FMLS
- 2018-11-13 Relisted — GAMLS
- 2018-11-13 Contingent — FMLS
- 2018-11-13 Pending — GAMLS
- 2018-11-01 Relisted — GAMLS
- 2018-11-01 Relisted — FMLS
- 2018-11-01 Listing Removed — GAMLS
- 2018-11-01 Listing Removed — FMLS
- 2018-10-18 Relisted — FMLS
- 2018-10-18 Relisted — GAMLS
- 2018-10-17 Listing Removed — GAMLS
- 2018-10-17 Listing Removed — FMLS
- 2018-10-01 Price Changed $75,000 GAMLS
- 2018-10-01 Price Changed $75,000 FMLS
- 2018-07-17 Listed $100,000 GAMLS
- 2018-07-17 Listed $100,000 FMLS
- 2010-06-10 Listing Removed — FMLS
- 2010-04-23 Sold (MLS) $6,000 FMLS
- 2010-04-19 Pending — FMLS
- 2010-04-14 Price Changed $6,000 GAMLS
- 2010-04-13 Price Changed $6,000 FMLS
- 2010-03-17 Price Changed $8,000 GAMLS
- 2010-03-16 Price Changed $8,000 FMLS
- 2000-07-20 Sold (Public Records) $65,000 Public Records
- 1999-04-09 Sold (Public Records) $66,000 Public Records
Property tax history
+2.2%/yrLatest (2025): $1,856 · +0.7% YoY. Source: county tax records.
Cash-flow waterfall
monthlySold comps — $/sqft
last 12 mo · ≤1 miLoading sold comps…