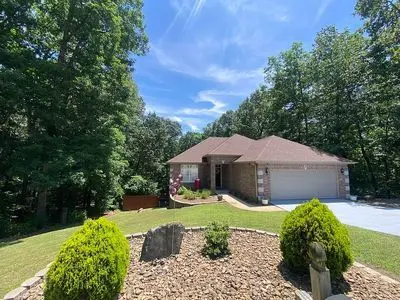
25 Merritt Cir · Bella Vista, AR
Flood risk 1/10 · Minimal
- FEMA flood zone
- X (unshaded)
- Chance of flooding over 30 yrs
- 0.0%
- Est. flood insurance / yr
- $473 – $860
Fire risk 3/10 · Minor
- Est. fire insurance / yr
- $1,499 – $2,785
Heat risk 4/10 · Minor
- Hot days now (above 104°F)
- 7 days/yr
- Hot days in 30 yrs
- 21 days/yr
Wind risk 2/10 · Minimal
- Chance of severe wind over 30 yrs
- 2.0%
Air-quality risk 2/10 · Minimal
- Unhealthy air days now
- 1 days/yr
- Unhealthy air days in 30 yrs
- 1 days/yr
Risk factors via First Street. Map © Google.
Why this score? — see what drove the D grade
The composite is a weighted blend of 9 inputs, each scored 0–100. Each bar is that input's sub-score; the figure is the points it added to the 100-point composite (weight × sub-score).
- ARV discount +10.5/15.0
- Cash flow +9.6/30.0
- Appreciation +5.7/10.0
- Schools +5.2/10.0
- Livability +3.4/5.0
- DSCR +2.7/10.0
- Rent growth +2.5/5.0
- Condition / age +2.5/5.0
- 1% rule +2.2/10.0
$495,000
🖨 Deal sheet (PDF) 📄 Offer letter ✓ Due diligence
Listing remarks MLS
Check out this exquisite 3-bedroom, 2.5-bathroom residence in Bella Vista. Including a formal dining area, a spacious family room, and a cozy media room. The kitchen features Corian countertops and offering ample space. Step outside to expansive decks, where you can enjoy the surrounding landscape. This home has been well maintained and recent upgrades, including a new roof installed in 2020 and a new HVAC system in 2019. This home is part of the Bentonville High School districts, including Ruth Barker Elementary and Washington Junior High. Conveniently located near Blowing Springs Trail and the NW Arkansas Greenway, you'll enjoy easy access to nature trails and recreational amenities. With the added convenience of being within walking distance to Blowing Springs. Additional features of this home include a new garage door installed in 2022. As an added bonus, the media projector and surround sound system in the theater room, as well as the refrigerator, will convey with the property!
Key facts
- Fenced yard
- Private wooded lot
- Outdoor living
Tags
Neighborhood map
What this means for you Summary
Snapshot
- This is a 3-bed/2.5-bath single-family listed at $495k.
Deal economics
- At list price, monthly cash flow is $-339 ($-4k/yr) — negative.
- To cash-flow at today's rent, offer at most $435k (12.1% below list).
- To meet the 1% rule (rent ≥ 1% of price), the offer needs to be $357k (27.9% below list).
- Recommended offer: $357k (27.9% below list) — sets the bar for 1% rule.
- Cap rate 5.5% vs local median 3.6% in Bella Vista — top-decile yield for the area; either an underpriced asset or a hidden risk that comps aren't pricing in. Stress-test before assuming the spread holds.
Location & tenants
- Location reads 67/100 on livability (#111 in AR) — a middle-class / working-renter tenant base. Strengths: cost of living A+, housing A+, schools A; Watch: amenities F, commute F, health & safety F.
- Bentonville School District (urban): math 59% / reading 59% proficiency, ranked #3 of 238 in AR (top 1%) — acceptable for families but not a draw, mixed tenant base, ~2y average lease.
- Market conditions: 484 active listings in the ZIP; 2 comparable units currently listed for rent nearby; solid renter incomes; 4,359 units permitted in Benton County in 2024 (402 in 5+ unit buildings).
- This rent runs 42% of the median local income ($103k/yr) — at the standard rent-burdened threshold; future hikes will face affordability resistance.
Forward outlook
- In year one you build about $10k of equity ($3k loan paydown + $7k appreciation (1.4% local appreciation)).
- Benton County population projected at +56% by 2050 — long-run rental-demand tailwind backs the buy-and-hold thesis.
- By year 4, paydown + projected appreciation supports a ~$36k cash-out refi (75% LTV) — recoverable capital for the next deal without selling this one.
Negotiation context
- It's been on market 21 days — a 2% lower offer ($488k) is reasonable based on typical stale-listing flexibility.
- 3 sale attempts since 7y ago with the ask held roughly flat each time — persistent listings suggest the price (not the market) is what's stuck; bring a comps-based counter.
- Current owner paid $359k; 38% above their basis — modest negotiation headroom, anchor on the comps not their cost.
Questions for the listing agent
- What do current leases actually rent for vs. the listed asking? Can we see a recent rent roll and the last 12 months of T-12 income?
- Is there a deadline driving the sale (1031 exchange, divorce, estate, relocation)? That informs how much negotiation room exists.
- Schools are A-rated — typically a magnet for longer-tenancy family renters. What's the average tenant stay here, and is there a school-zone premium baked into asking?
- The area grade is low — what's the realistic commute time and amenity access for the typical tenant pool here? Any planned neighborhood developments (good or bad) we should know about?
- What's the average days-on-market for RENTAL listings here right now (not sales)? A rising rental-DOM trend means longer vacancies and softer asking-rent achievability than the comps imply.
- What's the recent tenant-quality profile in this submarket — average credit score on applications, eviction rate, late-payment / NSF rate, and stable-employment percentage? A property-management company in the area should have these aggregated.
- How much new for-sale + rental construction is in the pipeline within 1–3 miles? Heavy new supply typically softens prices + rents 12–24 months out; constrained supply supports both.
Investment metrics
- 1% rule
- 0.72% ✗
- Cap rate
- 5.47%
- Cash-on-cash
- -2.94%
- DSCR
- 0.87
- GRM
- 11.6
CMA / ARV
- ARV (on-the-fly)
- $530,980
- Comps found
- 12
Show comp detail 12 sales within ~0.75 mi
| Address | Dist | Beds/Ba | Sqft | Sold | Price | $/sf | Match |
|---|---|---|---|---|---|---|---|
| 54 Merritt Dr | 0.15mi | 4/3.0 (+1) | 2,679 (-4%) | 9mo | $524,900 | $196 | 72 |
| 5 Wickham Ln | 0.34mi | 3/3.0 | 2,643 (-5%) | 3mo | $423,900 | $160 | 71 |
| 9 Keighley Ln | 0.30mi | 3/3.0 | 2,642 (-5%) | 12mo | $477,000 | $181 | 66 |
| 7 Rothbury Ln | 0.53mi | 3/3.0 | 2,654 (-4%) | 3mo | $530,000 | $200 | 63 |
| 8 Merritt Ln | 0.21mi | 3/3.5 | 3,180 (+14%) | 11mo | $400,000 | $126 | 53 |
| 47 Cresswell Dr | 0.58mi | 4/3.0 (+1) | 2,695 (-3%) | 10mo | $493,000 | $183 | 52 |
| 18 Sullivan Dr | 0.44mi | 3/2.0 | 2,408 (-13%) | 3mo | $460,000 | $191 | 52 |
| 5 Ging Ln | 0.62mi | 4/2.5 (+1) | 2,545 (-8%) | 2mo | $600,000 | $236 | 50 |
| 57 Sunderland Dr | 0.73mi | 4/3.0 (+1) | 2,646 (-5%) | 1mo | $435,000 | $164 | 50 |
| 5 Sunderland Ln | 0.70mi | 4/3.0 (+1) | 2,592 (-7%) | 10mo | $475,000 | $183 | 40 |
| 36 Headley Dr | 0.69mi | 4/3.0 (+1) | 2,460 (-12%) | 2mo | $523,980 | $213 | 40 |
| 9 Ravenglass Ln | 0.73mi | 3/2.5 | 2,481 (-11%) | 12mo | $620,000 | $250 | 37 |
Match score weights: distance 35% · size 25% · config 20% · recency 20%. Top-matched comps best support the ARV.
Projected returns pro-forma
1.38% appreciation · 3.0% rent growth · sell at horizon
- IRR
- -0.4%
- Equity multiple
- 0.98×
- Total profit
- $-3,071
- Equity at exit
- $178,972
- IRR
- 4.2%
- Equity multiple
- 1.53×
- Total profit
- $73,770
- Equity at exit
- $245,760
Cash invested: $138,600 (down + closing). Projections, not guarantees.
Landlord ↔ Tenant lean methodology
- Overall (STATE)
- 92 Strongly Landlord-Friendly
- State Arkansas
- 92 Strongly Landlord-Friendly · R+14
- County
- — inherits STATE
- City
- — inherits STATE
ZIP-level market 72714
- Home prices YoY
- 0.5%
- Active inventory
- 484
- Price-to-rent
- 11.6×
Monthly cashflow live
- Estimated rent
- $3,569 medium interval (Pro) →
- Mortgage (P&I)
- −$2,596
- Tax from tax record
- −$357 /mo · $4,283/yr
- Insurance
- −$206
- HOA
- −$0
- Vacancy / Maint / Mgmt
- −$750
- Net cashflow
- $-339
Break-even live
Sensitivity live
| Price | -10% $-59 | -5% $-199 | +0% $-339 | +5% $-479 | +10% $-619 |
|---|---|---|---|---|---|
| Rent | -10% $-621 | -5% $-480 | +0% $-339 | +5% $-198 | +10% $-57 |
| Rate | -1.0pp $-90 | -0.5pp $-213 | base $-339 | +0.5pp $-468 | +1.0pp $-598 |
UW: 25.0% down · 7.5% · 30yr · 1.5% tax · 5.0% vac · 8.0% maint · 8.0% mgmt
Financing live
Cash to close
- Down payment
- $123,750
- Closing costs
- $14,850
- Reserves months
- —
- Total cash needed
- —
Loan-product check · same deal, 3 products live
Conventional
25% down · 7.5% · 30yr
- Down + closing
- —
- Monthly P&I
- —
- Monthly cashflow
- —
- DSCR
- —
- Eligible?
- —
Personal DTI + credit; lowest rate.
DSCR
20% down · 8.5% · 30yr
- Down + closing
- —
- Monthly P&I
- —
- Monthly cashflow
- —
- DSCR
- —
- Eligible?
- —
No personal income docs; deal must DSCR.
Hard money
10% down · 12.0% · 12mo
- Down + closing
- —
- Monthly P&I
- —
- Monthly cashflow
- —
- DSCR
- —
- Eligible?
- —
Short-term bridge; refi at stabilization.
Rent comps 2 comps
| Address | Beds | Baths | Sqft | Rent | $/sqft | DOM | Units | Dist |
|---|---|---|---|---|---|---|---|---|
| 34 Witherby Dr Bella Vista, AR | 4.0 | 3.0 | 2225 | $2,295 | $1.03 | 25d | 1 | 0.53mi |
| 8442 E McNelly Rd Unit 1335207P Bentonville, AR | 2.0 | 2.0 | 1991 | $8,464 | $4.25 | 23d | 1 | 0.78mi |
Listing history 14 events
-
2026-06-22days on market $495,000 Active 21 DOM
-
2026-06-18days on market $495,000 Active 18 DOM
-
2026-06-17days on market $495,000 Active 17 DOM
-
2026-06-15days on market $495,000 Active 15 DOM
-
2026-06-14days on market $495,000 Active 13 DOM
-
2026-06-10days on market $495,000 Active 10 DOM
-
2026-06-09days on market $495,000 Active 9 DOM
-
2026-06-08days on market $495,000 Active 8 DOM
-
2026-06-07days on market $495,000 Active 7 DOM
-
2026-06-05days on market $495,000 Active 4 DOM
-
2026-06-03days on market $495,000 Active 3 DOM
-
2026-06-02days on market $495,000 Active 2 DOM
-
2026-06-01remarks 699-char remark
-
2026-06-01$495,000 Active 1 DOM
ⓘ Source: listings_history table (triggers on properties + properties_extension) + one-shot
backfill from property_details.listing_events for pre-trigger history.
Tax reassessment forecast AR · Resets to sale price
- Current annual tax
- $4,283 · $357/mo
- Projected year-2 tax
- $4,283 · $357/mo
- Expected delta
- $0/yr ($0/mo · 0.0%)
ⓘ Screening estimate from a state-policy table — verify with the county assessor before closing.
Climate risk First Street
- Flood 1/10 Low FEMA zone X (unshaded) · 0% chance over 30 yrs
- Wildfire 3/10 Moderate
- Heat 4/10 Moderate 7 d/yr ≥104°F today · 21 d/yr by 30 yrs out
- Wind 2/10 Low 2% chance of damaging wind over 30 yrs
- Air quality 2/10 Low 1 unhealthy d/yr today · 1 by 30 yrs out
Nearby sold comps map
Loading sold comps map…
Walkable amenities ~0.75 mi
Loading nearby amenities…
Taxation est. · year 1
- Rental income
- $42,832
- − Mortgage interest
- −$27,728
- − Property taxes
- −$4,283
- − Insurance
- −$2,475
- − Repairs & maintenance
- −$3,427
- − Management
- −$3,427
- − Depreciation
- −$14,400
- Taxable loss
- −$12,907
- Est. tax savings @ 24.0%
- +$3,098
- After-tax cash flow
- $-973/yr
For passive investors: Depreciation is non-cash, so a rental often shows a tax loss while cash-flowing — sheltering income. Rental losses are passive: they offset passive income freely, and up to $25,000/yr can offset ordinary (W-2) income if you actively participate and your MAGI is under $100k (phasing out to $0 by $150k); unused losses carry forward. On sale, claimed depreciation is recaptured at up to 25%, and gains may owe capital-gains tax (a 1031 exchange can defer both). Figures are a year-1 estimate at your 24.0% rate — not tax advice; consult a CPA.
Schools (NCES district)
- District
- Bentonville School District
- NCES district ID
- 0503060
- Math proficiency
- 59% ▼ -8.00%
- Reading proficiency
- 59% ▼ -6.00%
- Median HH income
- $66,721
- Composite
- 51.85/100
- National rank
- #1661
- State rank
- #3 of 238 in AR
Livability — Bella Vista
- Score
- 67/100
- State rank
- #111
- US rank
- #11129
Category grades
Schools grade is shown separately in the Schools card above.
Census & demographics
- Census place
- Bella Vista, AR
- County
- Benton County · 259,241 people
- City population
- 67,689
- Metro
- Fayetteville-Springdale-Rogers, AR
- Population (ZIP)
- 14,350
- Household income
- $103,125
- Rent vs Own
- Severe rent burden
- 61.0
Population outlook (Benton County) Hauer SSP2
- Today (2025)
- 318,683 people
- By 2030
- 353,481 · +10.9%
- By 2040
- 425,280 · +33.4%
- By 2050
- 497,239 · +56.0%
- By 2075
- 662,114 · +107.8%
- By 2100
- 776,431 · +143.6%
Race, ethnicity, and origin ACS 2023
- Neighborhood character
- Predominantly White (83%)
- Race & ethnicity
- White 83% Two or more races 11% Hispanic / Latino 6%
- Hispanic origin (detail)
- Mexican 2% Dominican 2%
- Common ancestry
- Slovak 4% Lithuanian 3% Italian 3%
- Foreign-born
- 3% · Canada
- Languages at home
- 98% English-only · Spanish 2%
Political lean MEDSL · Benton
- 2024 margin
- Strong R (+27.0) · D 35.2% · R 62.1% · Other 2.7%
- 2008→2024 swing
- +9.6pp toward D · 2008: -36.5pp · 2024: -27.0pp
- All cycles
- 2024: R+27.0 2020: R+26.4 2016: R+34.9 2012: R+40.4 2008: R+36.5
Not yet ingested
- Civics
- —
Market trends
- HPI YoY
- ▲ 1.38%
- Current HPI
- 307.5796
- Rent YoY
- —
- Metro
- Fayetteville-Springdale-Rogers, AR
- State GDP YoY
- ▲ 3.80%
- F500 in state
- 10
Industry mix (Fortune 500 HQ in AR)
| Industry | F500 HQs | Revenue |
|---|---|---|
| Retail | 1 | $681B |
|
||
| Food / Agriculture | 1 | $53B |
|
||
| Retail / Energy | 1 | $22B |
|
||
| Transportation / Logistics | 1 | $12B |
|
||
| Energy | 1 | $4B |
|
||
Price history
+78.1% since first listed12 events — show timeline
- 2026-06-01 Listed $495,000 FSBO.com
- 2024-07-15 Sold (Public Records) $359,300 Public Records
- 2024-07-11 Sold (MLS) $359,300 NWARMLS
- 2024-05-23 Pending — NWARMLS
- 2024-05-15 Price Changed $375,000 NWARMLS
- 2024-05-11 Price Changed $385,000 NWARMLS
- 2024-05-06 Price Changed $395,000 NWARMLS
- 2024-04-02 Price Changed $400,000 NWARMLS
- 2024-03-15 Listed $420,000 NWARMLS
- 2019-05-15 Sold (Public Records) $278,000 Public Records
- 2019-05-10 Sold (MLS) $278,000 NWARMLS
- 2019-03-07 Listed $278,000 NWARMLS
Property tax history
+7.6%/yrLatest (2025): $4,283 · +47.0% YoY. Source: county tax records.
Cash-flow waterfall
monthlySold comps — $/sqft
last 12 mo · ≤1 miLoading sold comps…