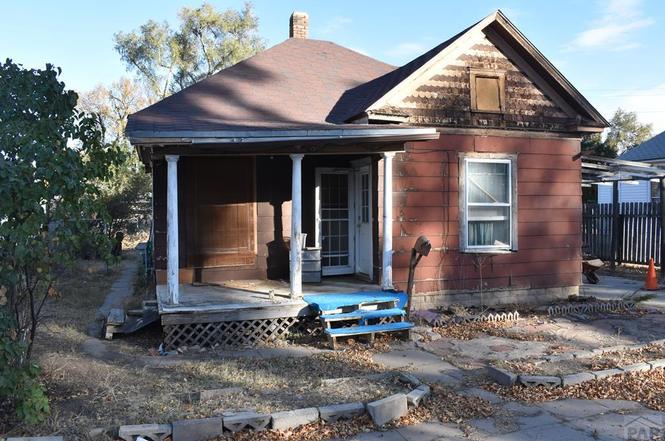
810 S 8th St · Rocky Ford, CO
Flood risk 1/10 · Minimal
- FEMA flood zone
- X
- Chance of flooding over 30 yrs
- 0.0%
- Est. flood insurance / yr
- $473 – $860
Fire risk 6/10 · Moderate
- Est. fire insurance / yr
- $939 – $1,743
Heat risk 4/10 · Minor
- Hot days now (above 98°F)
- 7 days/yr
- Hot days in 30 yrs
- 20 days/yr
Wind risk 2/10 · Minimal
- Chance of severe wind over 30 yrs
- —
Air-quality risk 2/10 · Minimal
- Unhealthy air days now
- 0 days/yr
- Unhealthy air days in 30 yrs
- 1 days/yr
Risk factors via First Street. Map © Google.
Why this score? — see what drove the B- grade
The composite is a weighted blend of 9 inputs, each scored 0–100. Each bar is that input's sub-score; the figure is the points it added to the 100-point composite (weight × sub-score).
- Cash flow +30.0/30.0
- 1% rule +10.0/10.0
- DSCR +10.0/10.0
- ARV discount +7.5/15.0
- Livability +3.9/5.0
- Rent growth +2.5/5.0
- Condition / age +2.5/5.0
- Schools +2.4/10.0
- Appreciation +0.0/10.0
$47,900
🖨 Deal sheet 📄 Offer letter ✓ Due diligence
Listing remarks
Price reduced on this roomy fixer upper. This home is arranged with 3 bedrooms, a very large living room and a large utility room adjoining the back door. The kitchen is cute. Outside, the back yard is fenced and has lots of room and has a storage shed. Make this your opportunity to fix it up at an affordable price. .
Key facts
- Fenced back yard
- Large living room
- Storage shed
Tags
Property features AI
Finance
- HOA & community: No association amenities
Exterior
- Parking: No garage
- Utilities: Public water; Public sewer
- Home design: Single-family residence; Residential property; Frame construction
- Construction: Composition roof
- Exterior features: No patio or porch; Irregular lot
Interior
- Kitchen: Range; Oven
- Bedrooms: Three main-level bedrooms
- Flooring: Wood flooring
- Bathrooms: One full bathroom on the main level
- Heating & cooling: Forced air heating; No cooling
- Interior features: Master bedroom on the main level; No basement
- Laundry & utility: Main-level laundry
Neighborhood map
What this means for you Summary
Snapshot
- This is a 3-bed/1.0-bath single-family listed at $48k.
Deal economics
- At list price, monthly cash flow is $636 ($8k/yr) — positive.
- The deal already cash-flows at list — no discount required.
- Meets the 1% rule at list price ($1k rent vs $48k).
- Recommended offer: $42k (12.0% below list) — sets the bar for market timing.
- Cap rate 22.2% vs local median 4.5% in Rocky Ford — top-decile yield for the area; either an underpriced asset or a hidden risk that comps aren't pricing in. Stress-test before assuming the spread holds.
Location & tenants
- Location reads 78/100 on livability (#22 in CO, #2,671 nationally) — a middle-class / working-renter tenant base. Strengths: crime A+, cost of living A+, health & safety A+; Watch: amenities D+, schools F, employment F.
- Rocky Ford School District No. R2 (town): math 24% / reading 36% proficiency, ranked #58 of 86 in CO (top 67%) — families likely to look elsewhere, expect single-tenant / working-renter base with shorter leases; 67% free/reduced lunch — lower-income household profile, screen leases tightly.
- Market conditions: 40 active listings in the ZIP; 11 units permitted in Otero County in 2024 (0 in 5+ unit buildings).
Forward outlook
- Local home prices are declining (-3.0%/yr); year-one equity from $331 of loan paydown is wiped out by about $1k of value loss. Plan a longer hold.
- Otero County population projected at -17% by 2050 — secular population decline; favor cash flow + early exit over multi-decade hold.
- At projected returns (-3.0% appreciation + 3.0% rent growth), your $13k cash investment doubles in ~2 years — after that, you're playing with house money.
Negotiation context
- It's been on market 168 days — a 12% lower offer ($42k) is reasonable based on typical stale-listing flexibility.
- 3 sale attempts; this cycle's ask has dropped $11k (19%) from the opening price — seller is motivated, your offer sets the floor, not the list.
Risks & watch-outs
- Watch-outs: built in 1906 — expect roof / HVAC / electrical / plumbing capex.
- Climate carrying-cost: major wildfire risk — expect insurance premiums to compound above CPI over the hold.
Questions for the listing agent
- It's been on market 168 days. Have you received any prior offers? Is the seller open to a 12% concession, seller financing, or rate buy-down credit?
- Built in 1906 — when were the roof, HVAC, electrical panel, plumbing, and water heater last replaced?
- Why hasn't it sold? Are there any deal-killer items the seller is aware of (foundation, flood, title, zoning, code violations)?
- Is there a deadline driving the sale (1031 exchange, divorce, estate, relocation)? That informs how much negotiation room exists.
- Schools are F-rated, which usually means shorter tenancies and higher turnover. Who's the typical renter profile here, and what's been the actual vacancy rate?
- What's the average days-on-market for RENTAL listings here right now (not sales)? A rising rental-DOM trend means longer vacancies and softer asking-rent achievability than the comps imply.
- What's the recent tenant-quality profile in this submarket — average credit score on applications, eviction rate, late-payment / NSF rate, and stable-employment percentage? A property-management company in the area should have these aggregated.
- How much new for-sale + rental construction is in the pipeline within 1–3 miles? Heavy new supply typically softens prices + rents 12–24 months out; constrained supply supports both.
Investment metrics
- 1% rule
- 2.42% ✓
- Cap rate
- 22.22%
- Cash-on-cash
- 56.89%
- DSCR
- 3.53
- GRM
- 3.4
CMA / ARV
- ARV (on-the-fly)
- $166,624
- Comps found
- 12
Show comp detail 12 sales within ~0.75 mi
| Address | Dist | Beds/Ba | Sqft | Sold | Price | $/sf | Match |
|---|---|---|---|---|---|---|---|
| 810 S 8th St | 0.00mi | 3/1.0 | 1,312 (0%) | 1mo | $45,000 | $34 | 99 |
| 711 S 7th St | 0.17mi | 3/1.5 | 1,340 (+2%) | 1mo | $141,750 | $106 | 86 |
| 703 Spruce Ave | 0.09mi | 2/2.0 (-1) | 1,350 (+3%) | 11mo | $210,000 | $156 | 73 |
| 817 S Main St | 0.05mi | 2/1.0 (-1) | 1,170 (-11%) | 3mo | $75,000 | $64 | 72 |
| 1100 Lincoln Ave | 0.28mi | 3/2.0 | 1,435 (+9%) | 3mo | $230,000 | $160 | 65 |
| 802 S 5th St | 0.19mi | 3/1.0 | 1,212 (-8%) | 19mo | $170,000 | $140 | 63 |
| 301 S 3rd St | 0.61mi | 3/1.0 | 1,320 (+1%) | 11mo | $139,500 | $106 | 62 |
| 815 S 2nd St | 0.28mi | 3/2.0 | 1,479 (+13%) | 4mo | $209,900 | $142 | 58 |
| 605 S 14th St | 0.45mi | 2/2.0 (-1) | 1,376 (+5%) | 5mo | $135,900 | $99 | 57 |
| 611 S 6th St | 0.28mi | 3/1.0 | 1,152 (-12%) | 13mo | $83,000 | $72 | 56 |
| 1106 Lowell Dr | 0.32mi | 2/2.0 (-1) | 1,220 (-7%) | 18mo | $155,000 | $127 | 49 |
| 1005 Maple Ave | 0.40mi | 2/2.0 (-1) | 1,165 (-11%) | 11mo | $190,000 | $163 | 44 |
Match score weights: distance 35% · size 25% · config 20% · recency 20%. Top-matched comps best support the ARV.
Projected returns pro-forma
-3.0% appreciation · 3.0% rent growth · sell at horizon
- IRR
- 55.3%
- Equity multiple
- 3.44×
- Total profit
- $32,724
- Equity at exit
- $7,142
- IRR
- 60.3%
- Equity multiple
- 7.01×
- Total profit
- $80,588
- Equity at exit
- $4,142
Cash invested: $13,412 (down + closing). Projections, not guarantees.
Landlord ↔ Tenant lean methodology
- Overall (STATE)
- 38 Tenant-Leaning
- State Colorado
- 38 Tenant-Leaning · D+4
- County
- — inherits STATE
- City
- — inherits STATE
ZIP-level market 81067
- Home prices YoY
- -25.2%
- Active inventory
- 40
- Price-to-rent
- 3.4×
Monthly cashflow live
- Estimated rent
- $1,159 medium interval (Pro) →
- Mortgage (P&I)
- −$251
- Tax from tax record
- −$9 /mo · $106/yr
- Insurance
- −$20
- HOA
- −$0
- Vacancy / Maint / Mgmt
- −$243
- Net cashflow
- $636
Break-even live
UW: 25.0% down · 7.5% · 30yr · 1.5% tax · 5.0% vac · 8.0% maint · 8.0% mgmt
Financing live
Cash to close
- Down payment
- $11,975
- Closing costs
- $1,437
- Reserves months
- —
- Total cash needed
- —
Loan-product check · same deal, 3 products live
Conventional
25% down · 7.5% · 30yr
- Down + closing
- —
- Monthly P&I
- —
- Monthly cashflow
- —
- DSCR
- —
- Eligible?
- —
Personal DTI + credit; lowest rate.
DSCR
20% down · 8.5% · 30yr
- Down + closing
- —
- Monthly P&I
- —
- Monthly cashflow
- —
- DSCR
- —
- Eligible?
- —
No personal income docs; deal must DSCR.
Hard money
10% down · 12.0% · 12mo
- Down + closing
- —
- Monthly P&I
- —
- Monthly cashflow
- —
- DSCR
- —
- Eligible?
- —
Short-term bridge; refi at stabilization.
Listing history 7 events
-
2026-05-20status Pending
-
2026-05-02status Active
-
2026-04-16status Active
-
2026-03-31status Pending
-
2025-12-04price $47,900
-
2025-11-18price $54,000
-
2025-11-01$59,000 Active
ⓘ Source: listings_history table (triggers on properties + properties_extension) + one-shot
backfill from property_details.listing_events for pre-trigger history.
Tax reassessment forecast CO · Resets to sale price
- Current annual tax
- $106 · $9/mo
- Projected year-2 tax
- $263 · $22/mo
- Expected delta
- +$157/yr (+$13/mo · 148.5%)
ⓘ Screening estimate from a state-policy table — verify with the county assessor before closing.
Climate risk First Street
- Flood 1/10 Low FEMA zone X · 0% chance over 30 yrs
- Wildfire 6/10 Major
- Heat 4/10 Moderate 7 d/yr ≥98°F today · 20 d/yr by 30 yrs out
- Wind 2/10 Low
- Air quality 2/10 Low 0 unhealthy d/yr today · 1 by 30 yrs out
Nearby sold comps map
Loading sold comps map…
Walkable amenities ~0.75 mi
Loading nearby amenities…
Taxation est. · year 1
- Rental income
- $13,912
- − Mortgage interest
- −$2,683
- − Property taxes
- −$106
- − Insurance
- −$240
- − Repairs & maintenance
- −$1,113
- − Management
- −$1,113
- − Depreciation
- −$1,393
- Taxable income
- $7,264
- Est. tax owed @ 24.0%
- −$1,743
- After-tax cash flow
- $5,887/yr
For passive investors: Depreciation is non-cash, so a rental often shows a tax loss while cash-flowing — sheltering income. Rental losses are passive: they offset passive income freely, and up to $25,000/yr can offset ordinary (W-2) income if you actively participate and your MAGI is under $100k (phasing out to $0 by $150k); unused losses carry forward. On sale, claimed depreciation is recaptured at up to 25%, and gains may owe capital-gains tax (a 1031 exchange can defer both). Figures are a year-1 estimate at your 24.0% rate — not tax advice; consult a CPA.
Schools (NCES district)
- District
- Rocky Ford School District No. R2
- NCES district ID
- 0806270
- Math proficiency
- 24% ▲ 2.00%
- Reading proficiency
- 36% ▼ -3.00%
- Median HH income
- $31,077
- Composite
- 24.35/100
- National rank
- #7694
- State rank
- #58 of 86 in CO
Livability — Rocky Ford
- Score
- 78/100
- State rank
- #22
- US rank
- #2671
Category grades
Schools grade is shown separately in the Schools card above.
Census & demographics
- Census place
- Rocky Ford, CO
- Population (ZIP)
- 5,590
Population outlook (Otero County) Hauer SSP2
- Today (2025)
- 17,363 people
- By 2030
- 16,776 · -3.4%
- By 2040
- 15,534 · -10.5%
- By 2050
- 14,467 · -16.7%
- By 2075
- 12,054 · -30.6%
- By 2100
- 9,392 · -45.9%
Race, ethnicity, and origin ACS 2023
- Neighborhood character
- Majority Hispanic (56%)
- Race & ethnicity
- Hispanic / Latino 56% White 40% Two or more races 22%
- Hispanic origin (detail)
- Mexican 45%
- Common ancestry
- Iranian 1% Italian 1% Slovak 1%
- Foreign-born
- 4% · Canada, South Korea
- Languages at home
- 82% English-only · Spanish 17%
Political lean MEDSL · Otero
- 2024 margin
- Strong R (+26.4) · D 35.5% · R 61.9% · Other 2.7%
- 2008→2024 swing
- -15.9pp toward R · 2008: -10.5pp · 2024: -26.4pp
- All cycles
- 2024: R+26.4 2020: R+22.5 2016: R+25.2 2012: R+9.3 2008: R+10.5
Not yet ingested
- Civics
- —
Market trends
- HPI YoY
- ▼ -72.32%
- Current HPI
- 214.2931
- Rent YoY
- —
- Metro
- —
- State GDP YoY
- ▲ 1.95%
- F500 in state
- 14
Industry mix (Fortune 500 HQ in CO)
| Industry | F500 HQs | Revenue |
|---|---|---|
| Technology Distribution | 1 | $31B |
|
||
| Food / Agriculture | 1 | $18B |
|
||
| Packaging | 1 | $14B |
|
||
| Healthcare | 1 | $13B |
|
||
| Energy | 1 | $10B |
|
||
| Technology | 1 | $4B |
|
||
Price history
-18.8% since first listed7 events — show timeline
- 2026-05-20 Pending — PARMLS
- 2026-05-02 Relisted — PARMLS
- 2026-04-16 Relisted — PARMLS
- 2026-03-31 Pending — PARMLS
- 2025-12-04 Price Changed $47,900 PARMLS
- 2025-11-18 Price Changed $54,000 PARMLS
- 2025-11-01 Listed $59,000 PARMLS
Property tax history
-8.0%/yrLatest (2024): $106 · -0.2% YoY. Source: county tax records.
Cash-flow waterfall
monthlySold comps — $/sqft
last 12 mo · ≤1 miLoading sold comps…