 Duplex
645-647 Van Everett Ave · Akron, OH
Flood risk 1/10 · Minimal
- FEMA flood zone
- X (unshaded)
- Chance of flooding over 30 yrs
- 0.0%
- Est. flood insurance / yr
- $473 – $860
Fire risk 1/10 · Minimal
- Est. fire insurance / yr
- $713 – $1,323
Heat risk 3/10 · Minor
- Hot days now (above 96°F)
- 7 days/yr
- Hot days in 30 yrs
- 17 days/yr
Wind risk 1/10 · Minimal
- Chance of severe wind over 30 yrs
- —
Air-quality risk 3/10 · Minor
- Unhealthy air days now
- 2 days/yr
- Unhealthy air days in 30 yrs
- 4 days/yr
Risk factors via First Street. Map © Google.
Why this score? — see what drove the C grade
The composite is a weighted blend of 9 inputs, each scored 0–100. Each bar is that input's sub-score; the figure is the points it added to the 100-point composite (weight × sub-score).
- Cash flow +27.4/30.0
- DSCR +9.6/10.0
- 1% rule +7.0/10.0
- Rent growth +4.4/5.0
- Livability +4.0/5.0
- Condition / age +2.5/5.0
- Schools +2.1/10.0
- ARV discount +0.0/15.0
- Appreciation +0.0/10.0
$149,900
🖨 Deal sheet (PDF) 📄 Offer letter ✓ Due diligence
Multi-family units
County records classify this as Multi-Family (2-4 Unit). Listing-text estimate: 2 units. confirmed
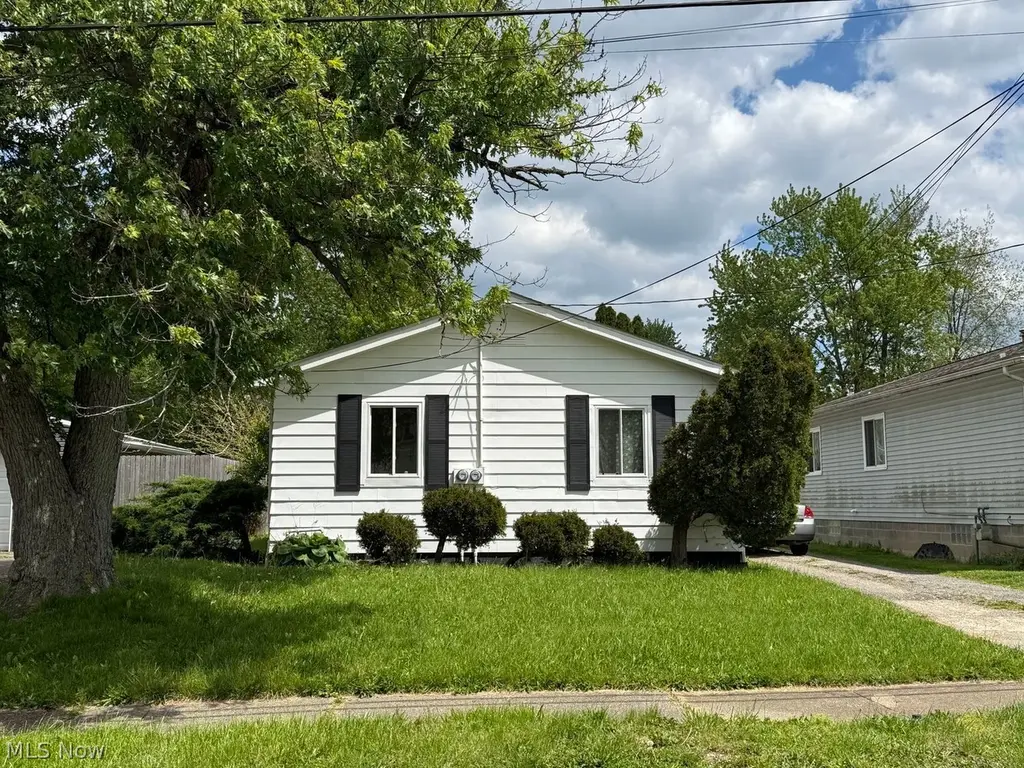
Listing remarks
645-647 Van Everett Ave offers a solid opportunity for an investor or owner-occupant looking to build equity and add value over time. This side-by-side ranch duplex features two 2-bedroom, 1-bath units with separate entrances, separate utilities, and full basements with laundry hookups for each side. Both units are currently occupied on month-to-month leases, providing immediate income with flexibility for future plans. Current rents are $800 and $700 per month, with tenants paying all utilities. The property offers a functional layout with spacious living rooms, eat-in kitchens, and private bedroom areas. While the duplex has been occupied and maintained over the years, there is clear oppo
Key facts
- Functional layout
- Separate entrances
- Laundry hookups
Tags
Neighborhood map
What this means for you Summary
Snapshot
- This is a 2 × 2-bed/1-bath units multifamily listed at $150k.
Deal economics
- At list price, monthly cash flow is $438 ($5k/yr) — positive. Per door: $219/mo.
- The deal already cash-flows at list — no discount required.
- Meets the 1% rule at list price ($2k rent vs $150k).
- Recommended offer: $145k (3.0% below list) — sets the bar for market timing.
- Cap rate 9.8% vs local median 6.6% in Akron — top-decile yield for the area; either an underpriced asset or a hidden risk that comps aren't pricing in. Stress-test before assuming the spread holds.
Location & tenants
- Location reads 81/100 on livability (#104 in OH, #1,591 nationally) — a professional / high-income tenant draw. Strengths: amenities A+, commute A+, cost of living A+; Watch: crime F, employment F.
- Akron City (urban): math 22% / reading 30% proficiency, ranked #602 of 656 in OH (top 92%) — low school quality limits family demand, transient renter base, plan for 1-2y turnover; 66% free/reduced lunch — lower-income household profile, screen leases tightly.
- Market conditions: Rents rising fast (+7.6%/yr); 71 active listings in the ZIP; 37 comparable units currently listed for rent nearby; rentals lingering (median 45d on market — plan ~5-8 weeks vacancy on turnover, expect pricing pressure); 59% of comp listings sitting > 30 days — soft ceiling on asking rent; lower-income renter base — watch delinquency; 1,114 units permitted in Summit County in 2024 (397 in 5+ unit buildings).
- At $1,798/mo this rent would consume 52% of the median local household income ($42k/yr) (locally 1251% of renters already pay >50% of income on rent) — very limited rent-growth headroom before tenants either downsize or default.
Forward outlook
- Local home prices are declining (-3.0%/yr); year-one equity from $1k of loan paydown is wiped out by about $4k of value loss. Plan a longer hold.
- Summit County population projected to shrink 6% by 2050 — rents likely to lag national; underwrite the cash flow, not the appreciation.
- At projected returns (-3.0% appreciation + 7.6% rent growth), your $42k cash investment doubles in ~7 years — after that, you're playing with house money.
Negotiation context
- It's been on market 44 days — a 3% lower offer ($145k) is reasonable based on typical stale-listing flexibility.
- 2 sale attempts since 22y ago with the ask held roughly flat each time — persistent listings suggest the price (not the market) is what's stuck; bring a comps-based counter.
- Current owner paid $56k; list at $150k implies a 168% gain — meaningful room to come down on a strong offer.
Questions for the listing agent
- It's been on market 44 days. Have you received any prior offers? Is the seller open to a 3% concession, seller financing, or rate buy-down credit?
- Can we see the unit-by-unit rent roll, current vacancy, and any below-market leases? What's the average tenancy length?
- What capital expenditures (roof, boiler, parking lot, exteriors) have been made in the last 5 years, and what's planned in the next 2?
- Built in 1965 — when were the roof, HVAC, electrical panel, plumbing, and water heater last replaced?
- Is there a deadline driving the sale (1031 exchange, divorce, estate, relocation)? That informs how much negotiation room exists.
- Crime grade is F in this area — have there been break-ins, vandalism, or insurance claims at this property in the last 3 years? What carrier currently insures it and at what premium?
- What's the average days-on-market for RENTAL listings here right now (not sales)? A rising rental-DOM trend means longer vacancies and softer asking-rent achievability than the comps imply.
- What's the recent tenant-quality profile in this submarket — average credit score on applications, eviction rate, late-payment / NSF rate, and stable-employment percentage? A property-management company in the area should have these aggregated.
- How much new apartment / multifamily construction is in the pipeline within 1–3 miles? Heavy new supply (>2% of stock underway) typically softens rents 12–24 months out; light construction supports rent growth.
Investment metrics
- 1% rule
- 1.20% ✓
- Cap rate
- 9.80%
- Cash-on-cash
- 12.52%
- DSCR
- 1.56
- GRM
- 6.9
CMA / ARV
- ARV (median comp)
- $124,240
- List price
- $149,900
- Delta
- 20.65%
- Verdict
- OVERPRICED
- Comps
- 20 within 1.0 mi
Show comp detail 4 sales within ~0.75 mi
| Address | Dist | Beds/Ba | Sqft | Sold | Price | $/sf | Match |
|---|---|---|---|---|---|---|---|
| 1143 Santee Ave | 0.08mi | 4/2.0 | 1,431 (-1%) | 14mo | $125,000 | $87 | 84 |
| 970 Concord Ave | 0.30mi | 4/2.0 | 1,440 (0%) | 17mo | $161,000 | $112 | 72 |
| 1196-1198 Welton Ave | 0.31mi | 4/2.0 | 1,440 (0%) | 21mo | $139,900 | $97 | 68 |
| 969-971 Reed Ave | 0.63mi | 4/2.0 | 1,488 (+3%) | 10mo | $105,000 | $71 | 57 |
Match score weights: distance 35% · size 25% · config 20% · recency 20%. Top-matched comps best support the ARV.
Projected returns pro-forma
-3.0% appreciation · 7.63% rent growth · sell at horizon
- IRR
- 7.2%
- Equity multiple
- 1.29×
- Total profit
- $12,359
- Equity at exit
- $22,351
- IRR
- 20.1%
- Equity multiple
- 3.05×
- Total profit
- $86,240
- Equity at exit
- $12,961
Cash invested: $41,972 (down + closing). Projections, not guarantees.
Landlord ↔ Tenant lean methodology
- Overall (STATE)
- 73 Landlord-Friendly
- State Ohio
- 73 Landlord-Friendly · R+6
- County
- — inherits STATE
- City
- — inherits STATE
ZIP-level market 44306
- Rents YoY
- 7.6%
- Active inventory
- 71
- Price-to-rent
- 13.9×
Monthly cashflow live
- Estimated rent
- $1,798 high interval (Pro) →
- Mortgage (P&I)
- −$786
- Tax from tax record
- −$134 /mo · $1,608/yr
- Insurance
- −$62
- HOA
- −$0
- Vacancy / Maint / Mgmt
- −$378
- Net cashflow
- $438
Break-even live
Sensitivity live
| Price | -10% $523 | -5% $480 | +0% $438 | +5% $395 | +10% $353 |
|---|---|---|---|---|---|
| Rent | -10% $296 | -5% $367 | +0% $438 | +5% $509 | +10% $580 |
| Rate | -1.0pp $513 | -0.5pp $476 | base $438 | +0.5pp $399 | +1.0pp $360 |
2-unit breakdown (identical units grouped — click to expand)
| Units | Beds | Baths | Est. rent |
|---|---|---|---|
| 2× units | 2 | 1 | $1,798 |
| #1 | 2 | 1 | $899 |
| #2 | 2 | 1 | $899 |
| Total (2 units) | $1,798 | ||
UW: 25.0% down · 7.5% · 30yr · 1.5% tax · 5.0% vac · 8.0% maint · 8.0% mgmt
Financing live
Cash to close
- Down payment
- $37,475
- Closing costs
- $4,497
- Reserves months
- —
- Total cash needed
- —
Loan-product check · same deal, 3 products live
Conventional
25% down · 7.5% · 30yr
- Down + closing
- —
- Monthly P&I
- —
- Monthly cashflow
- —
- DSCR
- —
- Eligible?
- —
Personal DTI + credit; lowest rate.
DSCR
20% down · 8.5% · 30yr
- Down + closing
- —
- Monthly P&I
- —
- Monthly cashflow
- —
- DSCR
- —
- Eligible?
- —
No personal income docs; deal must DSCR.
Hard money
10% down · 12.0% · 12mo
- Down + closing
- —
- Monthly P&I
- —
- Monthly cashflow
- —
- DSCR
- —
- Eligible?
- —
Short-term bridge; refi at stabilization.
Rent comps 37 comps
| Address | Beds | Baths | Sqft | Rent | $/sqft | DOM | Units | Dist |
|---|---|---|---|---|---|---|---|---|
| 571 Chittenden St Akron, OH | 3.0 | 1.0 | 982 | $1,200 | $1.22 | 45d | 1 | 0.19mi |
| 902 Cole Ave Akron, OH | 3.0 | 1.0 | 984 | $1,050 | $1.07 | 15d | 1 | 0.40mi |
| 497 Lucy St Akron, OH | 4.0 | 1.0 | 1600 | $1,500 | $0.94 | 45d | 1 | 0.46mi |
| 990 Baird St Akron, OH | 3.0 | 1.0 | 1140 | $1,250 | $1.10 | 45d | 1 | 0.48mi |
| 488 Alexander St Akron, OH | 4.0 | 2.0 | 1311 | $1,350 | $1.03 | 24d | 1 | 0.49mi |
| 516 Whitney Ave Akron, OH | 4.0 | 2.0 | 1676 | $1,500 | $0.89 | 45d | 1 | 0.52mi |
| 1125 Georgia Ave Akron, OH | 3.0 | 1.0 | 1060 | $1,300 | $1.23 | 15d | 1 | 0.59mi |
| 1182 5th Ave Akron, OH | 3.0 | 1.0 | 1248 | $1,250 | $1.00 | 15d | 1 | 0.64mi |
| 1078 Lindsay Ave Akron, OH | 3.0 | 2.0 | 1005 | $1,350 | $1.34 | 45d | 1 | 0.69mi |
| 1070 Super Genius Cir Akron, OH | 2.0–4.0 | 1.0–2.0 | 1145 | $1,429 | $1.25 | 15d | 1 | 0.74mi |
| 1204 Inman St Akron, OH | 3.0 | 1.0 | 1080 | $1,200 | $1.11 | 24d | 1 | 0.78mi |
| 1125 2nd Ave Akron, OH | 3.0 | 1.0 | 1373 | $1,100 | $0.80 | 24d | 1 | 0.84mi |
| 764 Lindsay Ave Akron, OH | 3.0 | 1.0 | 1000 | $1,295 | $1.29 | 15d | 1 | 0.91mi |
| 166 Chittenden St Akron, OH | 3.0 | 1.0 | 1020 | $985 | $0.97 | 45d | 1 | 0.96mi |
| 979 Neptune Ave Akron, OH | 3.0 | 1.0 | 1248 | $1,250 | $1.00 | 24d | 1 | 0.98mi |
| 1036 Neptune Ave Akron, OH | 3.0 | 1.0 | 1000 | $1,350 | $1.35 | 45d | 1 | 1.00mi |
| 1040 Neptune Ave Akron, OH | 4.0 | 1.0 | 1400 | $1,300 | $0.93 | 45d | 1 | 1.00mi |
| 1102 Neptune Ave Akron, OH | 3.0 | 1.0 | 1000 | $1,200 | $1.20 | 45d | 1 | 1.01mi |
| 1085 Herberich Ave Akron, OH | 4.0 | 1.0 | 1350 | $1,400 | $1.04 | 45d | 1 | 1.03mi |
| 1071 Ackley St Akron, OH | 4.0 | 2.0 | 1164 | $1,175 | $1.01 | 45d | 1 | 1.03mi |
| 1114 Herberich Ave Akron, OH | 4.0 | 1.0 | 1308 | $1,200 | $0.92 | 45d | 1 | 1.06mi |
| 878 Clark St Akron, OH | 3.0 | 2.0 | 1029 | $1,440 | $1.40 | 45d | 1 | 1.08mi |
| 1012 Brown St Akron, OH | 4.0 | 2.0 | 1518 | $1,295 | $0.85 | 45d | 1 | 1.17mi |
| 987 Boone St Akron, OH | 3.0 | 1.0 | 1248 | $1,100 | $0.88 | 24d | 1 | 1.19mi |
| 885 Brown St Akron, OH | 4.0 | 2.0 | 1280 | $1,400 | $1.09 | 24d | 1 | 1.20mi |
| 466 Adkins Ave Akron, OH | 4.0 | 1.5 | 1800 | $1,450 | $0.81 | 45d | 1 | 1.26mi |
| 1028 Kling St Akron, OH | 4.0 | 2.0 | 1500 | $1,450 | $0.97 | 45d | 1 | 1.28mi |
| 907 Kling St Akron, OH | 3.0 | 1.0 | 1248 | $1,250 | $1.00 | 15d | 1 | 1.28mi |
| 796 Brown St Akron, OH | 4.0 | 2.0 | 1200 | $900 | $0.75 | 45d | 1 | 1.28mi |
| 208 Barder Ave Akron, OH | 3.0 | 1.0 | 924 | $1,050 | $1.14 | 45d | 1 | 1.32mi |
| 1297 Pondview Ave Akron, OH | 4.0 | 1.0 | 1373 | $1,450 | $1.06 | 24d | 1 | 1.36mi |
| 344 Lease St Akron, OH | 3.0 | 1.0 | 1000 | $1,199 | $1.20 | 45d | 1 | 1.37mi |
| 373 N Firestone Blvd Akron, OH | 4.0 | 1.5 | 1590 | $1,550 | $0.97 | 45d | 1 | 1.42mi |
| 77 Kent Ct Akron, OH | 4.0 | 1.0 | 1300 | $1,200 | $0.92 | 45d | 1 | 1.44mi |
| 768 Beardsley St Akron, OH | 5.0 | 1.5 | 1714 | $1,500 | $0.88 | 15d | 1 | 1.45mi |
| 548 Spicer St Akron, OH | 4.0 | 2.0 | 1487 | $1,100 | $0.74 | 24d | 1 | 1.48mi |
| 1395 Goodyear Blvd Akron, OH | 3.0 | 1.5 | 1542 | $1,450 | $0.94 | 45d | 1 | 1.49mi |
Listing history 22 events
-
2026-06-21days on market $149,900 Active 44 DOM
-
2026-06-18days on market $149,900 Active 41 DOM
-
2026-06-17days on market $149,900 Active 40 DOM
-
2026-06-16days on market $149,900 Active 39 DOM
-
2026-06-15days on market $149,900 Active 38 DOM
-
2026-06-14days on market $149,900 Active 36 DOM
-
2026-06-13pricedays on market $149,900 Active 35 DOM
-
2026-06-10days on market $155,000 Active 33 DOM
-
2026-06-09days on market $155,000 Active 32 DOM
-
2026-06-08days on market $155,000 Active 31 DOM
-
2026-06-07days on market $155,000 Active 30 DOM
-
2026-06-05days on market $155,000 Active 27 DOM
-
2026-06-03days on market $155,000 Active 26 DOM
-
2026-06-02days on market $155,000 Active 25 DOM
-
2026-06-01days on market $155,000 Active 24 DOM
-
2026-05-31days on market $155,000 Active 23 DOM
-
2026-05-31days on market $155,000 Active 22 DOM
-
2026-05-08$155,000 Active 1278-char remark
-
2004-07-29soldstatus $56,000
-
2004-07-29soldstatus $56,000
-
2004-07-14historical
-
2004-04-07$54,900
ⓘ Source: listings_history table (triggers on properties + properties_extension) + one-shot
backfill from property_details.listing_events for pre-trigger history.
Tax reassessment forecast OH · Partial reset (capped growth)
- Current annual tax
- $1,608 · $134/mo
- Projected year-2 tax
- $1,973 · $164/mo
- Expected delta
- +$365/yr (+$30/mo · 22.7%)
ⓘ Screening estimate from a state-policy table — verify with the county assessor before closing.
Climate risk First Street
- Flood 1/10 Low FEMA zone X (unshaded) · 0% chance over 30 yrs
- Wildfire 1/10 Low
- Heat 3/10 Moderate 7 d/yr ≥96°F today · 17 d/yr by 30 yrs out
- Wind 1/10 Low
- Air quality 3/10 Moderate 2 unhealthy d/yr today · 4 by 30 yrs out
Nearby sold comps map
Loading sold comps map…
Walkable amenities ~0.75 mi
Loading nearby amenities…
Taxation est. · year 1
- Rental income
- $21,576
- − Mortgage interest
- −$8,397
- − Property taxes
- −$1,608
- − Insurance
- −$750
- − Repairs & maintenance
- −$1,726
- − Management
- −$1,726
- − Depreciation
- −$4,361
- Taxable income
- $3,009
- Est. tax owed @ 24.0%
- −$722
- After-tax cash flow
- $4,532/yr
For passive investors: Depreciation is non-cash, so a rental often shows a tax loss while cash-flowing — sheltering income. Rental losses are passive: they offset passive income freely, and up to $25,000/yr can offset ordinary (W-2) income if you actively participate and your MAGI is under $100k (phasing out to $0 by $150k); unused losses carry forward. On sale, claimed depreciation is recaptured at up to 25%, and gains may owe capital-gains tax (a 1031 exchange can defer both). Figures are a year-1 estimate at your 24.0% rate — not tax advice; consult a CPA.
Schools (NCES district)
- District
- Akron City
- NCES district ID
- 3904348
- Math proficiency
- 22% ▼ -17.00%
- Reading proficiency
- 30% ▼ -12.00%
- Median HH income
- $33,811
- Composite
- 21.31/100
- National rank
- #8383
- State rank
- #602 of 656 in OH
Livability — Akron
- Score
- 81/100
- State rank
- #104
- US rank
- #1591
Category grades
Schools grade is shown separately in the Schools card above.
Census & demographics
- Census place
- Akron, OH
- County
- Summit County · 440,783 people
- City population
- 174,375
- Metro
- Akron, OH
- Population (ZIP)
- 20,905
- Household income
- $41,688
- Rent vs Own
- Severe rent burden
- 1251.0
Population outlook (Summit County) Hauer SSP2
- Today (2025)
- 546,583 people
- By 2030
- 544,028 · -0.5%
- By 2040
- 531,363 · -2.8%
- By 2050
- 514,923 · -5.8%
- By 2075
- 481,765 · -11.9%
- By 2100
- 432,265 · -20.9%
Race, ethnicity, and origin ACS 2023
- Neighborhood character
- Diverse neighborhood (Simpson 0.62)
- Race & ethnicity
- White 48% Black 38% Two or more races 8% Hispanic / Latino 3% Asian 2%
- Common ancestry
- Lithuanian 2% Iranian 1% Scotch-Irish 1%
- Foreign-born
- 4% · Vietnam, Canada, Philippines
- Languages at home
- 94% English-only · Spanish 2% Other Asian/Pacific 1% Vietnamese 1%
Political lean MEDSL · Summit
- 2024 margin
- Lean D (+7.0) · D 53.0% · R 46.0%
- 2008→2024 swing
- -9.6pp toward R · 2008: 16.6pp · 2024: 7.0pp
- All cycles
- 2024: D+7.0 2020: D+9.6 2016: D+8.2 2012: D+14.8 2008: D+16.6
Not yet ingested
- Civics
- —
Market trends
- HPI YoY
- ▼ -101.46%
- Current HPI
- 132.768
- Rent YoY
- ▲ 7.63%
- Metro
- Akron, OH
- State GDP YoY
- ▲ 1.98%
- F500 in state
- 48
Industry mix (Fortune 500 HQ in OH)
| Industry | F500 HQs | Revenue |
|---|---|---|
| Insurance | 3 | $145B |
|
||
| Industrial Machinery | 3 | $49B |
|
||
| Financial Services | 3 | $24B |
|
||
| Consumer Goods | 2 | $93B |
|
||
| Aerospace / Defense | 2 | $47B |
|
||
| Utilities | 2 | $33B |
|
||
Price history
+173.0% since first listed6 events — show timeline
- 2026-06-10 Price Changed $149,900 MLSNOW
- 2026-05-08 Listed $155,000 MLSNOW
- 2004-07-29 Sold (Public Records) $56,000 Public Records
- 2004-07-29 Sold (Public Records) $56,000 Public Records
- 2004-07-14 Listing Removed — MLSNOW
- 2004-04-07 Listed $54,900 MLSNOW
Property tax history
+3.1%/yrLatest (2025): $1,608 · -19.0% YoY. Source: county tax records.
Cash-flow waterfall
monthlySold comps — $/sqft
last 12 mo · ≤1 miLoading sold comps…