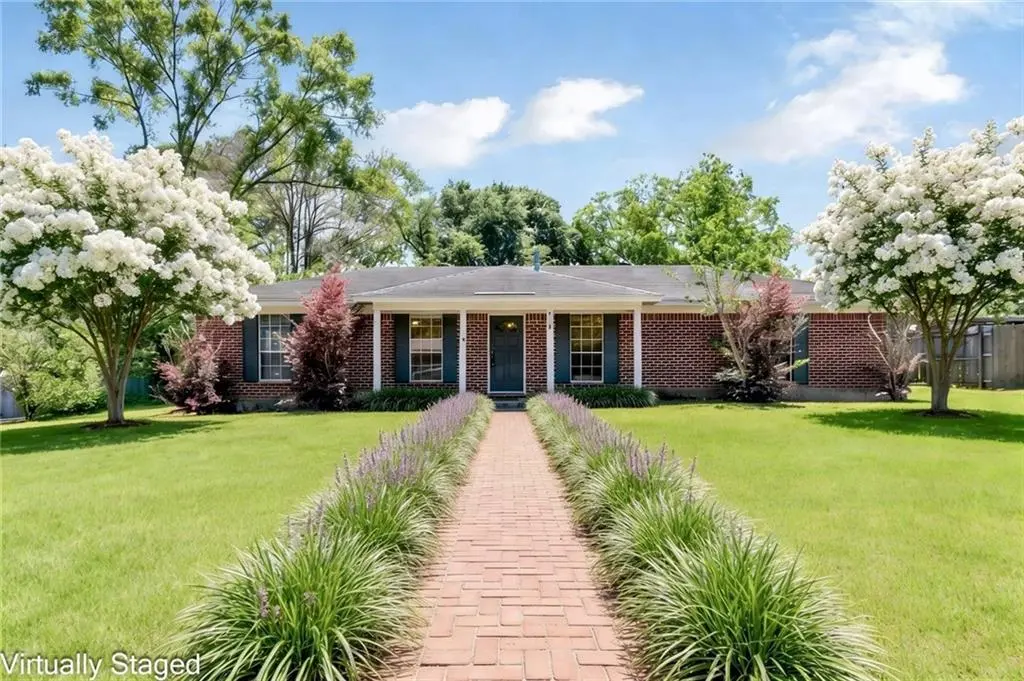
8133 Oak Ave · Semmes, AL
Flood risk 1/10 · Minimal
- FEMA flood zone
- X (unshaded)
- Chance of flooding over 30 yrs
- 0.0%
- Est. flood insurance / yr
- $507 – $1,088
Fire risk 5/10 · Moderate
- Est. fire insurance / yr
- $916 – $1,700
Heat risk 9/10 · Severe
- Hot days now (above 106°F)
- 7 days/yr
- Hot days in 30 yrs
- 20 days/yr
Wind risk 9/10 · Severe
- Chance of severe wind over 30 yrs
- 99.0%
Air-quality risk 1/10 · Minimal
- Unhealthy air days now
- 0 days/yr
- Unhealthy air days in 30 yrs
- 0 days/yr
Risk factors via First Street. Map © Google.
Why this score? — see what drove the D- grade
The composite is a weighted blend of 9 inputs, each scored 0–100. Each bar is that input's sub-score; the figure is the points it added to the 100-point composite (weight × sub-score).
- ARV discount +13.0/15.0
- Cash flow +11.3/30.0
- DSCR +3.3/10.0
- Livability +3.0/5.0
- Rent growth +2.5/5.0
- Condition / age +2.5/5.0
- Schools +2.3/10.0
- 1% rule +2.0/10.0
- Appreciation +0.0/10.0
$215,000
🖨 Deal sheet 📄 Offer letter ✓ Due diligence
Listing remarks
Conveniently located near shopping, restaurants, and major roadways while still offering a more peaceful setting, this property checks many of the boxes Buyers are searching for — brick home, fenced yard, spacious lot, large kitchen/breakfast area, and affordable price point. Located in a USDA eligible area, qualified Buyers may be able to obtain 100% financing with $0 down payment. Buyer to verify eligibility with lender. This 3-bedroom, 2-bath home offers approximately 1,672 square feet of living space with a spacious living room, oversized kitchen with lots countertop space, large dining area, and a generously sized laundry room. The fenced backyard offers plenty of room for pets,
Key facts
- 0.52 acre lot
- 4 parking spots
- Built 1990
Property features AI
Exterior
- Parking: Parking for 4 vehicles; Driveway; Level driveway
- Utilities: Electricity available (110V and 220V); Natural gas available; Water available; Septic tank sewer
- Home design: Single family residence; Residential property; Subdivision: Crestwood Estates; View available
- Construction: Brick 4 sides construction; Built in 1990; Slab foundation; Shingle roof
- Exterior features: No notable exterior features listed; Back yard fencing; Chain link fence; Fenced yard
Interior
- Kitchen: Dishwasher; Electric range; Microwave; Breakfast bar; Stained cabinets; Eat-in kitchen; Laminate counters; Pantry
- Bedrooms: 3 bedrooms
- Flooring: Brick; Ceramic tile; Other
- Bathrooms: 2 full bathrooms
- Heating & cooling: Natural gas heating; Central air conditioning
- Interior features: Other
- Laundry & utility: Gas water heater
Neighborhood map
What this means for you Summary
Snapshot
- This is a 3-bed/2.0-bath single-family listed at $215k.
Deal economics
- At list price, monthly cash flow is $-77 ($-925/yr) — negative.
- To cash-flow at today's rent, offer at most $201k (6.3% below list).
- To meet the 1% rule (rent ≥ 1% of price), the offer needs to be $150k (30.2% below list).
- Recommended offer: $150k (30.2% below list) — sets the bar for 1% rule.
Location & tenants
- Location reads 60/100 on livability (#311 in AL) — a middle-class / working-renter tenant base. Strengths: cost of living A+, housing A+; Watch: crime F, amenities F, commute F.
- Mobile County (urban): math 15% / reading 39% proficiency, ranked #81 of 129 in AL (top 63%) — low school quality limits family demand, transient renter base, plan for 1-2y turnover; 67% free/reduced lunch — lower-income household profile, screen leases tightly.
- Zoned schools: Allentown Elementary School (math 31% / reading 59%, grade D-, #169 of 627 statewide, top 27%, 776 students, 53% FRL); Mary G Montgomery High School (math 13% / reading 18%, grade F, #211 of 305 statewide, top 69%, 1,965 students, 53% FRL).
- Market conditions: 184 active listings in the ZIP; 1 comparable units currently listed for rent nearby; 1,678 units permitted in Mobile County in 2024 (264 in 5+ unit buildings).
Forward outlook
- Local home prices are declining (-3.0%/yr); year-one equity from $1k of loan paydown is wiped out by about $6k of value loss. Plan a longer hold.
- Mobile County population projected to shrink 8% by 2050 — rents likely to lag national; underwrite the cash flow, not the appreciation.
Negotiation context
- It's been on market 43 days — a 3% lower offer ($209k) is reasonable based on typical stale-listing flexibility.
- Current owner paid $125k; list at $215k implies a 73% gain — meaningful room to come down on a strong offer.
Risks & watch-outs
- Climate carrying-cost: severe wind risk, 99% chance of damaging wind over 30y; moderate wildfire risk; extreme-heat days projected 7→20/yr by 2055 (HVAC capex compounding) — expect insurance premiums to compound above CPI over the hold.
Questions for the listing agent
- What do current leases actually rent for vs. the listed asking? Can we see a recent rent roll and the last 12 months of T-12 income?
- It's been on market 43 days. Have you received any prior offers? Is the seller open to a 30% concession, seller financing, or rate buy-down credit?
- Is there a deadline driving the sale (1031 exchange, divorce, estate, relocation)? That informs how much negotiation room exists.
- Schools are D-rated, which usually means shorter tenancies and higher turnover. Who's the typical renter profile here, and what's been the actual vacancy rate?
- Crime grade is F in this area — have there been break-ins, vandalism, or insurance claims at this property in the last 3 years? What carrier currently insures it and at what premium?
- The area grade is low — what's the realistic commute time and amenity access for the typical tenant pool here? Any planned neighborhood developments (good or bad) we should know about?
- What's the average days-on-market for RENTAL listings here right now (not sales)? A rising rental-DOM trend means longer vacancies and softer asking-rent achievability than the comps imply.
- What's the recent tenant-quality profile in this submarket — average credit score on applications, eviction rate, late-payment / NSF rate, and stable-employment percentage? A property-management company in the area should have these aggregated.
- How much new for-sale + rental construction is in the pipeline within 1–3 miles? Heavy new supply typically softens prices + rents 12–24 months out; constrained supply supports both.
Investment metrics
- 1% rule
- 0.70% ✗
- Cap rate
- 5.86%
- Cash-on-cash
- -1.54%
- DSCR
- 0.93
- GRM
- 11.9
CMA / ARV
- ARV (median comp)
- $245,214
- List price
- $215,000
- Delta
- -12.32%
- Verdict
- UNDERPRICED
- Comps
- 20 within 1.0 mi
Show comp detail 11 sales within ~0.75 mi
| Address | Dist | Beds/Ba | Sqft | Sold | Price | $/sf | Match |
|---|---|---|---|---|---|---|---|
| 3375 Shenandoah Trl | 0.21mi | 3/2.0 | 1,695 (-2%) | 1mo | $229,900 | $136 | 86 |
| 3435 Shenandoah Trl | 0.27mi | 3/2.0 | 1,658 (-4%) | 3mo | $210,000 | $127 | 78 |
| 8235 BLUE RIDGE Pl | 0.18mi | 3/2.5 | 1,926 (+12%) | 1mo | $260,000 | $135 | 70 |
| 3325 Shenandoah Trl | 0.19mi | 3/2.0 | 1,532 (-11%) | 7mo | $235,000 | $153 | 67 |
| 3224 Dubose Ave | 0.24mi | 3/2.0 | 1,519 (-12%) | 3mo | $237,000 | $156 | 66 |
| 3281 Dubose Ave | 0.26mi | 3/2.0 | 1,614 (-6%) | 14mo | $225,000 | $139 | 66 |
| 3381 Dubose Ave | 0.31mi | 3/2.0 | 1,566 (-9%) | 10mo | $226,000 | $144 | 62 |
| 3082 Sasanqua Cir W | 0.49mi | 3/2.0 | 1,700 (-1%) | 19mo | $255,000 | $150 | 59 |
| 3220 Macarson Cir | 0.63mi | 4/2.0 (+1) | 1,675 (-3%) | 3mo | $275,000 | $164 | 59 |
| 2980 Kissi Ct | 0.52mi | 3/2.0 | 1,540 (-11%) | 13mo | $240,000 | $156 | 47 |
| 3025 Sasanqua Cir S | 0.54mi | 3/2.0 | 1,849 (+7%) | 20mo | $265,000 | $143 | 46 |
Match score weights: distance 35% · size 25% · config 20% · recency 20%. Top-matched comps best support the ARV.
Projected returns pro-forma
-3.0% appreciation · 3.0% rent growth · sell at horizon
- IRR
- -18.9%
- Equity multiple
- 0.34×
- Total profit
- $-39,864
- Equity at exit
- $32,057
- IRR
- -11.6%
- Equity multiple
- 0.31×
- Total profit
- $-41,501
- Equity at exit
- $18,589
Cash invested: $60,200 (down + closing). Projections, not guarantees.
Landlord ↔ Tenant lean methodology
- Overall (STATE)
- 90 Strongly Landlord-Friendly
- State Alabama
- 90 Strongly Landlord-Friendly · R+15
- County
- — inherits STATE
- City
- — inherits STATE
ZIP-level market 36575
- Home prices YoY
- -21.8%
- Active inventory
- 184
- Price-to-rent
- 11.9×
Monthly cashflow live
- Estimated rent
- $1,500 medium interval (Pro) →
- Mortgage (P&I)
- −$1,127
- Tax from tax record
- −$45 /mo · $540/yr
- Insurance
- −$90
- HOA
- −$0
- Vacancy / Maint / Mgmt
- −$315
- Net cashflow
- $-77
Break-even live
UW: 25.0% down · 7.5% · 30yr · 1.5% tax · 5.0% vac · 8.0% maint · 8.0% mgmt
Financing live
Cash to close
- Down payment
- $53,750
- Closing costs
- $6,450
- Reserves months
- —
- Total cash needed
- —
Loan-product check · same deal, 3 products live
Conventional
25% down · 7.5% · 30yr
- Down + closing
- —
- Monthly P&I
- —
- Monthly cashflow
- —
- DSCR
- —
- Eligible?
- —
Personal DTI + credit; lowest rate.
DSCR
20% down · 8.5% · 30yr
- Down + closing
- —
- Monthly P&I
- —
- Monthly cashflow
- —
- DSCR
- —
- Eligible?
- —
No personal income docs; deal must DSCR.
Hard money
10% down · 12.0% · 12mo
- Down + closing
- —
- Monthly P&I
- —
- Monthly cashflow
- —
- DSCR
- —
- Eligible?
- —
Short-term bridge; refi at stabilization.
Rent comps 1 comps
| Address | Beds | Baths | Sqft | Rent | $/sqft | DOM | Units | Dist |
|---|---|---|---|---|---|---|---|---|
| 3475 Denmark Rd Unit A Mobile, AL | 2.0 | 2.5 | 1100 | $1,500 | $1.36 | 43d | 1 | 0.77mi |
Listing history 20 events
-
2026-06-19status $215,000 Pending 43 DOM
-
2026-06-18days on market $215,000 Active 43 DOM
-
2026-06-17days on market $215,000 Active 42 DOM
-
2026-06-16days on market $215,000 Active 41 DOM
-
2026-06-15days on market $215,000 Active 40 DOM
-
2026-06-14days on market $215,000 Active 38 DOM
-
2026-06-13days on market $215,000 Active 37 DOM
-
2026-06-10days on market $215,000 Active 35 DOM
-
2026-06-09pricedays on market $215,000 Active 34 DOM
-
2026-06-08days on market $225,000 Active 33 DOM
-
2026-06-07days on market $225,000 Active 32 DOM
-
2026-06-05days on market $225,000 Active 29 DOM
-
2026-06-03days on market $225,000 Active 28 DOM
-
2026-06-02days on market $225,000 Active 27 DOM
-
2026-06-01days on market $225,000 Active 26 DOM
-
2026-05-31days on market $225,000 Active 25 DOM
-
2026-05-30days on market $225,000 Active 24 DOM
-
2026-05-11price $225,000 1198-char remark
-
2026-05-06$240,000 Active 1198-char remark
-
2018-06-06soldstatus $124,600
ⓘ Source: listings_history table (triggers on properties + properties_extension) + one-shot
backfill from property_details.listing_events for pre-trigger history.
Tax reassessment forecast AL · Resets to sale price
- Current annual tax
- $540 · $45/mo
- Projected year-2 tax
- $882 · $73/mo
- Expected delta
- +$341/yr (+$28/mo · 63.2%)
ⓘ Screening estimate from a state-policy table — verify with the county assessor before closing.
Climate risk First Street
- Flood 1/10 Low FEMA zone X (unshaded) · 0% chance over 30 yrs
- Wildfire 5/10 Major
- Heat 9/10 Extreme 7 d/yr ≥106°F today · 20 d/yr by 30 yrs out
- Wind 9/10 Extreme 99% chance of damaging wind over 30 yrs
- Air quality 1/10 Low 0 unhealthy d/yr today · 0 by 30 yrs out
Nearby sold comps map
Loading sold comps map…
Walkable amenities ~0.75 mi
Loading nearby amenities…
Taxation est. · year 1
- Rental income
- $18,000
- − Mortgage interest
- −$12,043
- − Property taxes
- −$540
- − Insurance
- −$1,075
- − Repairs & maintenance
- −$1,440
- − Management
- −$1,440
- − Depreciation
- −$6,255
- Taxable loss
- −$4,793
- Est. tax savings @ 24.0%
- +$1,150
- After-tax cash flow
- $225/yr
For passive investors: Depreciation is non-cash, so a rental often shows a tax loss while cash-flowing — sheltering income. Rental losses are passive: they offset passive income freely, and up to $25,000/yr can offset ordinary (W-2) income if you actively participate and your MAGI is under $100k (phasing out to $0 by $150k); unused losses carry forward. On sale, claimed depreciation is recaptured at up to 25%, and gains may owe capital-gains tax (a 1031 exchange can defer both). Figures are a year-1 estimate at your 24.0% rate — not tax advice; consult a CPA.
Schools (NCES district)
- District
- Mobile County
- NCES district ID
- 0102370
- Math proficiency
- 15% ▼ -28.00%
- Reading proficiency
- 39% ▬ 0.00%
- Median HH income
- $42,455
- Composite
- 22.9/100
- National rank
- #8002
- State rank
- #81 of 129 in AL
Livability — Semmes
- Score
- 60/100
- State rank
- #311
- US rank
- #19360
Category grades
Schools grade is shown separately in the Schools card above.
Census & demographics
- Census place
- Semmes, AL
- Population (ZIP)
- 22,444
Population outlook (Mobile County) Hauer SSP2
- Today (2025)
- 415,303 people
- By 2030
- 411,755 · -0.9%
- By 2040
- 399,670 · -3.8%
- By 2050
- 382,616 · -7.9%
- By 2075
- 337,353 · -18.8%
- By 2100
- 283,391 · -31.8%
Race, ethnicity, and origin ACS 2023
- Neighborhood character
- Predominantly White (73%)
- Race & ethnicity
- White 73% Black 19% Hispanic / Latino 5% Two or more races 3%
- Common ancestry
- Lithuanian 2% Slovak 2% Serbian 2%
- Foreign-born
- 2% · Canada, Vietnam
- Languages at home
- 97% English-only · Spanish 2% Vietnamese 1%
Political lean MEDSL · Mobile
- 2024 margin
- R (+16.4) · D 41.3% · R 57.7%
- 2008→2024 swing
- -7.7pp toward R · 2008: -8.7pp · 2024: -16.4pp
- All cycles
- 2024: R+16.4 2020: R+11.9 2016: R+13.9 2012: R+9.3 2008: R+8.7
Not yet ingested
- Civics
- —
Market trends
- HPI YoY
- ▼ -60.58%
- Current HPI
- 217.5112
- Rent YoY
- —
- Metro
- —
- State GDP YoY
- ▲ 2.94%
- F500 in state
- 4
Industry mix (Fortune 500 HQ in AL)
| Industry | F500 HQs | Revenue |
|---|---|---|
| Financial Services | 1 | $8B |
|
||
| Healthcare | 1 | $5B |
|
||
Price history
+72.6% since first listed4 events — show timeline
- 2026-06-09 Price Changed $215,000 GCMLS AL
- 2026-05-11 Price Changed $225,000 GCMLS AL
- 2026-05-06 Listed $240,000 GCMLS AL
- 2018-06-06 Sold (Public Records) $124,600 Public Records
Property tax history
+2.7%/yrLatest (2025): $540 · +5.3% YoY. Source: county tax records.
Cash-flow waterfall
monthlySold comps — $/sqft
last 12 mo · ≤1 miLoading sold comps…