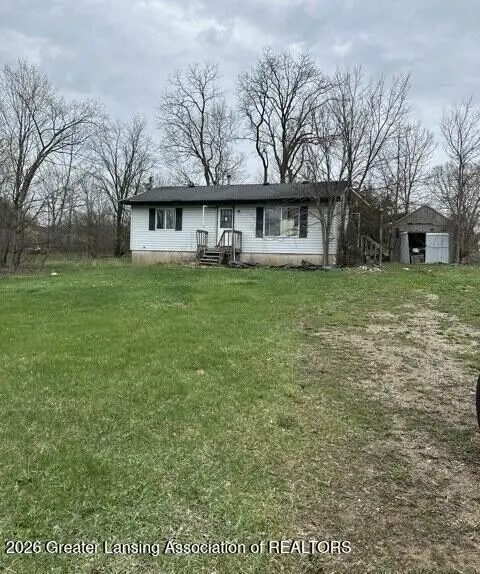
3080 W Needmore Hwy · Mulliken, MI
Flood risk 1/10 · Minimal
- FEMA flood zone
- X (unshaded)
- Chance of flooding over 30 yrs
- 0.0%
- Est. flood insurance / yr
- $473 – $860
Fire risk 1/10 · Minimal
- Est. fire insurance / yr
- $784 – $1,456
Heat risk 2/10 · Minimal
- Hot days now (above 97°F)
- 7 days/yr
- Hot days in 30 yrs
- 15 days/yr
Wind risk 2/10 · Minimal
- Chance of severe wind over 30 yrs
- —
Air-quality risk 2/10 · Minimal
- Unhealthy air days now
- 1 days/yr
- Unhealthy air days in 30 yrs
- 2 days/yr
Risk factors via First Street. Map © Google.
Why this score? — see what drove the B- grade
The composite is a weighted blend of 9 inputs, each scored 0–100. Each bar is that input's sub-score; the figure is the points it added to the 100-point composite (weight × sub-score).
- Cash flow +30.0/30.0
- DSCR +10.0/10.0
- 1% rule +9.0/10.0
- ARV discount +7.5/15.0
- Livability +3.2/5.0
- Schools +3.1/10.0
- Rent growth +2.5/5.0
- Condition / age +2.5/5.0
- Appreciation +0.0/10.0
$81,407
🖨 Deal sheet 📄 Offer letter ✓ Due diligence
Listing remarks MLS
Welcome to 3080 W Needmore! This 1988 built ranch style home features a full basement and is nestled on 1 acre in Charlotte schools! Please submit all offers to My Next Bid.
Key facts
- Full basement
- 1 acre
- 1 acre lot
Tags
Property features AI
Exterior
- Parking: No attached garage; No designated parking
- Utilities: Septic tank
- Home design: Single-story home (One level); Built in 1988
- Construction: Vinyl siding
- Exterior features: Shingle roof; Shed on property; Approximately 1.0 acre lot
Interior
- Kitchen: Kitchen
- Bedrooms: 3 bedrooms (includes Primary Bedroom)
- Bathrooms: 1 full bathroom
- Heating & cooling: Forced air heating; No central cooling
- Interior features: Full basement; Porch
- Laundry & utility: Laundry in basement
Neighborhood map
What this means for you Summary
Snapshot
- This is a 3-bed/1.0-bath single-family listed at $81k.
Deal economics
- At list price, monthly cash flow is $325 ($4k/yr) — positive.
- The deal already cash-flows at list — no discount required.
- Meets the 1% rule at list price ($1k rent vs $81k).
Location & tenants
- Location reads 65/100 on livability (#466 in MI) — a middle-class / working-renter tenant base. Strengths: cost of living A+, housing A+; Watch: crime D+, schools F, amenities F.
- Charlotte Public Schools (town): math 31% / reading 40% proficiency, ranked #261 of 540 in MI (top 48%) — families likely to look elsewhere, expect single-tenant / working-renter base with shorter leases.
- Market conditions: 97 active listings in the ZIP; 98 units permitted in Eaton County in 2024 (0 in 5+ unit buildings).
Forward outlook
- Local home prices are declining (-3.0%/yr); year-one equity from $563 of loan paydown is wiped out by about $2k of value loss. Plan a longer hold.
- Eaton County population projected to shrink 5% by 2050 — rents likely to lag national; underwrite the cash flow, not the appreciation.
- At projected returns (-3.0% appreciation + 3.0% rent growth), your $23k cash investment doubles in ~7 years — after that, you're playing with house money.
Negotiation context
- Only 14 days on market — expect competitive offers; lowballing is unlikely to land.
- 2 sale attempts with the ask held roughly flat each time — persistent listings suggest the price (not the market) is what's stuck; bring a comps-based counter.
Questions for the listing agent
- Is there a deadline driving the sale (1031 exchange, divorce, estate, relocation)? That informs how much negotiation room exists.
- Schools are F-rated, which usually means shorter tenancies and higher turnover. Who's the typical renter profile here, and what's been the actual vacancy rate?
- Crime grade is D in this area — have there been break-ins, vandalism, or insurance claims at this property in the last 3 years? What carrier currently insures it and at what premium?
- What's the average days-on-market for RENTAL listings here right now (not sales)? A rising rental-DOM trend means longer vacancies and softer asking-rent achievability than the comps imply.
- What's the recent tenant-quality profile in this submarket — average credit score on applications, eviction rate, late-payment / NSF rate, and stable-employment percentage? A property-management company in the area should have these aggregated.
- How much new for-sale + rental construction is in the pipeline within 1–3 miles? Heavy new supply typically softens prices + rents 12–24 months out; constrained supply supports both.
Investment metrics
- 1% rule
- 1.40% ✓
- Cap rate
- 11.08%
- Cash-on-cash
- 17.10%
- DSCR
- 1.76
- GRM
- 5.9
CMA / ARV
- ARV (median comp)
- $247,299
- List price
- $81,407
- Delta
- -67.08%
- Verdict
- UNDERPRICED
- Comps
- 1 within 2.0 mi
Projected returns pro-forma
-3.0% appreciation · 3.0% rent growth · sell at horizon
- IRR
- 8.4%
- Equity multiple
- 1.33×
- Total profit
- $7,522
- Equity at exit
- $12,138
- IRR
- 17.7%
- Equity multiple
- 2.46×
- Total profit
- $33,293
- Equity at exit
- $7,039
Cash invested: $22,794 (down + closing). Projections, not guarantees.
Landlord ↔ Tenant lean methodology
- Overall (STATE)
- 62 Landlord-Friendly
- State Michigan
- 62 Landlord-Friendly · EVEN
- County
- — inherits STATE
- City
- — inherits STATE
ZIP-level market 48813
- Active inventory
- 97
- Price-to-rent
- 5.9×
Monthly cashflow live
- Estimated rent
- $1,140 medium interval (Pro) →
- Mortgage (P&I)
- −$427
- Tax from tax record
- −$115 /mo · $1,382/yr
- Insurance
- −$34
- HOA
- −$0
- Vacancy / Maint / Mgmt
- −$239
- Net cashflow
- $325
Break-even live
UW: 25.0% down · 7.5% · 30yr · 1.5% tax · 5.0% vac · 8.0% maint · 8.0% mgmt
Financing live
Cash to close
- Down payment
- $20,352
- Closing costs
- $2,442
- Reserves months
- —
- Total cash needed
- —
Loan-product check · same deal, 3 products live
Conventional
25% down · 7.5% · 30yr
- Down + closing
- —
- Monthly P&I
- —
- Monthly cashflow
- —
- DSCR
- —
- Eligible?
- —
Personal DTI + credit; lowest rate.
DSCR
20% down · 8.5% · 30yr
- Down + closing
- —
- Monthly P&I
- —
- Monthly cashflow
- —
- DSCR
- —
- Eligible?
- —
No personal income docs; deal must DSCR.
Hard money
10% down · 12.0% · 12mo
- Down + closing
- —
- Monthly P&I
- —
- Monthly cashflow
- —
- DSCR
- —
- Eligible?
- —
Short-term bridge; refi at stabilization.
Listing history 4 events
-
2026-05-07status Pending 173-char remark
Show marketing remark (173 chars)
Welcome to 3080 W Needmore! This 1988 built ranch style home features a full basement and is nestled on 1 acre in Charlotte schools! Please submit all offers to My Next Bid.
-
2026-05-07status Pending 173-char remark
Show marketing remark (173 chars)
Welcome to 3080 W Needmore! This 1988 built ranch style home features a full basement and is nestled on 1 acre in Charlotte schools! Please submit all offers to My Next Bid.
-
2026-04-22$81,407 Active 173-char remark
Show marketing remark (173 chars)
Welcome to 3080 W Needmore! This 1988 built ranch style home features a full basement and is nestled on 1 acre in Charlotte schools! Please submit all offers to My Next Bid.
-
2026-04-22$81,407 Active 173-char remark
Show marketing remark (173 chars)
Welcome to 3080 W Needmore! This 1988 built ranch style home features a full basement and is nestled on 1 acre in Charlotte schools! Please submit all offers to My Next Bid.
ⓘ Source: listings_history table (triggers on properties + properties_extension) + one-shot
backfill from property_details.listing_events for pre-trigger history.
Tax reassessment forecast MI · Partial reset (capped growth)
- Current annual tax
- $1,382 · $115/mo
- Projected year-2 tax
- $1,382 · $115/mo
- Expected delta
- $0/yr ($0/mo · 0.0%)
ⓘ Screening estimate from a state-policy table — verify with the county assessor before closing.
Climate risk First Street
- Flood 1/10 Low FEMA zone X (unshaded) · 0% chance over 30 yrs
- Wildfire 1/10 Low
- Heat 2/10 Low 7 d/yr ≥97°F today · 15 d/yr by 30 yrs out
- Wind 2/10 Low
- Air quality 2/10 Low 1 unhealthy d/yr today · 2 by 30 yrs out
Nearby sold comps map
Loading sold comps map…
Walkable amenities ~0.75 mi
Loading nearby amenities…
Taxation est. · year 1
- Rental income
- $13,684
- − Mortgage interest
- −$4,560
- − Property taxes
- −$1,382
- − Insurance
- −$407
- − Repairs & maintenance
- −$1,095
- − Management
- −$1,095
- − Depreciation
- −$2,368
- Taxable income
- $2,777
- Est. tax owed @ 24.0%
- −$666
- After-tax cash flow
- $3,231/yr
For passive investors: Depreciation is non-cash, so a rental often shows a tax loss while cash-flowing — sheltering income. Rental losses are passive: they offset passive income freely, and up to $25,000/yr can offset ordinary (W-2) income if you actively participate and your MAGI is under $100k (phasing out to $0 by $150k); unused losses carry forward. On sale, claimed depreciation is recaptured at up to 25%, and gains may owe capital-gains tax (a 1031 exchange can defer both). Figures are a year-1 estimate at your 24.0% rate — not tax advice; consult a CPA.
Schools (NCES district)
- District
- Charlotte Public Schools
- NCES district ID
- 2608770
- Math proficiency
- 31% ▼ -9.00%
- Reading proficiency
- 40% ▼ -7.00%
- Median HH income
- $54,722
- Composite
- 31.18/100
- National rank
- #6048
- State rank
- #261 of 540 in MI
Livability — Mulliken
- Score
- 65/100
- State rank
- #466
- US rank
- #13269
Category grades
Schools grade is shown separately in the Schools card above.
Census & demographics
- Population (ZIP)
- 20,263
Population outlook (Eaton County) Hauer SSP2
- Today (2025)
- 110,811 people
- By 2030
- 110,598 · -0.2%
- By 2040
- 108,304 · -2.3%
- By 2050
- 104,961 · -5.3%
- By 2075
- 97,197 · -12.3%
- By 2100
- 85,150 · -23.2%
Race, ethnicity, and origin ACS 2023
- Neighborhood character
- Predominantly White (89%)
- Race & ethnicity
- White 89% Two or more races 6% Hispanic / Latino 5% Black 1%
- Common ancestry
- Romanian 5% Lithuanian 3% Iranian 3%
- Foreign-born
- 1% · Canada
- Languages at home
- 96% English-only · Spanish 1% German/W. Germanic 1%
Political lean MEDSL · Eaton
- 2024 margin
- Toss-up / Even · D 47.6% · R 50.8% · Other 1.6%
- 2008→2024 swing
- -11.6pp toward R · 2008: 8.4pp · 2024: -3.1pp
- All cycles
- 2024: R+3.1 2020: R+0.8 2016: R+5.5 2012: D+3.1 2008: D+8.4
Not yet ingested
- Civics
- —
Market trends
- HPI YoY
- ▼ -194.48%
- Current HPI
- 183.0171
- Rent YoY
- —
- Metro
- —
- State GDP YoY
- ▲ 1.37%
- F500 in state
- 28
Industry mix (Fortune 500 HQ in MI)
| Industry | F500 HQs | Revenue |
|---|---|---|
| Automotive Parts | 3 | $48B |
|
||
| Automotive | 2 | $372B |
|
||
| Chemicals | 1 | $45B |
|
||
| Automotive Retail | 1 | $29B |
|
||
| Healthcare / Medical Devices | 1 | $23B |
|
||
| Automotive Technology | 1 | $20B |
|
||
Price history
+0.0% since first listed4 events — show timeline
- 2026-05-07 Pending — REALCOMP
- 2026-05-07 Pending — Greater Lansing AoR
- 2026-04-22 Listed $81,407 Greater Lansing AoR
- 2026-04-22 Listed $81,407 REALCOMP
Property tax history
+3.6%/yrLatest (2025): $1,382 · +3.3% YoY. Source: county tax records.
Cash-flow waterfall
monthlySold comps — $/sqft
last 12 mo · ≤1 miLoading sold comps…