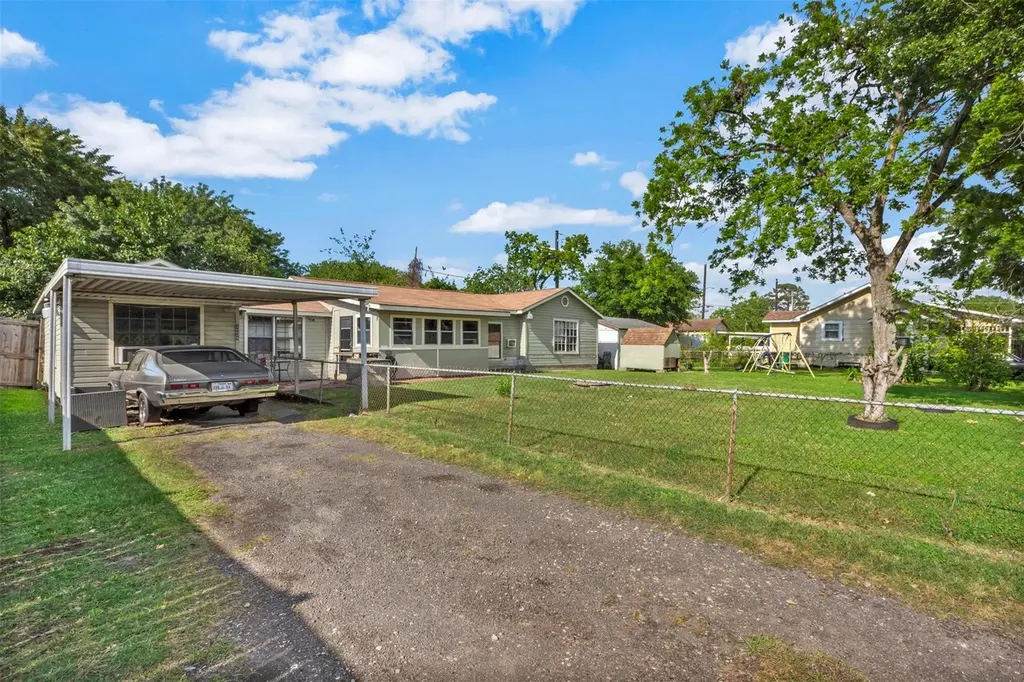
808 Morrell St · Baytown, TX
Flood risk 5/10 · Moderate
- FEMA flood zone
- X (unshaded)
- Chance of flooding over 30 yrs
- 0.26%
- Est. flood insurance / yr
- $507 – $1,088
Fire risk 1/10 · Minimal
- Est. fire insurance / yr
- $1,222 – $2,270
Heat risk 10/10 · Severe
- Hot days now (above 109°F)
- 7 days/yr
- Hot days in 30 yrs
- 27 days/yr
Wind risk 9/10 · Severe
- Chance of severe wind over 30 yrs
- 99.0%
Air-quality risk 2/10 · Minimal
- Unhealthy air days now
- 1 days/yr
- Unhealthy air days in 30 yrs
- 2 days/yr
Risk factors via First Street. Map © Google.
Why this score? — see what drove the C+ grade
The composite is a weighted blend of 9 inputs, each scored 0–100. Each bar is that input's sub-score; the figure is the points it added to the 100-point composite (weight × sub-score).
- Cash flow +23.5/30.0
- ARV discount +15.0/15.0
- DSCR +7.6/10.0
- 1% rule +6.1/10.0
- Livability +3.5/5.0
- Schools +3.2/10.0
- Rent growth +2.8/5.0
- Condition / age +2.5/5.0
- Appreciation +0.0/10.0
$110,000
🖨 Deal sheet 📄 Offer letter ✓ Due diligence
Listing remarks MLS
This charming cozy house features three bedrooms and two bathrooms. With a generous lot, there plenty of room for outdoor activities. The large lot size allows for numerous possibilities, including patio or deck for dining and relaxation.
Key facts
- Generous lot
- Patio or deck
- 0.3 acre lot
Tags
Neighborhood map
What this means for you Summary
Snapshot
- This is a 2-bed/1.5-bath single-family listed at $110k.
Deal economics
- At list price, monthly cash flow is $205 ($2k/yr) — positive.
- The deal already cash-flows at list — no discount required.
- Meets the 1% rule at list price ($1k rent vs $110k).
- Recommended offer: $97k (12.0% below list) — sets the bar for market timing.
- Cap rate 8.5% vs local median 4.2% in Baytown — top-decile yield for the area; either an underpriced asset or a hidden risk that comps aren't pricing in. Stress-test before assuming the spread holds.
Location & tenants
- Location reads 69/100 on livability (#412 in TX) — a middle-class / working-renter tenant base. Strengths: cost of living A+, housing A+; Watch: schools D+, employment D+, crime F.
- Goose Creek CISD (urban): math 37% / reading 36% proficiency, ranked #473 of 826 in TX (top 57%) — families likely to look elsewhere, expect single-tenant / working-renter base with shorter leases; 61% free/reduced lunch — lower-income household profile, screen leases tightly.
- Market conditions: Rents rising (+1.3%/yr); 271 active listings in the ZIP; 10 comparable units currently listed for rent nearby; rentals lingering (median 44d on market — plan ~5-8 weeks vacancy on turnover, expect pricing pressure); 50% of comp listings sitting > 30 days — soft ceiling on asking rent; 29,883 units permitted in Harris County in 2024 (8,621 in 5+ unit buildings).
Forward outlook
- Local home prices are declining (-3.0%/yr); year-one equity from $761 of loan paydown is wiped out by about $3k of value loss. Plan a longer hold.
- Harris County population projected at +47% by 2050 — long-run rental-demand tailwind backs the buy-and-hold thesis.
Negotiation context
- It's been on market 162 days — a 12% lower offer ($97k) is reasonable based on typical stale-listing flexibility.
- 5 sale attempts since 10y ago; this cycle's ask has dropped $29k (21%) from the opening price — seller is motivated, your offer sets the floor, not the list.
- Current owner paid $35k; list at $110k implies a 214% gain — meaningful room to come down on a strong offer.
Risks & watch-outs
- Watch-outs: built in 1948 — expect roof / HVAC / electrical / plumbing capex.
- Climate carrying-cost: moderate flood risk; severe wind risk, 99% chance of damaging wind over 30y; extreme-heat days projected 7→27/yr by 2055 (HVAC capex compounding) — expect insurance premiums to compound above CPI over the hold.
Questions for the listing agent
- It's been on market 162 days. Have you received any prior offers? Is the seller open to a 12% concession, seller financing, or rate buy-down credit?
- Built in 1948 — when were the roof, HVAC, electrical panel, plumbing, and water heater last replaced?
- Why hasn't it sold? Are there any deal-killer items the seller is aware of (foundation, flood, title, zoning, code violations)?
- Is there a deadline driving the sale (1031 exchange, divorce, estate, relocation)? That informs how much negotiation room exists.
- Schools are D-rated, which usually means shorter tenancies and higher turnover. Who's the typical renter profile here, and what's been the actual vacancy rate?
- Crime grade is F in this area — have there been break-ins, vandalism, or insurance claims at this property in the last 3 years? What carrier currently insures it and at what premium?
- What's the average days-on-market for RENTAL listings here right now (not sales)? A rising rental-DOM trend means longer vacancies and softer asking-rent achievability than the comps imply.
- What's the recent tenant-quality profile in this submarket — average credit score on applications, eviction rate, late-payment / NSF rate, and stable-employment percentage? A property-management company in the area should have these aggregated.
- How much new for-sale + rental construction is in the pipeline within 1–3 miles? Heavy new supply typically softens prices + rents 12–24 months out; constrained supply supports both.
Investment metrics
- 1% rule
- 1.11% ✓
- Cap rate
- 8.53%
- Cash-on-cash
- 7.99%
- DSCR
- 1.36
- GRM
- 7.5
CMA / ARV
- ARV (median comp)
- $188,859
- List price
- $110,000
- Delta
- -41.76%
- Verdict
- UNDERPRICED
- Comps
- 20 within 1.0 mi
Show comp detail 12 sales within ~0.75 mi
| Address | Dist | Beds/Ba | Sqft | Sold | Price | $/sf | Match |
|---|---|---|---|---|---|---|---|
| 3410 Woodcrest Dr | 0.66mi | 3/2.0 (+1) | 1,647 (-1%) | 8mo | $150,000 | $91 | 53 |
| 1707 Wilburn | 0.69mi | 3/2.0 (+1) | 1,700 (+2%) | 12mo | $207,000 | $122 | 48 |
| 511 William Ave | 0.48mi | 3/2.0 (+1) | 1,472 (-12%) | 4mo | $185,000 | $126 | 48 |
| 406 River Bend Dr | 0.67mi | 3/2.0 (+1) | 1,747 (+5%) | 10mo | $174,999 | $100 | 45 |
| 304 Grantham Rd | 0.60mi | 3/2.0 (+1) | 1,748 (+5%) | 15mo | $239,990 | $137 | 45 |
| 1600 Wilburn Dr | 0.74mi | 3/2.0 (+1) | 1,620 (-3%) | 11mo | $215,000 | $133 | 44 |
| 502 W Francis St | 0.41mi | 3/2.5 (+1) | 1,448 (-13%) | 8mo | $240,000 | $166 | 44 |
| 417 Harold Ln | 0.50mi | 3/2.0 (+1) | 1,482 (-11%) | 10mo | $278,000 | $188 | 43 |
| 704 Pamela Dr | 0.43mi | 3/2.0 (+1) | 1,480 (-11%) | 15mo | $209,900 | $142 | 42 |
| 701 Fleetwood St | 0.63mi | 3/2.0 (+1) | 1,766 (+6%) | 16mo | $247,900 | $140 | 41 |
| 200 Grantham Rd | 0.71mi | 3/2.0 (+1) | 1,574 (-6%) | 12mo | $210,000 | $133 | 40 |
| 1500 Harvard St | 0.69mi | 3/1.0 (+1) | 1,425 (-15%) | 8mo | $110,000 | $77 | 30 |
Match score weights: distance 35% · size 25% · config 20% · recency 20%. Top-matched comps best support the ARV.
Projected returns pro-forma
-3.0% appreciation · 1.3% rent growth · sell at horizon
- IRR
- -6.1%
- Equity multiple
- 0.78×
- Total profit
- $-6,800
- Equity at exit
- $16,401
- IRR
- 1.4%
- Equity multiple
- 1.09×
- Total profit
- $2,823
- Equity at exit
- $9,511
Cash invested: $30,800 (down + closing). Projections, not guarantees.
Landlord ↔ Tenant lean methodology
- Overall (STATE)
- 87 Strongly Landlord-Friendly
- State Texas
- 87 Strongly Landlord-Friendly · R+5
- County
- — inherits STATE
- City
- — inherits STATE
ZIP-level market 77520
- Rents YoY
- 1.3%
- Active inventory
- 271
- Price-to-rent
- 7.5×
Monthly cashflow live
- Estimated rent
- $1,222 high interval (Pro) →
- Mortgage (P&I)
- −$577
- Tax est. 1.5%
- −$138 /mo · $1,650/yr
- Insurance
- −$46
- HOA
- −$0
- Vacancy / Maint / Mgmt
- −$257
- Net cashflow
- $205
Break-even live
UW: 25.0% down · 7.5% · 30yr · 1.5% tax · 5.0% vac · 8.0% maint · 8.0% mgmt
Financing live
Cash to close
- Down payment
- $27,500
- Closing costs
- $3,300
- Reserves months
- —
- Total cash needed
- —
Loan-product check · same deal, 3 products live
Conventional
25% down · 7.5% · 30yr
- Down + closing
- —
- Monthly P&I
- —
- Monthly cashflow
- —
- DSCR
- —
- Eligible?
- —
Personal DTI + credit; lowest rate.
DSCR
20% down · 8.5% · 30yr
- Down + closing
- —
- Monthly P&I
- —
- Monthly cashflow
- —
- DSCR
- —
- Eligible?
- —
No personal income docs; deal must DSCR.
Hard money
10% down · 12.0% · 12mo
- Down + closing
- —
- Monthly P&I
- —
- Monthly cashflow
- —
- DSCR
- —
- Eligible?
- —
Short-term bridge; refi at stabilization.
Rent comps 10 comps
| Address | Beds | Baths | Sqft | Rent | $/sqft | DOM | Units | Dist |
|---|---|---|---|---|---|---|---|---|
| 1601 Garth Rd Baytown, TX | 2.0–3.0 | 1.0–2.5 | 1190 | $979 | $0.82 | 2d | 5 | 0.31mi |
| 305 Kelly Ln Baytown, TX | 3.0 | 2.0 | 1650 | $1,000 | $0.61 | 15d | 1 | 0.67mi |
| 619 Rollingbrook Dr Baytown, TX | 1.0–3.0 | 1.0–2.0 | 920 | $1,468 | $1.60 | 2d | 34 | 0.94mi |
| 3723 Emmett Hutto Blvd Baytown, TX | 2.0 | 2.0 | 1216 | $1,650 | $1.36 | 44d | 1 | 1.04mi |
| 607 Vista Ave Baytown, TX | 3.0 | 2.0 | 1232 | $1,475 | $1.20 | 44d | 1 | 1.29mi |
| 1512 Beaumont Rd Baytown, TX | 3.0 | 2.0 | 1112 | $1,200 | $1.08 | 44d | 1 | 1.38mi |
| 1525 Barcelona Way Baytown, TX | 3.0 | 2.0 | 1112 | $1,250 | $1.12 | 24d | 1 | 1.39mi |
| 1519 Barcelona Way Baytown, TX | 3.0 | 2.0 | 1325 | $1,250 | $0.94 | 44d | 1 | 1.39mi |
| 1507 Barcelona Way Baytown, TX | 2.0 | 2.0 | 1070 | $1,075 | $1.00 | 44d | 1 | 1.41mi |
| 700 Meadowglen Dr Baytown, TX | 3.0 | 2.0 | 1472 | $1,800 | $1.22 | 24d | 1 | 1.44mi |
Listing history 40 events
-
2026-06-18days on market $110,000 Active 162 DOM
-
2026-06-17days on market $110,000 Active 161 DOM
-
2026-06-16days on market $110,000 Active 160 DOM
-
2026-06-15days on market $110,000 Active 159 DOM
-
2026-06-13days on market $110,000 Active 157 DOM
-
2026-06-09days on market $110,000 Active 153 DOM
-
2026-06-07days on market $110,000 Active 151 DOM
-
2026-06-04days on market $110,000 Active 148 DOM
-
2026-06-03days on market $110,000 Active 147 DOM
-
2026-06-02days on market $110,000 Active 146 DOM
-
2026-06-01days on market $110,000 Active 145 DOM
-
2026-05-31days on market $110,000 Active 144 DOM
-
2026-05-13price $110,000 238-char remark
Show marketing remark (238 chars)
This charming cozy house features three bedrooms and two bathrooms. With a generous lot, there plenty of room for outdoor activities. The large lot size allows for numerous possibilities, including patio or deck for dining and relaxation.
-
2026-02-12price $134,000 238-char remark
Show marketing remark (238 chars)
This charming cozy house features three bedrooms and two bathrooms. With a generous lot, there plenty of room for outdoor activities. The large lot size allows for numerous possibilities, including patio or deck for dining and relaxation.
-
2026-01-07$139,000 Active 238-char remark
Show marketing remark (238 chars)
This charming cozy house features three bedrooms and two bathrooms. With a generous lot, there plenty of room for outdoor activities. The large lot size allows for numerous possibilities, including patio or deck for dining and relaxation.
-
2025-12-31historical
-
2025-12-05price $144,000
-
2025-11-01price $149,000
-
2025-10-01price $154,000
-
2025-09-17price $159,000
-
2025-08-18price $159,999
-
2025-08-04price $174,500
-
2025-07-14price $179,999
-
2025-05-23price $194,000
-
2025-05-23price $184,000
-
2025-05-03$200,000 Active
-
2025-05-03historical
-
2025-04-29$200,000 Active
-
2016-05-19historical
-
2016-05-18soldstatus
-
2016-05-16soldstatus Sold
-
2016-05-12status Pending
-
2016-05-05price $59,900
-
2016-05-05price $69,500
-
2016-05-04status Active
-
2016-04-19status Pending
-
2016-04-06status Option Pending
-
2016-02-22$79,500 Active
-
1992-06-01soldstatus $35,000
-
1992-02-06soldstatus
ⓘ Source: listings_history table (triggers on properties + properties_extension) + one-shot
backfill from property_details.listing_events for pre-trigger history.
Climate risk First Street
- Flood 5/10 Major FEMA zone X (unshaded) · 26% chance over 30 yrs
- Wildfire 1/10 Low
- Heat 10/10 Extreme 7 d/yr ≥109°F today · 27 d/yr by 30 yrs out
- Wind 9/10 Extreme 99% chance of damaging wind over 30 yrs
- Air quality 2/10 Low 1 unhealthy d/yr today · 2 by 30 yrs out
Nearby sold comps map
Loading sold comps map…
Walkable amenities ~0.75 mi
Loading nearby amenities…
Taxation est. · year 1
- Rental income
- $14,662
- − Mortgage interest
- −$6,162
- − Property taxes
- −$1,650
- − Insurance
- −$550
- − Repairs & maintenance
- −$1,173
- − Management
- −$1,173
- − Depreciation
- −$3,200
- Taxable income
- $755
- Est. tax owed @ 24.0%
- −$181
- After-tax cash flow
- $2,280/yr
For passive investors: Depreciation is non-cash, so a rental often shows a tax loss while cash-flowing — sheltering income. Rental losses are passive: they offset passive income freely, and up to $25,000/yr can offset ordinary (W-2) income if you actively participate and your MAGI is under $100k (phasing out to $0 by $150k); unused losses carry forward. On sale, claimed depreciation is recaptured at up to 25%, and gains may owe capital-gains tax (a 1031 exchange can defer both). Figures are a year-1 estimate at your 24.0% rate — not tax advice; consult a CPA.
Schools (NCES district)
- District
- Goose Creek CISD
- NCES district ID
- 4821150
- Math proficiency
- 37% ▼ -11.00%
- Reading proficiency
- 36% ▼ -4.00%
- Median HH income
- $52,468
- Composite
- 31.84/100
- National rank
- #5877
- State rank
- #473 of 826 in TX
Livability — Baytown
- Score
- 69/100
- State rank
- #412
- US rank
- #8494
Category grades
Schools grade is shown separately in the Schools card above.
Census & demographics
- Census place
- Baytown, TX
- County
- Harris County · 4,702,590 people
- City population
- 135,579
- Metro
- Houston-The Woodlands-Sugar Land, TX
- Population (ZIP)
- 36,355
- Household income
- $54,278
- Rent vs Own
- Severe rent burden
- 1559.0
Population outlook (Harris County) Hauer SSP2
- Today (2025)
- 5,571,493 people
- By 2030
- 6,089,821 · +9.3%
- By 2040
- 7,142,806 · +28.2%
- By 2050
- 8,185,864 · +46.9%
- By 2075
- 10,574,329 · +89.8%
- By 2100
- 12,109,958 · +117.4%
Race, ethnicity, and origin ACS 2023
- Neighborhood character
- Diverse neighborhood (Simpson 0.60)
- Race & ethnicity
- Hispanic / Latino 55% White 30% Two or more races 19% Black 10% Asian 2%
- Hispanic origin (detail)
- Mexican 48%
- Common ancestry
- Italian 1% Lithuanian 1% Romanian 1%
- Foreign-born
- 21% · Canada, Vietnam
- Languages at home
- 55% English-only · Spanish 43% Other Asian/Pacific 1% Other Indo-European 1%
Political lean MEDSL · Harris
- 2024 margin
- Lean D (+5.5) · D 52.0% · R 46.4% · Other 1.6%
- 2008→2024 swing
- +3.9pp toward D · 2008: 1.6pp · 2024: 5.5pp
- All cycles
- 2024: D+5.5 2020: D+13.3 2016: D+12.4 2012: D+0.1 2008: D+1.6
Not yet ingested
- Civics
- —
Market trends
- HPI YoY
- ▼ -143.36%
- Current HPI
- 262.066
- Rent YoY
- ▲ 1.30%
- Metro
- Houston-The Woodlands-Sugar Land, TX
- State GDP YoY
- ▲ 3.95%
- F500 in state
- 110
Industry mix (Fortune 500 HQ in TX)
| Industry | F500 HQs | Revenue |
|---|---|---|
| Energy | 16 | $1,198B |
|
||
| Technology | 5 | $198B |
|
||
| Engineering / Construction | 4 | $72B |
|
||
| Energy Services | 3 | $60B |
|
||
| Utilities | 3 | $41B |
|
||
| Healthcare | 2 | $330B |
|
||
Price history
+214.3% since first listed28 events — show timeline
- 2026-05-13 Price Changed $110,000 HARMLS
- 2026-02-12 Price Changed $134,000 HARMLS
- 2026-01-07 Listed $139,000 HARMLS
- 2025-12-31 Listing Removed — HARMLS
- 2025-12-05 Price Changed $144,000 HARMLS
- 2025-11-01 Price Changed $149,000 HARMLS
- 2025-10-01 Price Changed $154,000 HARMLS
- 2025-09-17 Price Changed $159,000 HARMLS
- 2025-08-18 Price Changed $159,999 HARMLS
- 2025-08-04 Price Changed $174,500 HARMLS
- 2025-07-14 Price Changed $179,999 HARMLS
- 2025-05-23 Price Changed $194,000 HARMLS
- 2025-05-23 Price Changed $184,000 HARMLS
- 2025-05-03 Listing Removed — HARMLS
- 2025-05-03 Listed $200,000 HARMLS
- 2025-04-29 Listed $200,000 HARMLS
- 2016-05-19 Listing Removed — HARMLS
- 2016-05-18 Sold (Public Records) — Public Records
- 2016-05-16 Sold (MLS) — HARMLS
- 2016-05-12 Pending — HARMLS
- 2016-05-05 Price Changed $59,900 HARMLS
- 2016-05-05 Price Changed $69,500 HARMLS
- 2016-05-04 Relisted — HARMLS
- 2016-04-19 Pending — HARMLS
- 2016-04-06 Pending — HARMLS
- 2016-02-22 Listed $79,500 HARMLS
- 1992-06-01 Sold (Public Records) $35,000 Public Records
- 1992-02-06 Sold (Public Records) — Public Records
Property tax history
+4.9%/yrLatest (2025): $5,887 · +0.3% YoY. Source: county tax records.
Cash-flow waterfall
monthlySold comps — $/sqft
last 12 mo · ≤1 miLoading sold comps…