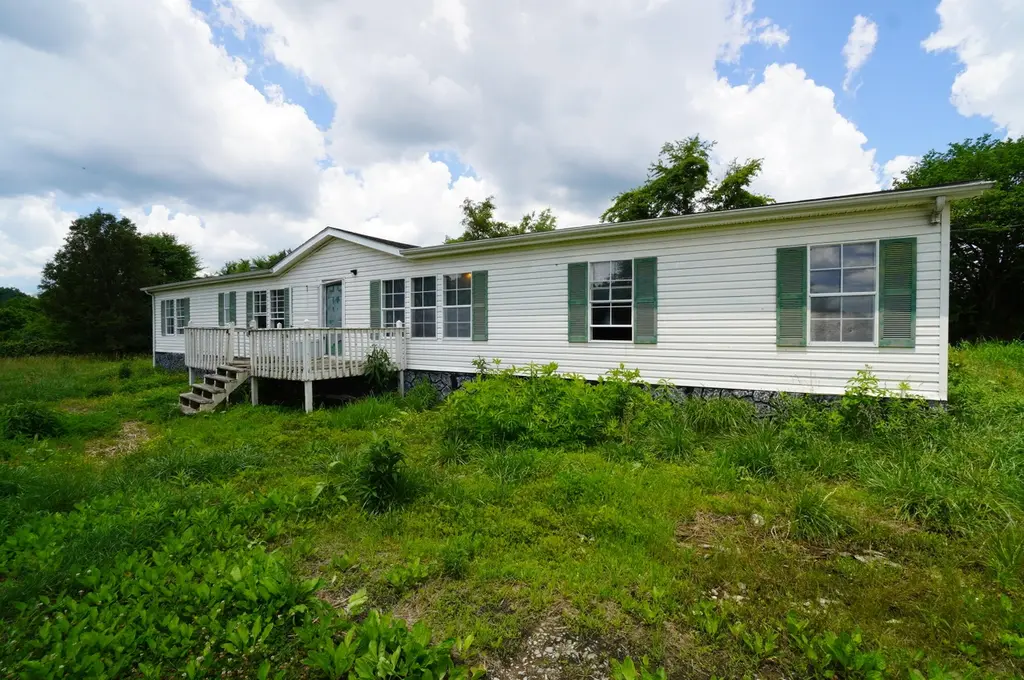
160 Kate Riley Ln · Mosheim, TN
Flood risk 1/10 · Minimal
- FEMA flood zone
- X (unshaded)
- Chance of flooding over 30 yrs
- 0.0%
- Est. flood insurance / yr
- $507 – $1,088
Fire risk 3/10 · Minor
- Est. fire insurance / yr
- $949 – $1,763
Heat risk 5/10 · Moderate
- Hot days now (above 102°F)
- 7 days/yr
- Hot days in 30 yrs
- 21 days/yr
Wind risk 2/10 · Minimal
- Chance of severe wind over 30 yrs
- —
Air-quality risk 3/10 · Minor
- Unhealthy air days now
- 2 days/yr
- Unhealthy air days in 30 yrs
- 3 days/yr
Risk factors via First Street. Map © Google.
Why this score? — see what drove the B+ grade
The composite is a weighted blend of 9 inputs, each scored 0–100. Each bar is that input's sub-score; the figure is the points it added to the 100-point composite (weight × sub-score).
- Cash flow +30.0/30.0
- 1% rule +10.0/10.0
- DSCR +10.0/10.0
- Appreciation +8.7/10.0
- ARV discount +7.5/15.0
- Livability +2.9/5.0
- Rent growth +2.5/5.0
- Condition / age +2.5/5.0
- Schools +2.1/10.0
$59,000
🖨 Deal sheet (PDF) 📄 Offer letter ✓ Due diligence
Listing remarks MLS
FIXER UPPER WITH TREMENDOUS POTENTIAL! Foreclosure opportunity offering approximately 1 acre with beautiful country views in a peaceful rural setting of Greene County. Property includes a 1995 double-wide featuring 4BR/2BA, along with a 924 sq. ft. singlewide. This property is being sold as-is and is best suited for investors, rehabbers, or buyers looking for their next renovation project. The doublewide will require substantial repairs but offers the potential to be restored to livable condition. Condition of the singlewide is unknown. Property is serviced by a well, though seller makes no representations regarding its operation or whether it serves both homes. Electricity is currently connected and on. If you're looking for a value-add investment with acreage, views, and upside potential, this could be the project you've been waiting for. Cash offers are preferred. Financing may be possible through local lenders offering rehabilitation loan programs. Government-backed financing programs will not qualify. Bring your vision and transform this property into something special. Opportunities like this don't come along every day! Note: This property is close to railroad track.
Key facts
- Double-wide
- Well
- 1 acre
Tags
Property features AI
Finance
- Financial info: City and county taxes listed
Exterior
- Parking: Main level parking
- Utilities: Septic tank
- Home design: Single-family (not attached); 1,512 building area (per tax records)
- Construction: Frame construction; Vinyl siding; Other construction materials
- Exterior features: Private, level lot; Mountain view
Interior
- Kitchen: Pantry
- Bedrooms: Master bedroom; Bedroom 2; Bedroom 3; Bedroom 4
- Flooring: Vinyl flooring
- Bathrooms: 2 full bathrooms
- Heating & cooling: Heat pump and electric heating; Central cooling
- Interior features: Walk-in closets; Pantry; Wood-burning fireplace
- Laundry & utility: Utility room
Neighborhood map
What this means for you Summary
Snapshot
- This is a 4-bed/2.0-bath manufactured listed at $59k.
Deal economics
- At list price, monthly cash flow is $603 ($7k/yr) — positive.
- The deal already cash-flows at list — no discount required.
- Meets the 1% rule at list price ($1k rent vs $59k).
- Cap rate 18.6% vs local median 2.3% in Mosheim — top-decile yield for the area; either an underpriced asset or a hidden risk that comps aren't pricing in. Stress-test before assuming the spread holds.
Location & tenants
- Location reads 58/100 on livability (#314 in TN) — a working-class tenant base; expect higher turnover. Strengths: cost of living A+, housing B; Watch: employment D, schools F, crime F.
- Greene County (rural): math 27% / reading 24% proficiency, ranked #83 of 139 in TN (top 60%) — low school quality limits family demand, transient renter base, plan for 1-2y turnover.
- Market conditions: 17 active listings in the ZIP; 333 units permitted in Greene County in 2024 (72 in 5+ unit buildings).
Forward outlook
- In year one you build about $5k of equity ($408 loan paydown + $4k appreciation (7.3% local appreciation)).
- Greene County population projected to shrink 8% by 2050 — rents likely to lag national; underwrite the cash flow, not the appreciation.
- At projected returns (7.3% appreciation + 3.0% rent growth), your $17k cash investment doubles in ~2 years — after that, you're playing with house money.
- By year 7, paydown + projected appreciation supports a ~$32k cash-out refi (75% LTV) — recoverable capital for the next deal without selling this one.
Negotiation context
- Only 7 days on market — expect competitive offers; lowballing is unlikely to land.
- 3 sale attempts with the ask held roughly flat each time — persistent listings suggest the price (not the market) is what's stuck; bring a comps-based counter.
Risks & watch-outs
- Climate carrying-cost: extreme-heat days projected 7→21/yr by 2055 (HVAC capex compounding) — expect insurance premiums to compound above CPI over the hold.
Questions for the listing agent
- Is there a deadline driving the sale (1031 exchange, divorce, estate, relocation)? That informs how much negotiation room exists.
- Schools are F-rated, which usually means shorter tenancies and higher turnover. Who's the typical renter profile here, and what's been the actual vacancy rate?
- Crime grade is F in this area — have there been break-ins, vandalism, or insurance claims at this property in the last 3 years? What carrier currently insures it and at what premium?
- What's the average days-on-market for RENTAL listings here right now (not sales)? A rising rental-DOM trend means longer vacancies and softer asking-rent achievability than the comps imply.
- What's the recent tenant-quality profile in this submarket — average credit score on applications, eviction rate, late-payment / NSF rate, and stable-employment percentage? A property-management company in the area should have these aggregated.
- How much new for-sale + rental construction is in the pipeline within 1–3 miles? Heavy new supply typically softens prices + rents 12–24 months out; constrained supply supports both.
Investment metrics
- 1% rule
- 2.12% ✓
- Cap rate
- 18.55%
- Cash-on-cash
- 43.78%
- DSCR
- 2.95
- GRM
- 3.9
CMA / ARV
No comps found within radius.
Projected returns pro-forma
7.34% appreciation · 3.0% rent growth · sell at horizon
- IRR
- 54.9%
- Equity multiple
- 4.65×
- Total profit
- $60,238
- Equity at exit
- $42,211
- IRR
- 50.6%
- Equity multiple
- 9.86×
- Total profit
- $146,286
- Equity at exit
- $81,412
Cash invested: $16,520 (down + closing). Projections, not guarantees.
Landlord ↔ Tenant lean methodology
- Overall (STATE)
- 87 Strongly Landlord-Friendly
- State Tennessee
- 87 Strongly Landlord-Friendly · R+13
- County
- — inherits STATE
- City
- — inherits STATE
ZIP-level market 37810
- Home prices YoY
- 2.8%
- Active inventory
- 17
- Price-to-rent
- 3.9×
Monthly cashflow live
- Estimated rent
- $1,252 medium interval (Pro) →
- Mortgage (P&I)
- −$309
- Tax from tax record
- −$53 /mo · $632/yr
- Insurance
- −$25
- HOA
- −$0
- Vacancy / Maint / Mgmt
- −$263
- Net cashflow
- $603
Break-even live
Sensitivity live
| Price | -10% $636 | -5% $619 | +0% $603 | +5% $586 | +10% $569 |
|---|---|---|---|---|---|
| Rent | -10% $504 | -5% $553 | +0% $603 | +5% $652 | +10% $702 |
| Rate | -1.0pp $632 | -0.5pp $618 | base $603 | +0.5pp $587 | +1.0pp $572 |
UW: 25.0% down · 7.5% · 30yr · 1.5% tax · 5.0% vac · 8.0% maint · 8.0% mgmt
Financing live
Cash to close
- Down payment
- $14,750
- Closing costs
- $1,770
- Reserves months
- —
- Total cash needed
- —
Loan-product check · same deal, 3 products live
Conventional
25% down · 7.5% · 30yr
- Down + closing
- —
- Monthly P&I
- —
- Monthly cashflow
- —
- DSCR
- —
- Eligible?
- —
Personal DTI + credit; lowest rate.
DSCR
20% down · 8.5% · 30yr
- Down + closing
- —
- Monthly P&I
- —
- Monthly cashflow
- —
- DSCR
- —
- Eligible?
- —
No personal income docs; deal must DSCR.
Hard money
10% down · 12.0% · 12mo
- Down + closing
- —
- Monthly P&I
- —
- Monthly cashflow
- —
- DSCR
- —
- Eligible?
- —
Short-term bridge; refi at stabilization.
Listing history 6 events
-
2026-06-16status $59,000 Pending 7 DOM
-
2026-06-15days on market $59,000 Active 7 DOM
-
2026-06-14days on market $59,000 Active 5 DOM
-
2026-06-12days on market $59,000 Active 4 DOM
-
2026-06-09remarks 699-char remark
-
2026-06-09$59,000 Active 1 DOM
ⓘ Source: listings_history table (triggers on properties + properties_extension) + one-shot
backfill from property_details.listing_events for pre-trigger history.
Tax reassessment forecast TN · Resets to sale price
- Current annual tax
- $632 · $53/mo
- Projected year-2 tax
- $632 · $53/mo
- Expected delta
- $0/yr ($0/mo · 0.0%)
ⓘ Screening estimate from a state-policy table — verify with the county assessor before closing.
Climate risk First Street
- Flood 1/10 Low FEMA zone X (unshaded) · 0% chance over 30 yrs
- Wildfire 3/10 Moderate
- Heat 5/10 Major 7 d/yr ≥102°F today · 21 d/yr by 30 yrs out
- Wind 2/10 Low
- Air quality 3/10 Moderate 2 unhealthy d/yr today · 3 by 30 yrs out
Nearby sold comps map
Loading sold comps map…
Walkable amenities ~0.75 mi
Loading nearby amenities…
Taxation est. · year 1
- Rental income
- $15,028
- − Mortgage interest
- −$3,305
- − Property taxes
- −$632
- − Insurance
- −$295
- − Repairs & maintenance
- −$1,202
- − Management
- −$1,202
- − Depreciation
- −$1,716
- Taxable income
- $6,675
- Est. tax owed @ 24.0%
- −$1,602
- After-tax cash flow
- $5,630/yr
For passive investors: Depreciation is non-cash, so a rental often shows a tax loss while cash-flowing — sheltering income. Rental losses are passive: they offset passive income freely, and up to $25,000/yr can offset ordinary (W-2) income if you actively participate and your MAGI is under $100k (phasing out to $0 by $150k); unused losses carry forward. On sale, claimed depreciation is recaptured at up to 25%, and gains may owe capital-gains tax (a 1031 exchange can defer both). Figures are a year-1 estimate at your 24.0% rate — not tax advice; consult a CPA.
Schools (NCES district)
- District
- Greene County
- NCES district ID
- 4701470
- Math proficiency
- 27% ▼ -14.00%
- Reading proficiency
- 24% ▼ -7.00%
- Median HH income
- $37,517
- Composite
- 21.3/100
- National rank
- #8388
- State rank
- #83 of 139 in TN
Livability — Mosheim
- Score
- 58/100
- State rank
- #314
- US rank
- #21396
Category grades
Schools grade is shown separately in the Schools card above.
Census & demographics
- City population
- 5,407
- Population (ZIP)
- 1,991
Population outlook (Greene County) Hauer SSP2
- Today (2025)
- 68,624 people
- By 2030
- 68,114 · -0.7%
- By 2040
- 66,167 · -3.6%
- By 2050
- 63,038 · -8.1%
- By 2075
- 55,274 · -19.5%
- By 2100
- 45,527 · -33.7%
Race, ethnicity, and origin ACS 2023
- Neighborhood character
- Predominantly White (99%)
- Race & ethnicity
- White 99%
- Common ancestry
- Italian 2% Slovak 1% Serbian 1%
Political lean MEDSL · Greene
- 2024 margin
- Solid R (+65.7) · D 16.6% · R 82.3% · Other 1.2%
- 2008→2024 swing
- -25.0pp toward R · 2008: -40.7pp · 2024: -65.7pp
- All cycles
- 2024: R+65.7 2020: R+60.7 2016: R+61.0 2012: R+46.0 2008: R+40.7
Not yet ingested
- Civics
- —
Market trends
- HPI YoY
- ▲ 7.34%
- Current HPI
- 274.4513
- Rent YoY
- —
- Metro
- —
- State GDP YoY
- ▲ 2.78%
- F500 in state
- 22
Industry mix (Fortune 500 HQ in TN)
| Industry | F500 HQs | Revenue |
|---|---|---|
| Healthcare | 3 | $91B |
|
||
| Retail | 3 | $72B |
|
||
| Transportation / Logistics | 1 | $88B |
|
||
| Paper / Packaging | 1 | $19B |
|
||
| Insurance | 1 | $13B |
|
||
| Energy | 1 | $12B |
|
||
Price history
+0.0% since first listed3 events — show timeline
- 2026-06-08 Listed $59,000 GSMAR
- 2026-06-08 Listed $59,000 LAAR
- 2026-06-08 Listed $59,000 Knoxville MLS
Property tax history
+8.6%/yrLatest (2025): $632 · +2.6% YoY. Source: county tax records.
Cash-flow waterfall
monthlySold comps — $/sqft
last 12 mo · ≤1 miLoading sold comps…