 🏢 Co-op
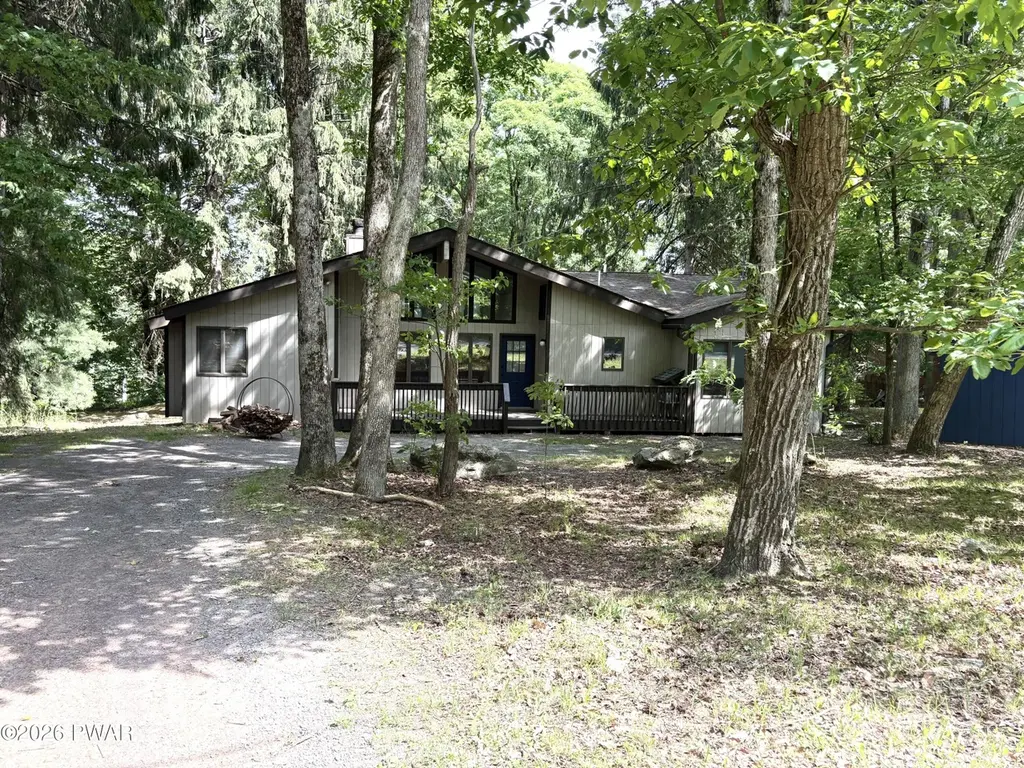
213 Hillside Dr · Hemlock Farms, PA
Flood risk 1/10 · Minimal
- FEMA flood zone
- X (unshaded)
- Chance of flooding over 30 yrs
- 0.0%
- Est. flood insurance / yr
- $473 – $860
Fire risk 4/10 · Minor
- Est. fire insurance / yr
- $511 – $949
Heat risk 2/10 · Minimal
- Hot days now (above 91°F)
- 7 days/yr
- Hot days in 30 yrs
- 15 days/yr
Wind risk 4/10 · Minor
- Chance of severe wind over 30 yrs
- 8.0%
Air-quality risk 2/10 · Minimal
- Unhealthy air days now
- 1 days/yr
- Unhealthy air days in 30 yrs
- 2 days/yr
Risk factors via First Street. Map © Google.
Why this score? — see what drove the B- grade
The composite is a weighted blend of 9 inputs, each scored 0–100. Each bar is that input's sub-score; the figure is the points it added to the 100-point composite (weight × sub-score).
- Cash flow +26.5/30.0
- Appreciation +10.0/10.0
- DSCR +9.1/10.0
- 1% rule +7.7/10.0
- Schools +4.2/10.0
- Livability +3.4/5.0
- Rent growth +2.5/5.0
- Condition / age +2.5/5.0
- ARV discount +1.2/15.0
$315,000
🖨 Deal sheet (PDF) 📄 Offer letter ✓ Due diligence
Listing remarks MLS
''Close Enough Yet Far Enough'' from NY, NJ, CT, or PHILLY Hemlock Farms Gated Community is ''The Perfect Place to Be '' 3 Bedrooms, 2 Bathrooms, Dining/Living Room Combo w/ Fireplace , Kitchen w/ laundry closet, Family Room, Large deck for entertaining or just relaxing in the sun. Amenities: 1 Indoor Pool, 2 Outdoor Pools, Fitness Center, Hot Tub, Sauna, Steam Room, Pickleball, Tennis Courts, Bocce, Playground, Dog Park, 24 Hour Security Service, Fire Dept. , Clubs, Beaches/Lakes, & much more. PLUS Lords Valley Country Club is also contained within the boundaries of Hemlock Farms, making its golf, tennis, pool and dining convenient to members. LVCC is a private not-for-profit club. Memberships are available subject to LVCC Board approval
Key facts
- Gated community
- Bonus room
- Stone fireplace
Tags
Property features AI
Finance
- Other: Subdivision: Hemlock Farms; Lot size approximately 0.51 acres (dimensions 111 x 202); Directions available within listing
- HOA & community: Homeowners association (annual fee); Association amenities include basketball court, tennis courts, recreation facilities, indoor pool, fitness center, playground, clubhouse, party/meeting rooms, recreation room, dog park, beach rights, golf course, trash service, security, and snow removal; Annual association fee
Exterior
- Parking: 5 total parking spaces; 5 open parking spaces; Unpaved/gravel parking with direct access
- Security: 24-hour security; Security gate; Security lights; Gated community with guard
- Utilities: 200+ amp electric service; Electricity connected; Water connected; Septic system (mound septic)
- Home design: Single-family house; One level (entry level 1); Residential zoning
- Construction: Built on block foundation; Asphalt roof
- Exterior features: Deck; Shed(s); Rectangular lot; Frontage approximately 107'; Private maintained paved road; Access to Hemlock Lake
Interior
- Kitchen: Range; Free‑standing range; Electric range; Electric oven; Range hood; Dishwasher; Refrigerator
- Bedrooms: Total rooms: 6
- Flooring: Carpet; Wood; Ceramic tile
- Bathrooms: 2 full bathrooms
- Heating & cooling: Baseboard heating; Electric heating; Fireplace heating; Ceiling fans; Wall unit cooling
- Interior features: High ceilings; Open floorplan; Insulated windows; Living room wood-burning stove fireplace (1)
- Laundry & utility: Laundry closet on main level; Washer included
Neighborhood map
What this means for you Summary
Snapshot
- This is a 3-bed/2.0-bath single-family listed at $315k.
Deal economics
- At list price, monthly cash flow is $837 ($10k/yr) — positive.
- The deal already cash-flows at list — no discount required.
- Meets the 1% rule at list price ($4k rent vs $315k).
- Cap rate 9.5% vs local median 7.1% in Hemlock Farms — top-decile yield for the area; either an underpriced asset or a hidden risk that comps aren't pricing in. Stress-test before assuming the spread holds.
Location & tenants
- Location reads 68/100 on livability (#884 in PA) — a middle-class / working-renter tenant base. Strengths: crime A+, housing A+, health & safety A+; Watch: schools C-, amenities F, commute F.
- Wallenpaupack Area SD (rural): math 39% / reading 59% proficiency, ranked #192 of 539 in PA (top 36%) — families likely to look elsewhere, expect single-tenant / working-renter base with shorter leases.
- Market conditions: 371 active listings in the ZIP; 3 comparable units currently listed for rent nearby; rentals leasing fast (median 2d on market — plan ~1-2 weeks tenant-placement turnaround); 213 units permitted in Pike County in 2024 (0 in 5+ unit buildings).
Forward outlook
- In year one you build about $34k of equity ($2k loan paydown + $32k appreciation (10.0% local appreciation)).
- Pike County population projected at -25% by 2050 — secular population decline; favor cash flow + early exit over multi-decade hold.
- At projected returns (10.0% appreciation + 3.0% rent growth), your $88k cash investment doubles in ~2 years — after that, you're playing with house money.
- By year 2, paydown + projected appreciation supports a ~$54k cash-out refi (75% LTV) — recoverable capital for the next deal without selling this one.
Negotiation context
- Only 11 days on market — expect competitive offers; lowballing is unlikely to land.
- 4 sale attempts since 5y ago; this cycle's ask has dropped $20k (6%) from the opening price — seller is motivated, your offer sets the floor, not the list.
- Current owner paid $214k; 47% above their basis — modest negotiation headroom, anchor on the comps not their cost.
Questions for the listing agent
- What does the HOA fee cover, when was the last increase, and are there any pending special assessments or reserve-fund shortfalls?
- Is there a deadline driving the sale (1031 exchange, divorce, estate, relocation)? That informs how much negotiation room exists.
- What's the average days-on-market for RENTAL listings here right now (not sales)? A rising rental-DOM trend means longer vacancies and softer asking-rent achievability than the comps imply.
- What's the recent tenant-quality profile in this submarket — average credit score on applications, eviction rate, late-payment / NSF rate, and stable-employment percentage? A property-management company in the area should have these aggregated.
- How much new for-sale + rental construction is in the pipeline within 1–3 miles? Heavy new supply typically softens prices + rents 12–24 months out; constrained supply supports both.
Investment metrics
- 1% rule
- 1.27% ✓
- Cap rate
- 9.48%
- Cash-on-cash
- 11.39%
- DSCR
- 1.51
- GRM
- 6.6
CMA / ARV
- ARV (on-the-fly)
- $276,192
- Comps found
- 12
Show comp detail 12 sales within ~0.75 mi
| Address | Dist | Beds/Ba | Sqft | Sold | Price | $/sf | Match |
|---|---|---|---|---|---|---|---|
| 103 Fairway Ln | 0.15mi | 4/2.0 (+1) | 1,548 (-6%) | 14mo | $249,000 | $161 | 67 |
| 128 Horseshoe Ln | 0.47mi | 3/2.0 | 1,485 (-10%) | 1mo | $190,000 | $128 | 61 |
| 109 Canterbrook Dr | 0.42mi | 3/2.0 | 1,536 (-7%) | 11mo | $275,000 | $179 | 60 |
| 803 Lariat Ct | 0.48mi | 4/2.0 (+1) | 1,588 (-3%) | 8mo | $190,000 | $120 | 60 |
| 130 Canterbrook Dr | 0.63mi | 3/2.5 | 1,550 (-6%) | 1mo | $260,000 | $168 | 58 |
| 130 Canterbrook Dr #130 | 0.63mi | 3/2.5 | 1,550 (-6%) | 1mo | $260,000 | $168 | 58 |
| 111 Horseshoe Ln | 0.47mi | 2/2.0 (-1) | 1,500 (-9%) | 1mo | $178,500 | $119 | 58 |
| 202 Waterview Dr | 0.11mi | 3/2.5 | 1,882 (+14%) | 18mo | $360,000 | $191 | 54 |
| 145 Gaskin Dr | 0.60mi | 3/2.0 | 1,720 (+5%) | 15mo | $290,000 | $169 | 52 |
| 804 Rowel Ct | 0.52mi | 3/2.0 | 1,536 (-7%) | 18mo | $189,900 | $124 | 50 |
| 115 Jackson Dr | 0.69mi | 4/2.0 (+1) | 1,496 (-9%) | 6mo | $355,000 | $237 | 43 |
| 114 Heron Bay Rd | 0.74mi | 3/2.0 | 1,816 (+10%) | 19mo | $320,000 | $176 | 33 |
Match score weights: distance 35% · size 25% · config 20% · recency 20%. Top-matched comps best support the ARV.
Projected returns pro-forma
10.0% appreciation · 3.0% rent growth · sell at horizon
- IRR
- 32.6%
- Equity multiple
- 3.55×
- Total profit
- $225,015
- Equity at exit
- $283,777
- IRR
- 28.2%
- Equity multiple
- 8.04×
- Total profit
- $620,994
- Equity at exit
- $611,976
Cash invested: $88,200 (down + closing). Projections, not guarantees.
Landlord ↔ Tenant lean methodology
- Overall (STATE)
- 62 Landlord-Friendly
- State Pennsylvania
- 62 Landlord-Friendly · EVEN
- County
- — inherits STATE
- City
- — inherits STATE
ZIP-level market 18428
- Home prices YoY
- 9.2%
- Active inventory
- 371
- Price-to-rent
- 6.6×
Monthly cashflow live
- Estimated rent
- $3,989 medium interval (Pro) →
- Mortgage (P&I)
- −$1,652
- Tax from tax record
- −$288 /mo · $3,453/yr
- Insurance
- −$131
- HOA
- −$243
- Vacancy / Maint / Mgmt
- −$838
- Net cashflow
- $837
Break-even live
Sensitivity live
| Price | -10% $1,015 | -5% $926 | +0% $837 | +5% $748 | +10% $659 |
|---|---|---|---|---|---|
| Rent | -10% $522 | -5% $680 | +0% $837 | +5% $995 | +10% $1,152 |
| Rate | -1.0pp $996 | -0.5pp $917 | base $837 | +0.5pp $755 | +1.0pp $672 |
UW: 25.0% down · 7.5% · 30yr · 1.5% tax · 5.0% vac · 8.0% maint · 8.0% mgmt
Financing live
Cash to close
- Down payment
- $78,750
- Closing costs
- $9,450
- Reserves months
- —
- Total cash needed
- —
Loan-product check · same deal, 3 products live
Conventional
25% down · 7.5% · 30yr
- Down + closing
- —
- Monthly P&I
- —
- Monthly cashflow
- —
- DSCR
- —
- Eligible?
- —
Personal DTI + credit; lowest rate.
DSCR
20% down · 8.5% · 30yr
- Down + closing
- —
- Monthly P&I
- —
- Monthly cashflow
- —
- DSCR
- —
- Eligible?
- —
No personal income docs; deal must DSCR.
Hard money
10% down · 12.0% · 12mo
- Down + closing
- —
- Monthly P&I
- —
- Monthly cashflow
- —
- DSCR
- —
- Eligible?
- —
Short-term bridge; refi at stabilization.
Rent comps 3 comps
| Address | Beds | Baths | Sqft | Rent | $/sqft | DOM | Units | Dist |
|---|---|---|---|---|---|---|---|---|
| 402 Canoe Brook Dr Hawley, PA | 3.0 | 2.0 | 2055 | $3,500 | $1.70 | 1d | 1 | 0.76mi |
| 113 Portage Ln Milford, PA | 3.0 | 2.0 | 1400 | $4,000 | $2.86 | 1d | 1 | 0.78mi |
| 101 Pommel Dr Hawley, PA | 3.0 | 2.0 | 1691 | $4,400 | $2.60 | 1d | 1 | 0.80mi |
HOA detail
- Monthly dues
- $243 · $2,916/yr
- Likely covers
- poolgymsecurity
Listing history 10 events
-
2026-06-18status $315,000 Pending 11 DOM
-
2026-06-18days on market $315,000 Active 11 DOM
-
2026-06-17days on market $315,000 Active 10 DOM
-
2026-06-16days on market $315,000 Active 9 DOM
-
2026-06-15days on market $315,000 Active 8 DOM
-
2026-06-13days on market $315,000 Active 6 DOM
-
2026-06-13days on market $315,000 Active 5 DOM
-
2026-06-09days on market $315,000 Active 2 DOM
-
2026-06-08remarks 699-char remark
-
2026-06-08$315,000 Active 1 DOM
ⓘ Source: listings_history table (triggers on properties + properties_extension) + one-shot
backfill from property_details.listing_events for pre-trigger history.
Tax reassessment forecast PA · Partial reset (capped growth)
- Current annual tax
- $3,453 · $288/mo
- Projected year-2 tax
- $4,215 · $351/mo
- Expected delta
- +$762/yr (+$64/mo · 22.1%)
ⓘ Screening estimate from a state-policy table — verify with the county assessor before closing.
Climate risk First Street
- Flood 1/10 Low FEMA zone X (unshaded) · 0% chance over 30 yrs
- Wildfire 4/10 Moderate
- Heat 2/10 Low 7 d/yr ≥91°F today · 15 d/yr by 30 yrs out
- Wind 4/10 Moderate 8% chance of damaging wind over 30 yrs
- Air quality 2/10 Low 1 unhealthy d/yr today · 2 by 30 yrs out
Nearby sold comps map
Loading sold comps map…
Walkable amenities ~0.75 mi
Loading nearby amenities…
Taxation est. · year 1
- Rental income
- $47,862
- − Mortgage interest
- −$17,645
- − Property taxes
- −$3,453
- − Insurance
- −$1,575
- − Repairs & maintenance
- −$3,829
- − Management
- −$3,829
- − HOA
- −$2,916
- − Depreciation
- −$9,164
- Taxable income
- $5,452
- Est. tax owed @ 24.0%
- −$1,309
- After-tax cash flow
- $8,736/yr
For passive investors: Depreciation is non-cash, so a rental often shows a tax loss while cash-flowing — sheltering income. Rental losses are passive: they offset passive income freely, and up to $25,000/yr can offset ordinary (W-2) income if you actively participate and your MAGI is under $100k (phasing out to $0 by $150k); unused losses carry forward. On sale, claimed depreciation is recaptured at up to 25%, and gains may owe capital-gains tax (a 1031 exchange can defer both). Figures are a year-1 estimate at your 24.0% rate — not tax advice; consult a CPA.
Schools (NCES district)
- District
- Wallenpaupack Area SD
- NCES district ID
- 4224750
- Math proficiency
- 39% ▼ -10.00%
- Reading proficiency
- 59% ▼ -5.00%
- Median HH income
- $51,027
- Composite
- 41.97/100
- National rank
- #3345
- State rank
- #192 of 539 in PA
Livability — Hemlock Farms
- Score
- 68/100
- State rank
- #884
- US rank
- #9421
Category grades
Schools grade is shown separately in the Schools card above.
Census & demographics
- Census place
- Hemlock Farms, PA
- Population (ZIP)
- 12,446
Population outlook (Pike County) Hauer SSP2
- Today (2025)
- 53,548 people
- By 2030
- 51,622 · -3.6%
- By 2040
- 46,490 · -13.2%
- By 2050
- 40,372 · -24.6%
- By 2075
- 31,951 · -40.3%
- By 2100
- 26,821 · -49.9%
Race, ethnicity, and origin ACS 2023
- Neighborhood character
- Predominantly White (85%)
- Race & ethnicity
- White 85% Hispanic / Latino 8% Two or more races 6% Black 1% Asian 1%
- Hispanic origin (detail)
- Puerto Rican 5%
- Common ancestry
- Romanian 5% Portuguese 3% Italian 2%
- Foreign-born
- 5% · Canada
- Languages at home
- 91% English-only · Spanish 5% Russian/Polish/Slavic 1% Other Asian/Pacific 1%
Political lean MEDSL · Pike
- 2024 margin
- Strong R (+24.1) · D 37.6% · R 61.6%
- 2008→2024 swing
- -19.8pp toward R · 2008: -4.2pp · 2024: -24.1pp
- All cycles
- 2024: R+24.1 2020: R+19.0 2016: R+26.0 2012: R+11.0 2008: R+4.2
Not yet ingested
- Civics
- —
Market trends
- HPI YoY
- ▲ 28.60%
- Current HPI
- 340.8254
- Rent YoY
- —
- Metro
- —
- State GDP YoY
- ▲ 1.68%
- F500 in state
- 34
Industry mix (Fortune 500 HQ in PA)
| Industry | F500 HQs | Revenue |
|---|---|---|
| Healthcare | 2 | $309B |
|
||
| Insurance | 2 | $27B |
|
||
| Telecommunications / Media | 1 | $124B |
|
||
| Industrial Distribution | 1 | $22B |
|
||
| Financial Services | 1 | $20B |
|
||
| Chemicals / Materials | 1 | $18B |
|
||
Price history
+2547.1% since first listed10 events — show timeline
- 2026-06-07 Price Changed $315,000 PWMLS
- 2026-06-07 Listed $335,000 PWMLS
- 2024-04-27 Rental Removed $2,350 Avail
- 2024-04-07 Listed for Rent $2,350 Avail
- 2021-06-28 Sold (Public Records) $214,000 Public Records
- 2021-06-07 Sold (MLS) $214,000 PWMLS
- 2021-06-07 Sold (MLS) — PWMLS
- 2021-04-02 Listed $209,000 PWMLS
- 2021-04-02 Listed $209,000 PWMLS
- 1986-10-06 Sold (Public Records) $11,900 Public Records
Property tax history
+2.8%/yrLatest (2026): $3,453 · +3.0% YoY. Source: county tax records.
Cash-flow waterfall
monthlySold comps — $/sqft
last 12 mo · ≤1 miLoading sold comps…