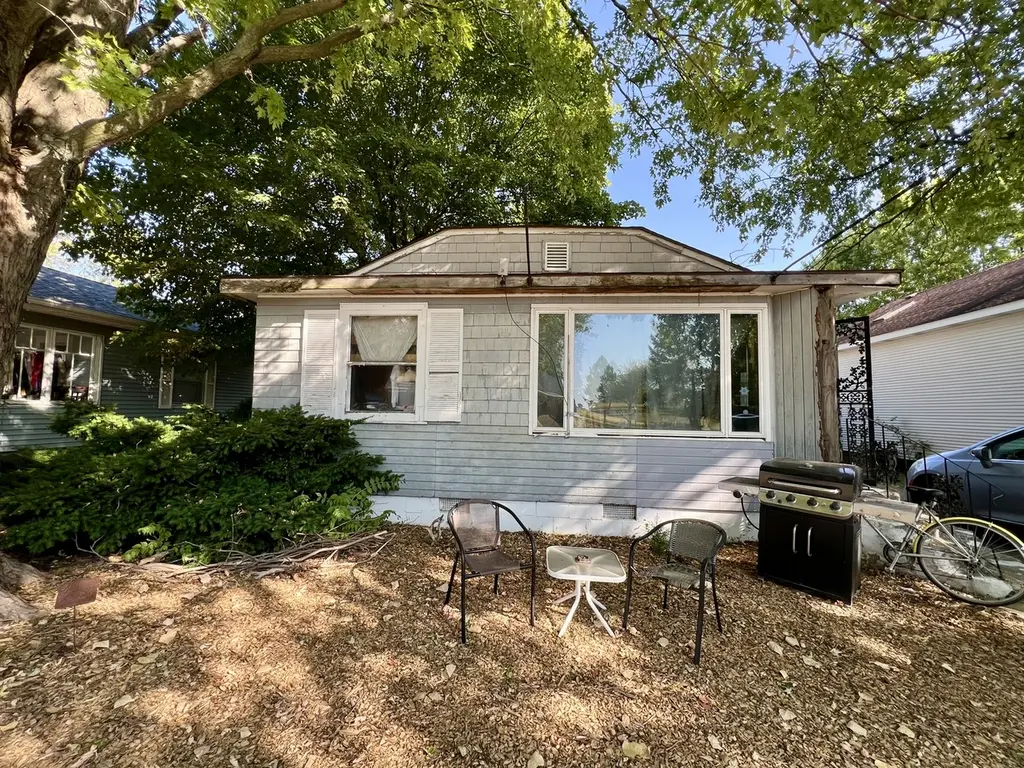
514 Harrison St · Villa Grove, IL
Flood risk 4/10 · Minor
- FEMA flood zone
- AE
- Chance of flooding over 30 yrs
- 0.22%
- Est. flood insurance / yr
- $2,026 – $9,024
Fire risk 1/10 · Minimal
- Est. fire insurance / yr
- $804 – $1,492
Heat risk 3/10 · Minor
- Hot days now (above 105°F)
- 7 days/yr
- Hot days in 30 yrs
- 19 days/yr
Wind risk 2/10 · Minimal
- Chance of severe wind over 30 yrs
- 2.0%
Air-quality risk 2/10 · Minimal
- Unhealthy air days now
- 1 days/yr
- Unhealthy air days in 30 yrs
- 1 days/yr
Risk factors via First Street. Map © Google.
Why this score? — see what drove the B grade
The composite is a weighted blend of 9 inputs, each scored 0–100. Each bar is that input's sub-score; the figure is the points it added to the 100-point composite (weight × sub-score).
- Cash flow +30.0/30.0
- ARV discount +15.0/15.0
- 1% rule +10.0/10.0
- DSCR +10.0/10.0
- Livability +3.2/5.0
- Rent growth +2.5/5.0
- Condition / age +2.5/5.0
- Schools +1.6/10.0
- Appreciation +0.0/10.0
$75,000
🖨 Deal sheet 📄 Offer letter ✓ Due diligence
Listing remarks MLS
Make this three bedroom home your own or add to your portfolio! The flowing layout begins in the spacious living room, continues into the separate dining room and large kitchen. You'll love the space found in all three bedrooms. Relax under the beautiful shade trees in the yard and discover fantastic storage in the attached garage! Sold as is.
Key facts
- 6,186 sq ft lot
- Garage
- Built 1909
Neighborhood map
What this means for you Summary
Snapshot
- This is a 3-bed/1.0-bath single-family listed at $75k.
Deal economics
- At list price, monthly cash flow is $-59 ($-707/yr) — negative.
- To cash-flow at today's rent, offer at most $65k (13.9% below list).
- Meets the 1% rule at list price ($1k rent vs $75k).
- Recommended offer: $65k (13.9% below list) — sets the bar for cash-flow.
Location & tenants
- Location reads 64/100 on livability (#713 in IL) — a middle-class / working-renter tenant base. Strengths: cost of living A+, crime A, housing A; Watch: employment D, schools D-, amenities F.
- Villa Grove CUSD 302 (rural): math 15% / reading 19% proficiency, ranked #464 of 620 in IL (top 75%) — low school quality limits family demand, transient renter base, plan for 1-2y turnover.
- Market conditions: 10 active listings in the ZIP; 36 units permitted in Douglas County in 2024 (0 in 5+ unit buildings).
Forward outlook
- Local home prices are declining (-3.0%/yr); year-one equity from $519 of loan paydown is wiped out by about $2k of value loss. Plan a longer hold.
- Douglas County population projected to shrink 7% by 2050 — rents likely to lag national; underwrite the cash flow, not the appreciation.
Negotiation context
- It's been on market 28 days — a 2% lower offer ($74k) is reasonable based on typical stale-listing flexibility.
- 2 sale attempts since 18y ago with the ask held roughly flat each time — persistent listings suggest the price (not the market) is what's stuck; bring a comps-based counter.
- Current owner paid $58k; 29% above their basis — modest negotiation headroom, anchor on the comps not their cost.
Risks & watch-outs
- Watch-outs: flood insurance adds $460/mo; built in 1909 — expect roof / HVAC / electrical / plumbing capex.
- Climate carrying-cost: in FEMA flood zone AE (mandatory federal flood insurance) — expect insurance premiums to compound above CPI over the hold.
Questions for the listing agent
- What do current leases actually rent for vs. the listed asking? Can we see a recent rent roll and the last 12 months of T-12 income?
- Built in 1909 — when were the roof, HVAC, electrical panel, plumbing, and water heater last replaced?
- What's the actual annual flood-insurance premium (NFIP or private), and is the property in a SFHA with mandatory coverage?
- Is there a deadline driving the sale (1031 exchange, divorce, estate, relocation)? That informs how much negotiation room exists.
- Schools are D-rated, which usually means shorter tenancies and higher turnover. Who's the typical renter profile here, and what's been the actual vacancy rate?
- What's the average days-on-market for RENTAL listings here right now (not sales)? A rising rental-DOM trend means longer vacancies and softer asking-rent achievability than the comps imply.
- What's the recent tenant-quality profile in this submarket — average credit score on applications, eviction rate, late-payment / NSF rate, and stable-employment percentage? A property-management company in the area should have these aggregated.
- How much new for-sale + rental construction is in the pipeline within 1–3 miles? Heavy new supply typically softens prices + rents 12–24 months out; constrained supply supports both.
Investment metrics
- 1% rule
- 1.56% ✓
- Cap rate
- 12.72%
- Cash-on-cash
- 22.94%
- DSCR
- 2.02
- GRM
- 5.4
CMA / ARV
- ARV (median comp)
- $92,300
- List price
- $75,000
- Delta
- -18.74%
- Verdict
- UNDERPRICED
- Comps
- 20 within 1.0 mi
Show comp detail 12 sales within ~0.75 mi
| Address | Dist | Beds/Ba | Sqft | Sold | Price | $/sf | Match |
|---|---|---|---|---|---|---|---|
| 502 North Pine St | 0.31mi | 3/1.0 | 1,372 (+0%) | 16mo | $215,000 | $157 | 72 |
| 506 W Wilson St | 0.14mi | 3/1.0 | 1,231 (-10%) | 5mo | $140,000 | $114 | 72 |
| 11 N Richman St | 0.22mi | 3/2.0 | 1,396 (+2%) | 19mo | $110,000 | $79 | 67 |
| 404 S Elm St | 0.72mi | 3/1.0 | 1,350 (-2%) | 3mo | $86,000 | $64 | 62 |
| 201 S Douglas St | 0.37mi | 3/1.5 | 1,246 (-9%) | 6mo | $85,000 | $68 | 60 |
| 301 S Douglas St | 0.44mi | 3/1.5 | 1,512 (+10%) | 4mo | $119,500 | $79 | 57 |
| 206 N Pine St | 0.26mi | 3/0.5 | 1,192 (-13%) | 10mo | $102,000 | $86 | 56 |
| 412 W Harrison St | 0.08mi | 2/2.0 (-1) | 1,175 (-14%) | 12mo | $48,000 | $41 | 53 |
| 111 S Pine St | 0.44mi | 3/2.0 | 1,290 (-6%) | 16mo | $112,500 | $87 | 52 |
| 203 Ruby St | 0.56mi | 4/2.0 (+1) | 1,408 (+3%) | 14mo | $160,000 | $114 | 49 |
| 501 S Spruce St | 0.72mi | 3/2.0 | 1,460 (+6%) | 7mo | $48,000 | $33 | 46 |
| 112 W Vine St | 0.29mi | 3/1.5 | 1,570 (+14%) | 21mo | $130,000 | $83 | 43 |
Match score weights: distance 35% · size 25% · config 20% · recency 20%. Top-matched comps best support the ARV.
Projected returns pro-forma
-3.0% appreciation · 3.0% rent growth · sell at horizon
- IRR
- -21.4%
- Equity multiple
- 0.26×
- Total profit
- $-15,604
- Equity at exit
- $11,183
- IRR
- -13.9%
- Equity multiple
- 0.18×
- Total profit
- $-17,193
- Equity at exit
- $6,485
Cash invested: $21,000 (down + closing). Projections, not guarantees.
Landlord ↔ Tenant lean methodology
- Overall (STATE)
- 43 Moderately Tenant-Leaning
- State Illinois
- 43 Moderately Tenant-Leaning · D+7
- County
- — inherits STATE
- City
- — inherits STATE
ZIP-level market 61956
- Home prices YoY
- -9.3%
- Active inventory
- 10
- Price-to-rent
- 5.4×
Monthly cashflow live
- Estimated rent
- $1,167 medium interval (Pro) →
- Mortgage (P&I)
- −$393
- Tax from tax record
- −$96 /mo · $1,152/yr
- Insurance
- −$31
- Flood insurance flood zone
- −$460 /mo · $5,525/yr
- HOA
- −$0
- Vacancy / Maint / Mgmt
- −$245
- Net cashflow
- $-59
Break-even live
UW: 25.0% down · 7.5% · 30yr · 1.5% tax · 5.0% vac · 8.0% maint · 8.0% mgmt
Financing live
Cash to close
- Down payment
- $18,750
- Closing costs
- $2,250
- Reserves months
- —
- Total cash needed
- —
Loan-product check · same deal, 3 products live
Conventional
25% down · 7.5% · 30yr
- Down + closing
- —
- Monthly P&I
- —
- Monthly cashflow
- —
- DSCR
- —
- Eligible?
- —
Personal DTI + credit; lowest rate.
DSCR
20% down · 8.5% · 30yr
- Down + closing
- —
- Monthly P&I
- —
- Monthly cashflow
- —
- DSCR
- —
- Eligible?
- —
No personal income docs; deal must DSCR.
Hard money
10% down · 12.0% · 12mo
- Down + closing
- —
- Monthly P&I
- —
- Monthly cashflow
- —
- DSCR
- —
- Eligible?
- —
Short-term bridge; refi at stabilization.
Listing history 19 events
-
2026-06-18days on market $75,000 Active 28 DOM
-
2026-06-17days on market $75,000 Active 27 DOM
-
2026-06-16days on market $75,000 Active 26 DOM
-
2026-06-15days on market $75,000 Active 25 DOM
-
2026-06-13days on market $75,000 Active 23 DOM
-
2026-06-12days on market $75,000 Active 22 DOM
-
2026-06-09days on market $75,000 Active 256 DOM
-
2026-06-08days on market $75,000 Active 255 DOM
-
2026-06-07days on market $75,000 Active 254 DOM
-
2026-06-05days on market $75,000 Active 252 DOM
-
2026-06-04days on market $75,000 Active 250 DOM
-
2026-06-02days on market $75,000 Active 249 DOM
-
2026-06-01days on market $75,000 Active 248 DOM
-
2026-05-31days on market $75,000 Active 247 DOM
-
2026-05-31days on market $75,000 Active 246 DOM
-
2025-09-26$75,000 Active 345-char remark
Show marketing remark (345 chars)
Make this three bedroom home your own or add to your portfolio! The flowing layout begins in the spacious living room, continues into the separate dining room and large kitchen. You'll love the space found in all three bedrooms. Relax under the beautiful shade trees in the yard and discover fantastic storage in the attached garage! Sold as is.
-
2009-02-25soldstatus $58,000 82-char remark
Show marketing remark (82 chars)
IMMACULATE 3 BEDROOM HOME, SPACIOUS LIVING ROOM KITCHEN W/PLENTY OF WOOD CABINETS.
-
2009-02-25soldstatus $58,000
Show marketing remark (82 chars)
IMMACULATE 3 BEDROOM HOME, SPACIOUS LIVING ROOM KITCHEN W/PLENTY OF WOOD CABINETS.
-
2008-10-23$69,500 82-char remark
Show marketing remark (82 chars)
IMMACULATE 3 BEDROOM HOME, SPACIOUS LIVING ROOM KITCHEN W/PLENTY OF WOOD CABINETS.
ⓘ Source: listings_history table (triggers on properties + properties_extension) + one-shot
backfill from property_details.listing_events for pre-trigger history.
Tax reassessment forecast IL · Partial reset (capped growth)
- Current annual tax
- $1,152 · $96/mo
- Projected year-2 tax
- $1,427 · $119/mo
- Expected delta
- +$275/yr (+$23/mo · 23.9%)
ⓘ Screening estimate from a state-policy table — verify with the county assessor before closing.
Climate risk First Street
- Flood 4/10 Moderate FEMA zone AE · 22% chance over 30 yrs
- Wildfire 1/10 Low
- Heat 3/10 Moderate 7 d/yr ≥105°F today · 19 d/yr by 30 yrs out
- Wind 2/10 Low 2% chance of damaging wind over 30 yrs
- Air quality 2/10 Low 1 unhealthy d/yr today · 1 by 30 yrs out
Nearby sold comps map
Loading sold comps map…
Walkable amenities ~0.75 mi
Loading nearby amenities…
Taxation est. · year 1
- Rental income
- $14,006
- − Mortgage interest
- −$4,201
- − Property taxes
- −$1,152
- − Insurance
- −$5,900
- − Repairs & maintenance
- −$1,120
- − Management
- −$1,120
- − Depreciation
- −$2,182
- Taxable loss
- −$1,670
- Est. tax savings @ 24.0%
- +$401
- After-tax cash flow
- $-306/yr
For passive investors: Depreciation is non-cash, so a rental often shows a tax loss while cash-flowing — sheltering income. Rental losses are passive: they offset passive income freely, and up to $25,000/yr can offset ordinary (W-2) income if you actively participate and your MAGI is under $100k (phasing out to $0 by $150k); unused losses carry forward. On sale, claimed depreciation is recaptured at up to 25%, and gains may owe capital-gains tax (a 1031 exchange can defer both). Figures are a year-1 estimate at your 24.0% rate — not tax advice; consult a CPA.
Schools (NCES district)
- District
- Villa Grove CUSD 302
- NCES district ID
- 1740320
- Math proficiency
- 15% ▼ -6.00%
- Reading proficiency
- 19% ▼ -12.00%
- Median HH income
- $52,614
- Composite
- 15.67/100
- National rank
- #9286
- State rank
- #464 of 620 in IL
Livability — Villa Grove
- Score
- 64/100
- State rank
- #713
- US rank
- #14496
Category grades
Schools grade is shown separately in the Schools card above.
Census & demographics
- Census place
- Villa Grove, IL
- Population (ZIP)
- 3,046
Population outlook (Douglas County) Hauer SSP2
- Today (2025)
- 19,209 people
- By 2030
- 18,940 · -1.4%
- By 2040
- 18,397 · -4.2%
- By 2050
- 17,829 · -7.2%
- By 2075
- 16,395 · -14.6%
- By 2100
- 14,329 · -25.4%
Race, ethnicity, and origin ACS 2023
- Neighborhood character
- Predominantly White (97%)
- Race & ethnicity
- White 97% Asian 1% Hispanic / Latino 1% Two or more races 1%
- Common ancestry
- Italian 2% Iranian 2% Slovak 2%
- Foreign-born
- 2% · Canada
- Languages at home
- 96% English-only · Russian/Polish/Slavic 1% Spanish 1% French/Haitian/Cajun 1%
Political lean MEDSL · Douglas
- 2024 margin
- Solid R (+46.1) · D 26.1% · R 72.3% · Other 1.6%
- 2008→2024 swing
- -24.9pp toward R · 2008: -21.3pp · 2024: -46.1pp
- All cycles
- 2024: R+46.1 2020: R+44.4 2016: R+46.3 2012: R+36.8 2008: R+21.3
Not yet ingested
- Civics
- —
Market trends
- HPI YoY
- ▼ -21.97%
- Current HPI
- 213.6799
- Rent YoY
- —
- Metro
- —
- State GDP YoY
- ▲ 1.59%
- F500 in state
- 60
Industry mix (Fortune 500 HQ in IL)
| Industry | F500 HQs | Revenue |
|---|---|---|
| Insurance | 4 | $201B |
|
||
| Consumer Goods | 4 | $87B |
|
||
| Industrial Machinery | 3 | $64B |
|
||
| Healthcare | 2 | $55B |
|
||
| Retail / Pharmacy | 1 | $148B |
|
||
| Agriculture / Food | 1 | $86B |
|
||
Price history
+7.9% since first listed4 events — show timeline
- 2025-09-26 Listed $75,000 MRED as Distributed by MLS Grid
- 2009-02-25 Sold (Public Records) $58,000 Public Records
- 2009-02-25 Sold (MLS) $58,000 MRED as Distributed by MLS Grid
- 2008-10-23 Listed $69,500 MRED as Distributed by MLS Grid
Property tax history
-2.8%/yrLatest (2024): $1,152 · +92.3% YoY. Source: county tax records.
Cash-flow waterfall
monthlySold comps — $/sqft
last 12 mo · ≤1 miLoading sold comps…