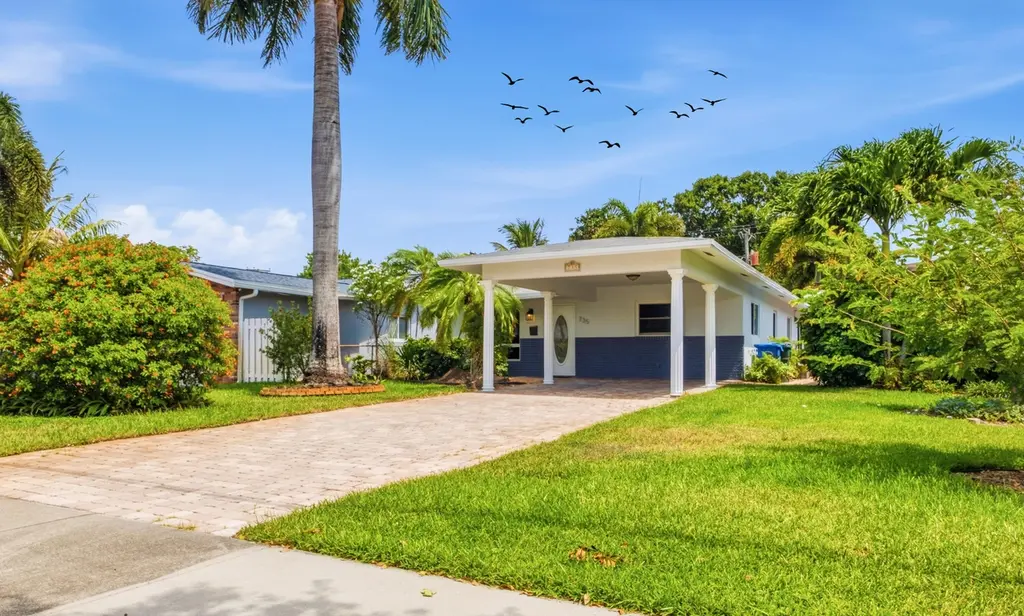
735 NE 34th Ct · Oakland Park, FL
Flood risk 4/10 · Minor
- FEMA flood zone
- X (shaded)
- Chance of flooding over 30 yrs
- 0.13%
- Est. flood insurance / yr
- $507 – $1,088
Fire risk 1/10 · Minimal
- Est. fire insurance / yr
- $947 – $1,759
Heat risk 10/10 · Severe
- Hot days now (above 105°F)
- 7 days/yr
- Hot days in 30 yrs
- 27 days/yr
Wind risk 10/10 · Severe
- Chance of severe wind over 30 yrs
- 99.0%
Air-quality risk 2/10 · Minimal
- Unhealthy air days now
- 1 days/yr
- Unhealthy air days in 30 yrs
- 2 days/yr
Risk factors via First Street. Map © Google.
Why this score? — see what drove the D grade
The composite is a weighted blend of 9 inputs, each scored 0–100. Each bar is that input's sub-score; the figure is the points it added to the 100-point composite (weight × sub-score).
- Cash flow +15.2/30.0
- ARV discount +7.2/15.0
- DSCR +4.7/10.0
- Schools +4.1/10.0
- Livability +3.9/5.0
- 1% rule +3.3/10.0
- Rent growth +3.0/5.0
- Condition / age +2.5/5.0
- Appreciation +0.0/10.0
$439,000
🖨 Deal sheet (PDF) 📄 Offer letter ✓ Due diligence
Listing remarks
Lovely 2 bedroom, 1.5 bath home no HOA no restrictions. Freshly painted inside and out, home feels clean, bright, and move-in ready. All impact windows provide security, storm protection, and peace of mind. Roof New! Features include an open-concept kitchen that flows into the main living space, creating a comfortable layout for everyday living and entertaining. An oversized Florida room adds flexible space for a media room, home office, or additional living area. Exterior highlights include a paver driveway, 1-car carport, and a large storage shed. The spacious backyard is designed for relaxing and entertaining, featuring a large patio and tropical landscaping. Ideally located just minutes
Key facts
- Spacious backyard
- Open-concept kitchen
- Paver driveway
Tags
Property features AI
Finance
- Other: Pets allowed with no restrictions
Exterior
- Parking: Attached carport (1 covered space); Driveway
- Utilities: Public water; Public sewer; Cable available; Electricity available
- Home design: Single family residence; One story; Resale property; Facing south
- Construction: Stucco and other exterior materials; Built as a single-story structure
- Exterior features: Not waterfront; Tile roof
Interior
- Kitchen: Electric range; Dishwasher; Microwave; Refrigerator; Food disposal
- Bedrooms: 1 bedroom on the main level
- Flooring: Carpet; Tile; Wood
- Bathrooms: 1 full bathroom; 1 half bathroom
- Heating & cooling: Central electric heating; Central air; Ceiling fans
- Interior features: Disposal, Dishwasher, Electric Range, Microwave, Refrigerator; Satellite dish
- Laundry & utility: Indoor laundry room
Neighborhood map
What this means for you Summary
Snapshot
- This is a 2-bed/1.0-bath single-family listed at $439k.
Deal economics
- At list price, monthly cash flow is $154 ($2k/yr) — positive.
- The deal already cash-flows at list — no discount required.
- To meet the 1% rule (rent ≥ 1% of price), the offer needs to be $366k (16.7% below list).
- Recommended offer: $366k (16.7% below list) — sets the bar for 1% rule.
- Cap rate 6.7% vs local median 3.8% in Oakland Park — top-decile yield for the area; either an underpriced asset or a hidden risk that comps aren't pricing in. Stress-test before assuming the spread holds.
Location & tenants
- Location reads 77/100 on livability (#193 in FL, #3,082 nationally) — a middle-class / working-renter tenant base. Strengths: commute A+, housing A+, health & safety A+; Watch: amenities F.
- Broward (suburban): math 42% / reading 53% proficiency, ranked #46 of 73 in FL (top 63%) — families likely to look elsewhere, expect single-tenant / working-renter base with shorter leases.
- Zoned schools: Oakland Park Elementary School (math 31% / reading 45%, grade F, #1,587 of 2,144 statewide, top 74%, 576 students, 83% FRL); James S. Rickards Middle School (math 18% / reading 31%, grade F, #522 of 571 statewide, top 93%, 755 students, 75% FRL); Northeast High School (math 12% / reading 37%, grade F, #505 of 667 statewide, top 79%, 1,552 students, 69% FRL) — zoned schools average 76% FRL vs 51% district-wide (25 pts higher); higher-poverty schools than district average — tighter screening recommended.
- Zoned-school proficiency averages 29% at this address vs 48% district-wide (-18 pts) — the specific schools serving this property underperform the Broward average; the district grade overstates school quality for this exact location.
- Market conditions: Rents rising (+2.0%/yr); 356 active listings in the ZIP; 40 comparable units currently listed for rent nearby; rentals at typical pace (median 23d on market — plan ~3-4 weeks tenant-placement turnaround); solid renter incomes; 2,111 units permitted in Broward County in 2024 (1,265 in 5+ unit buildings).
- At $3,658/mo this rent would consume 58% of the median local household income ($75k/yr) (locally 1755% of renters already pay >50% of income on rent) — very limited rent-growth headroom before tenants either downsize or default.
Forward outlook
- Local home prices are declining (-3.0%/yr); year-one equity from $3k of loan paydown is wiped out by about $13k of value loss. Plan a longer hold.
- Broward County population projected at +34% by 2050 — long-run rental-demand tailwind backs the buy-and-hold thesis.
Negotiation context
- Only 9 days on market — expect competitive offers; lowballing is unlikely to land.
- Current owner paid $209k; list at $439k implies a 110% gain — meaningful room to come down on a strong offer.
Risks & watch-outs
- Climate carrying-cost: severe wind risk, 99% chance of damaging wind over 30y; extreme-heat days projected 7→27/yr by 2055 (HVAC capex compounding) — expect insurance premiums to compound above CPI over the hold.
Questions for the listing agent
- Built in 1971 — when were the roof, HVAC, electrical panel, plumbing, and water heater last replaced?
- Is there a deadline driving the sale (1031 exchange, divorce, estate, relocation)? That informs how much negotiation room exists.
- Schools are D-rated, which usually means shorter tenancies and higher turnover. Who's the typical renter profile here, and what's been the actual vacancy rate?
- The area grade is low — what's the realistic commute time and amenity access for the typical tenant pool here? Any planned neighborhood developments (good or bad) we should know about?
- What's the average days-on-market for RENTAL listings here right now (not sales)? A rising rental-DOM trend means longer vacancies and softer asking-rent achievability than the comps imply.
- What's the recent tenant-quality profile in this submarket — average credit score on applications, eviction rate, late-payment / NSF rate, and stable-employment percentage? A property-management company in the area should have these aggregated.
- How much new for-sale + rental construction is in the pipeline within 1–3 miles? Heavy new supply typically softens prices + rents 12–24 months out; constrained supply supports both.
Investment metrics
- 1% rule
- 0.83% ✗
- Cap rate
- 6.71%
- Cash-on-cash
- 1.50%
- DSCR
- 1.07
- GRM
- 10.0
CMA / ARV
- ARV (on-the-fly)
- $436,080
- Comps found
- 7
Show comp detail 7 sales within ~0.75 mi
| Address | Dist | Beds/Ba | Sqft | Sold | Price | $/sf | Match |
|---|---|---|---|---|---|---|---|
| 960 NE 35th St | 0.14mi | 3/2.0 (+1) | 1,270 (-8%) | 3mo | $360,000 | $283 | 69 |
| 350 NE 42nd St | 0.59mi | 2/1.0 | 1,268 (-8%) | 2mo | $375,000 | $296 | 57 |
| 1499 NE 39th St | 0.61mi | 2/2.0 | 1,451 (+5%) | 3mo | $765,000 | $527 | 56 |
| 2701 NE 10th Ter | 0.70mi | 2/2.0 | 1,292 (-6%) | 3mo | $750,000 | $580 | 51 |
| 124 Almar Dr | 0.64mi | 2/2.0 | 1,504 (+9%) | 2mo | $475,600 | $316 | 49 |
| 299 NE 35th St | 0.35mi | 3/2.0 (+1) | 1,280 (-7%) | 23mo | $470,000 | $367 | 43 |
| 3317 N Andrews Ave | 0.61mi | 2/1.0 | 1,246 (-10%) | 20mo | $360,000 | $289 | 38 |
Match score weights: distance 35% · size 25% · config 20% · recency 20%. Top-matched comps best support the ARV.
Projected returns pro-forma
-3.0% appreciation · 2.01% rent growth · sell at horizon
- IRR
- -15.0%
- Equity multiple
- 0.47×
- Total profit
- $-65,096
- Equity at exit
- $65,456
- IRR
- -8.0%
- Equity multiple
- 0.52×
- Total profit
- $-59,127
- Equity at exit
- $37,957
Cash invested: $122,920 (down + closing). Projections, not guarantees.
Landlord ↔ Tenant lean methodology
- Overall (STATE)
- 87 Strongly Landlord-Friendly
- State Florida
- 87 Strongly Landlord-Friendly · R+3
- County
- — inherits STATE
- City
- — inherits STATE
ZIP-level market 33334
- Home prices YoY
- -34.6%
- Rents YoY
- 2.0%
- Active inventory
- 356
- Price-to-rent
- 10.0×
Monthly cashflow live
- Estimated rent
- $3,658 high interval (Pro) →
- Mortgage (P&I)
- −$2,302
- Tax from tax record
- −$251 /mo · $3,016/yr
- Insurance
- −$183
- HOA
- −$0
- Vacancy / Maint / Mgmt
- −$768
- Net cashflow
- $154
Break-even live
Sensitivity live
| Price | -10% $402 | -5% $278 | +0% $154 | +5% $29 | +10% $-95 |
|---|---|---|---|---|---|
| Rent | -10% $-135 | -5% $9 | +0% $154 | +5% $298 | +10% $443 |
| Rate | -1.0pp $375 | -0.5pp $265 | base $154 | +0.5pp $40 | +1.0pp $-76 |
UW: 25.0% down · 7.5% · 30yr · 1.5% tax · 5.0% vac · 8.0% maint · 8.0% mgmt
Financing live
Cash to close
- Down payment
- $109,750
- Closing costs
- $13,170
- Reserves months
- —
- Total cash needed
- —
Loan-product check · same deal, 3 products live
Conventional
25% down · 7.5% · 30yr
- Down + closing
- —
- Monthly P&I
- —
- Monthly cashflow
- —
- DSCR
- —
- Eligible?
- —
Personal DTI + credit; lowest rate.
DSCR
20% down · 8.5% · 30yr
- Down + closing
- —
- Monthly P&I
- —
- Monthly cashflow
- —
- DSCR
- —
- Eligible?
- —
No personal income docs; deal must DSCR.
Hard money
10% down · 12.0% · 12mo
- Down + closing
- —
- Monthly P&I
- —
- Monthly cashflow
- —
- DSCR
- —
- Eligible?
- —
Short-term bridge; refi at stabilization.
Rent comps 40 comps
| Address | Beds | Baths | Sqft | Rent | $/sqft | DOM | Units | Dist |
|---|---|---|---|---|---|---|---|---|
| 1068 NE 35th St Oakland Park, FL | 3.0 | 3.5 | 1787 | $3,900 | $2.18 | 7d | 1 | 0.25mi |
| 3801 Dixie Hwy Oakland Park, FL | 2.0 | 1.0–2.0 | 944 | $3,584 | $3.80 | 1d | 41 | 0.37mi |
| 3000 NE 6th Ave Wilton Manors, FL | 2.0 | 1.0–2.0 | 921 | $3,510 | $3.81 | 0d | 19 | 0.43mi |
| 3320 NE 13th Ave Unit 3320 Oakland Park, FL | 3.0 | 2.5 | 1433 | $3,600 | $2.51 | 26d | 1 | 0.49mi |
| 417 NE 29th St Wilton Manors, FL | 3.0 | 2.0 | 1596 | $5,800 | $3.63 | 26d | 1 | 0.55mi |
| 351 NE 41st St Oakland Park, FL | 2.0 | 1.0 | 900 | $3,400 | $3.78 | 26d | 1 | 0.56mi |
| 2816 NE 9th Ter Wilton Manors, FL | 2.0 | 1.0 | 1146 | $3,800 | $3.32 | 26d | 1 | 0.58mi |
| 609 NE 28th St #1 Wilton Manors, FL | 3.0 | 3.5 | 1800 | $3,300 | $1.83 | 17d | 1 | 0.58mi |
| 105 NE 30th Ct Unit 107 Wilton Manors, FL | 3.0 | 2.0 | 1325 | $3,700 | $2.79 | 17d | 1 | 0.60mi |
| 105 NE 30th Ct Unit 107 Wilton Manors, FL | 3.0 | 2.0 | 1325 | $3,500 | $2.64 | 12d | 1 | 0.60mi |
| 1547 NE 34th St Unit 1541793P Oakland Park, FL | 3.0 | 2.0 | 1689 | $5,071 | $3.00 | 9d | 1 | 0.60mi |
| 682 NE 43rd St Oakland Park, FL | 3.0 | 2.5 | 1694 | $4,200 | $2.48 | 26d | 1 | 0.61mi |
| 108 NE 30th St Wilton Manors, FL | 3.0 | 2.0 | 1228 | $8,500 | $6.92 | 26d | 1 | 0.62mi |
| 108 NE 30th St Wilton Manors, FL | 3.0 | 2.0 | 1228 | $8,000 | $6.51 | 7d | 1 | 0.62mi |
| 1350 NE 30th St Oakland Park, FL | 2.0 | 2.0 | 1536 | $4,500 | $2.93 | 26d | 1 | 0.64mi |
| 3680 NE 16th Ave Oakland Park, FL | 3.0 | 2.0 | 1560 | $4,200 | $2.69 | 16d | 1 | 0.70mi |
| 1421 NE 41st St Oakland Park, FL | 2.0 | 2.0 | 1366 | $4,000 | $2.93 | 26d | 1 | 0.74mi |
| 1680 NE 34th Ln Unit B Oakland Park, FL | 2.0 | 2.0 | 1084 | $3,100 | $2.86 | 22d | 1 | 0.77mi |
| 4360 NE 13th Ave Oakland Park, FL | 3.0 | 2.0 | 1269 | $3,700 | $2.92 | 1d | 1 | 0.83mi |
| 4360 NE 13th Ave Oakland Park, FL | 3.0 | 2.0 | 1269 | $3,700 | $2.92 | 26d | 1 | 0.83mi |
| 4360 NE 13th Ave Unit Main Oakland Park, FL | 3.0 | 2.0 | 1269 | $4,500 | $3.55 | 24d | 1 | 0.83mi |
| 4360 NE 13th Ave Oakland Park, FL | 3.0 | 2.0 | 1459 | $3,700 | $2.54 | 7d | 1 | 0.83mi |
| 331 NW 38th St Oakland Park, FL | 2.0 | 1.5 | 1040 | $3,900 | $3.75 | 19d | 1 | 0.83mi |
| 331 NW 38th St Oakland Park, FL | 2.0 | 1.5 | 1040 | $3,900 | $3.75 | 9d | 1 | 0.83mi |
| 2601 NE 14th Ave #507 Wilton Manors, FL | 2.0 | 2.0 | 1650 | $4,000 | $2.42 | 26d | 1 | 0.84mi |
| 261 NE 45th St Fort Lauderdale, FL | 3.0 | 2.0 | 997 | $3,247 | $3.26 | 26d | 1 | 0.86mi |
| 2741 NE 16th Ave Wilton Manors, FL | 2.0 | 2.0 | 1400 | $3,500 | $2.50 | 1d | 1 | 0.87mi |
| 2741 NE 16th Ave Wilton Manors, FL | 2.0 | 2.0 | 1400 | $3,500 | $2.50 | 26d | 1 | 0.87mi |
| 425 NE 25th St Wilton Manors, FL | 3.0 | 2.0 | 1439 | $8,000 | $5.56 | 26d | 1 | 0.88mi |
| 4601 NE 4th Ave Unit 1261561P Fort Lauderdale, FL | 3.0 | 2.0 | 1097 | $4,430 | $4.04 | 26d | 1 | 0.91mi |
| 2301 Wilton Dr Unit R309 Wilton Manors, FL | 2.0 | 2.0 | 1386 | $3,850 | $2.78 | 13d | 1 | 0.92mi |
| 4580 NE 3rd Ave Fort Lauderdale, FL | 3.0 | 2.0 | 1192 | $3,300 | $2.77 | 22d | 1 | 0.93mi |
| 3602 NE 18th Ave Oakland Park, FL | 3.0 | 3.0 | 1779 | $5,200 | $2.92 | 22d | 1 | 0.95mi |
| 1733 Coral Gardens Dr Wilton Manors, FL | 3.0 | 3.0 | 1650 | $10,500 | $6.36 | 22d | 1 | 0.96mi |
| 4511 NE 13th Ave Oakland Park, FL | 3.0 | 3.0 | 1416 | $4,300 | $3.04 | 26d | 1 | 0.96mi |
| 4511 NE 13th Ave Oakland Park, FL | 2.0 | 2.0 | 1400 | $3,200 | $2.29 | 9d | 1 | 0.96mi |
| 4511 NE 13th Ave Oakland Park, FL | 3.0 | 3.0 | 1416 | $4,300 | $3.04 | 6d | 1 | 0.96mi |
| 4680 NE 5th Ave Fort Lauderdale, FL | 3.0 | 2.0 | 1300 | $3,800 | $2.92 | 9d | 1 | 0.98mi |
| 2957 NW 6th Ave Wilton Manors, FL | 2.0 | 2.0 | 1104 | $3,900 | $3.53 | 26d | 1 | 0.98mi |
| 4650 NE 2nd Ave Fort Lauderdale, FL | 3.0 | 2.0 | 1356 | $3,950 | $2.91 | 26d | 1 | 1.02mi |
Listing history 7 events
-
2026-06-21days on market $439,000 Active 9 DOM
-
2026-06-18days on market $439,000 Active 6 DOM
-
2026-06-17days on market $439,000 Active 5 DOM
-
2026-06-16days on market $439,000 Active 4 DOM
-
2026-06-15days on market $439,000 Active 3 DOM
-
2026-06-13remarks 699-char remark
-
2026-06-13$439,000 Active 1 DOM
ⓘ Source: listings_history table (triggers on properties + properties_extension) + one-shot
backfill from property_details.listing_events for pre-trigger history.
Tax reassessment forecast FL · Resets to sale price
- Current annual tax
- $3,016 · $251/mo
- Projected year-2 tax
- $3,644 · $304/mo
- Expected delta
- +$628/yr (+$52/mo · 20.8%)
ⓘ Screening estimate from a state-policy table — verify with the county assessor before closing.
Climate risk First Street
- Flood 4/10 Moderate FEMA zone X (shaded) · 13% chance over 30 yrs
- Wildfire 1/10 Low
- Heat 10/10 Extreme 7 d/yr ≥105°F today · 27 d/yr by 30 yrs out
- Wind 10/10 Extreme 99% chance of damaging wind over 30 yrs
- Air quality 2/10 Low 1 unhealthy d/yr today · 2 by 30 yrs out
Nearby sold comps map
Loading sold comps map…
Walkable amenities ~0.75 mi
Loading nearby amenities…
Taxation est. · year 1
- Rental income
- $43,897
- − Mortgage interest
- −$24,591
- − Property taxes
- −$3,016
- − Insurance
- −$2,195
- − Repairs & maintenance
- −$3,512
- − Management
- −$3,512
- − Depreciation
- −$12,771
- Taxable loss
- −$5,699
- Est. tax savings @ 24.0%
- +$1,368
- After-tax cash flow
- $3,210/yr
For passive investors: Depreciation is non-cash, so a rental often shows a tax loss while cash-flowing — sheltering income. Rental losses are passive: they offset passive income freely, and up to $25,000/yr can offset ordinary (W-2) income if you actively participate and your MAGI is under $100k (phasing out to $0 by $150k); unused losses carry forward. On sale, claimed depreciation is recaptured at up to 25%, and gains may owe capital-gains tax (a 1031 exchange can defer both). Figures are a year-1 estimate at your 24.0% rate — not tax advice; consult a CPA.
Schools (NCES district)
- District
- Broward
- NCES district ID
- 1200180
- Math proficiency
- 42% ▼ -18.00%
- Reading proficiency
- 53% ▼ -5.00%
- Median HH income
- $52,139
- Composite
- 40.88/100
- National rank
- #3621
- State rank
- #46 of 73 in FL
Livability — Oakland Park
- Score
- 77/100
- State rank
- #193
- US rank
- #3082
Category grades
Schools grade is shown separately in the Schools card above.
Census & demographics
- Census place
- Oakland Park, FL
- County
- Broward County · 1,963,430 people
- City population
- 68,410
- Metro
- Miami-Fort Lauderdale-Pompano Beach, FL
- Population (ZIP)
- 30,935
- Household income
- $75,361
- Rent vs Own
- Severe rent burden
- 1755.0
Population outlook (Broward County) Hauer SSP2
- Today (2025)
- 2,207,033 people
- By 2030
- 2,360,704 · +7.0%
- By 2040
- 2,661,208 · +20.6%
- By 2050
- 2,946,698 · +33.5%
- By 2075
- 3,602,273 · +63.2%
- By 2100
- 3,970,984 · +79.9%
Race, ethnicity, and origin ACS 2023
- Neighborhood character
- Diverse neighborhood (Simpson 0.68)
- Race & ethnicity
- White 43% Hispanic / Latino 32% Two or more races 25% Black 17% Asian 2%
- Hispanic origin (detail)
- Mexican 2% Puerto Rican 4% Cuban 4%
- Common ancestry
- Hispanic 5% Lithuanian 3% Romanian 2%
- Foreign-born
- 31% · Canada, Jamaica, Vietnam
- Languages at home
- 59% English-only · Spanish 28% Other Indo-European 5% French/Haitian/Cajun 5%
Political lean MEDSL · Broward
- 2024 margin
- D (+17.0) · D 58.0% · R 41.0%
- 2008→2024 swing
- -17.8pp toward R · 2008: 34.7pp · 2024: 17.0pp
- All cycles
- 2024: D+17.0 2020: D+29.8 2016: D+35.0 2012: D+34.9 2008: D+34.7
Not yet ingested
- Civics
- —
Market trends
- HPI YoY
- ▼ -208.58%
- Current HPI
- 394.9526
- Rent YoY
- ▲ 2.01%
- Metro
- Miami-Fort Lauderdale-Pompano Beach, FL
- State GDP YoY
- ▲ 3.28%
- F500 in state
- 36
Industry mix (Fortune 500 HQ in FL)
| Industry | F500 HQs | Revenue |
|---|---|---|
| Industrial Technology | 2 | $29B |
|
||
| Insurance | 2 | $17B |
|
||
| Retail | 1 | $60B |
|
||
| Technology Distribution | 1 | $58B |
|
||
| Homebuilding | 1 | $35B |
|
||
| Technology Manufacturing | 1 | $35B |
|
||
Price history
+527.1% since first listed7 events — show timeline
- 2026-06-12 Listed $439,000 Beaches MLS
- 2003-06-03 Sold (Public Records) $209,000 Public Records
- 2001-04-04 Sold (Public Records) $122,000 Public Records
- 2000-06-20 Sold (Public Records) $99,500 Public Records
- 1998-10-20 Sold (Public Records) $85,000 Public Records
- 1996-01-23 Sold (Public Records) $65,500 Public Records
- 1992-07-08 Sold (Public Records) $70,000 Public Records
Property tax history
+1.9%/yrLatest (2025): $3,016 · +2.6% YoY. Source: county tax records.
Cash-flow waterfall
monthlySold comps — $/sqft
last 12 mo · ≤1 miLoading sold comps…