200 Flint Hollow Rd · Seymour, MO
Flood risk 1/10 · Minimal
- FEMA flood zone
- X (unshaded)
- Chance of flooding over 30 yrs
- 0.0%
- Est. flood insurance / yr
- $507 – $1,088
Fire risk 4/10 · Minor
- Est. fire insurance / yr
- $1,054 – $1,958
Heat risk 4/10 · Minor
- Hot days now (above 105°F)
- 7 days/yr
- Hot days in 30 yrs
- 19 days/yr
Wind risk 2/10 · Minimal
- Chance of severe wind over 30 yrs
- 0.0%
Air-quality risk 2/10 · Minimal
- Unhealthy air days now
- 1 days/yr
- Unhealthy air days in 30 yrs
- 1 days/yr
Risk factors via First Street. Map © Google.
Why this score? — see what drove the F grade
The composite is a weighted blend of 9 inputs, each scored 0–100. Each bar is that input's sub-score; the figure is the points it added to the 100-point composite (weight × sub-score).
- Appreciation +9.8/10.0
- ARV discount +7.5/15.0
- Cash flow +4.5/30.0
- Livability +3.1/5.0
- Schools +3.0/10.0
- Rent growth +2.5/5.0
- Condition / age +2.5/5.0
- 1% rule +0.5/10.0
- DSCR +0.0/10.0
$150,000
🖨 Deal sheet (PDF) 📄 Offer letter ✓ Due diligence
Listing remarks
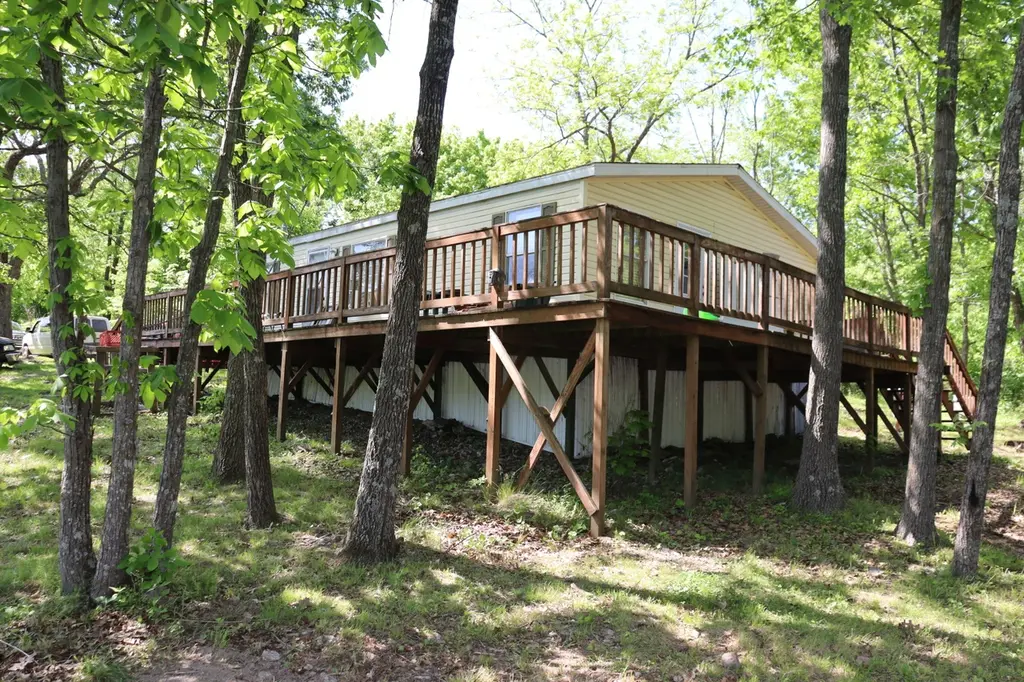
This 10 Acre property offers a great blend of pasture, and mature timber with TONS of wildlife and great bucks and turkey have been harvested off this property in the years pasted. The home offers 3 bedrooms and a full bath and was constructed in 1996 , and with a little TLC you can have it right back to where it was!!! Just north east of seymour with fantastic neighbors make for a great place to homestead and make this place yours!!
Key facts
- 10 acre lot
- Built 1996
- Listed 41 days
Property features AI
Exterior
- Utilities: Private water
- Home design: Manufactured home on land; Residential property
- Construction: Vinyl siding; Composition roof
- Exterior features: Front porch; Wrap-around porch; Rear porch; Rolling/sloped lot; Gravel road frontage; County road access; Barbed wire fencing
Interior
- Bedrooms: Bedrooms located on main level
- Bathrooms: 1 full bathroom
- Heating & cooling: Heat pump; Electric heating; Central heating; Window unit cooling
- Interior features: Window cooling units; Electric heat with heat pump and central system
- Laundry & utility: Laundry on main level
Neighborhood map
What this means for you Summary
Snapshot
- This is a 3-bed/1.0-bath manufactured listed at $150k.
Deal economics
- At list price, monthly cash flow is $-387 ($-5k/yr) — negative.
- To cash-flow at today's rent, offer at most $94k (37.3% below list).
- To meet the 1% rule (rent ≥ 1% of price), the offer needs to be $82k (45.1% below list).
- Recommended offer: $82k (45.1% below list) — sets the bar for 1% rule.
- Cap rate 3.2% vs local median 2.0% in Seymour — top-decile yield for the area; either an underpriced asset or a hidden risk that comps aren't pricing in. Stress-test before assuming the spread holds.
Location & tenants
- Location reads 62/100 on livability (#374 in MO) — a middle-class / working-renter tenant base. Strengths: crime A+, cost of living A+, housing A+; Watch: amenities F, commute F, employment F.
- Seymour R-II (rural): math 28% / reading 43% proficiency, ranked #218 of 324 in MO (top 67%) — families likely to look elsewhere, expect single-tenant / working-renter base with shorter leases.
- Zoned schools: Seymour Elem. (math 22% / reading 47%, grade F, #676 of 1,115 statewide, top 66%, 309 students, 40% FRL); Seymour Middle (math 22% / reading 42%, grade F, #272 of 391 statewide, top 70%, 166 students, 35% FRL); Seymour High (math 57% / reading 34%, grade D-, #174 of 521 statewide, top 33%, 240 students, 38% FRL) — zoned schools average 37% FRL vs 58% district-wide (20 pts lower); this property's tenant base skews higher-income than the district average.
- Market conditions: 59 active listings in the ZIP; 168 units permitted in Webster County in 2024 (24 in 5+ unit buildings).
Forward outlook
- In year one you build about $15k of equity ($1k loan paydown + $14k appreciation (9.5% local appreciation)).
- Webster County population projected at +5% by 2050 — modest demand growth; plan on rents tracking national, not racing it.
- By year 3, paydown + projected appreciation supports a ~$39k cash-out refi (75% LTV) — recoverable capital for the next deal without selling this one.
Negotiation context
- It's been on market 41 days — a 3% lower offer ($146k) is reasonable based on typical stale-listing flexibility.
Questions for the listing agent
- What do current leases actually rent for vs. the listed asking? Can we see a recent rent roll and the last 12 months of T-12 income?
- It's been on market 41 days. Have you received any prior offers? Is the seller open to a 45% concession, seller financing, or rate buy-down credit?
- Is there a deadline driving the sale (1031 exchange, divorce, estate, relocation)? That informs how much negotiation room exists.
- Schools are D-rated, which usually means shorter tenancies and higher turnover. Who's the typical renter profile here, and what's been the actual vacancy rate?
- The area grade is low — what's the realistic commute time and amenity access for the typical tenant pool here? Any planned neighborhood developments (good or bad) we should know about?
- What's the average days-on-market for RENTAL listings here right now (not sales)? A rising rental-DOM trend means longer vacancies and softer asking-rent achievability than the comps imply.
- What's the recent tenant-quality profile in this submarket — average credit score on applications, eviction rate, late-payment / NSF rate, and stable-employment percentage? A property-management company in the area should have these aggregated.
- How much new for-sale + rental construction is in the pipeline within 1–3 miles? Heavy new supply typically softens prices + rents 12–24 months out; constrained supply supports both.
Investment metrics
- 1% rule
- 0.55% ✗
- Cap rate
- 3.20%
- Cash-on-cash
- -11.05%
- DSCR
- 0.51
- GRM
- 15.2
CMA / ARV
No comps found within radius.
Projected returns pro-forma
9.54% appreciation · 3.0% rent growth · sell at horizon
- IRR
- 15.5%
- Equity multiple
- 2.25×
- Total profit
- $52,342
- Equity at exit
- $130,089
- IRR
- 15.0%
- Equity multiple
- 5.10×
- Total profit
- $172,379
- Equity at exit
- $275,344
Cash invested: $42,000 (down + closing). Projections, not guarantees.
Landlord ↔ Tenant lean methodology
- Overall (STATE)
- 81 Strongly Landlord-Friendly
- State Missouri
- 81 Strongly Landlord-Friendly · R+10
- County
- — inherits STATE
- City
- — inherits STATE
ZIP-level market 65746
- Home prices YoY
- 3.6%
- Active inventory
- 59
- Price-to-rent
- 15.2×
Monthly cashflow live
- Estimated rent
- $823 medium interval (Pro) →
- Mortgage (P&I)
- −$787
- Tax est. 1.5%
- −$188 /mo · $2,250/yr
- Insurance
- −$62
- HOA
- −$0
- Vacancy / Maint / Mgmt
- −$173
- Net cashflow
- $-387
Break-even live
Sensitivity live
| Price | -10% $-283 | -5% $-335 | +0% $-387 | +5% $-438 | +10% $-490 |
|---|---|---|---|---|---|
| Rent | -10% $-452 | -5% $-419 | +0% $-387 | +5% $-354 | +10% $-322 |
| Rate | -1.0pp $-311 | -0.5pp $-348 | base $-387 | +0.5pp $-425 | +1.0pp $-465 |
UW: 25.0% down · 7.5% · 30yr · 1.5% tax · 5.0% vac · 8.0% maint · 8.0% mgmt
Financing live
Cash to close
- Down payment
- $37,500
- Closing costs
- $4,500
- Reserves months
- —
- Total cash needed
- —
Loan-product check · same deal, 3 products live
Conventional
25% down · 7.5% · 30yr
- Down + closing
- —
- Monthly P&I
- —
- Monthly cashflow
- —
- DSCR
- —
- Eligible?
- —
Personal DTI + credit; lowest rate.
DSCR
20% down · 8.5% · 30yr
- Down + closing
- —
- Monthly P&I
- —
- Monthly cashflow
- —
- DSCR
- —
- Eligible?
- —
No personal income docs; deal must DSCR.
Hard money
10% down · 12.0% · 12mo
- Down + closing
- —
- Monthly P&I
- —
- Monthly cashflow
- —
- DSCR
- —
- Eligible?
- —
Short-term bridge; refi at stabilization.
Listing history 17 events
-
2026-06-21days on market $150,000 Active 41 DOM
-
2026-06-21days on market $150,000 Active 40 DOM
-
2026-06-18days on market $150,000 Active 38 DOM
-
2026-06-17days on market $150,000 Active 37 DOM
-
2026-06-16days on market $150,000 Active 36 DOM
-
2026-06-15days on market $150,000 Active 35 DOM
-
2026-06-13days on market $150,000 Active 33 DOM
-
2026-06-12days on market $150,000 Active 32 DOM
-
2026-06-09days on market $150,000 Active 29 DOM
-
2026-06-08days on market $150,000 Active 28 DOM
-
2026-06-07days on market $150,000 Active 27 DOM
-
2026-06-07days on market $150,000 Active 26 DOM
-
2026-06-04days on market $150,000 Active 23 DOM
-
2026-06-02days on market $150,000 Active 22 DOM
-
2026-06-01days on market $150,000 Active 21 DOM
-
2026-05-31days on market $150,000 Active 20 DOM
-
2026-05-11$150,000 Active 437-char remark
ⓘ Source: listings_history table (triggers on properties + properties_extension) + one-shot
backfill from property_details.listing_events for pre-trigger history.
Climate risk First Street
- Flood 1/10 Low FEMA zone X (unshaded) · 0% chance over 30 yrs
- Wildfire 4/10 Moderate
- Heat 4/10 Moderate 7 d/yr ≥105°F today · 19 d/yr by 30 yrs out
- Wind 2/10 Low 0% chance of damaging wind over 30 yrs
- Air quality 2/10 Low 1 unhealthy d/yr today · 1 by 30 yrs out
Nearby sold comps map
Loading sold comps map…
Walkable amenities ~0.75 mi
Loading nearby amenities…
Taxation est. · year 1
- Rental income
- $9,873
- − Mortgage interest
- −$8,402
- − Property taxes
- −$2,250
- − Insurance
- −$750
- − Repairs & maintenance
- −$790
- − Management
- −$790
- − Depreciation
- −$4,364
- Taxable loss
- −$7,472
- Est. tax savings @ 24.0%
- +$1,793
- After-tax cash flow
- $-2,846/yr
For passive investors: Depreciation is non-cash, so a rental often shows a tax loss while cash-flowing — sheltering income. Rental losses are passive: they offset passive income freely, and up to $25,000/yr can offset ordinary (W-2) income if you actively participate and your MAGI is under $100k (phasing out to $0 by $150k); unused losses carry forward. On sale, claimed depreciation is recaptured at up to 25%, and gains may owe capital-gains tax (a 1031 exchange can defer both). Figures are a year-1 estimate at your 24.0% rate — not tax advice; consult a CPA.
Schools (NCES district)
- District
- Seymour R-II
- NCES district ID
- 2927930
- Math proficiency
- 28% ▲ 3.00%
- Reading proficiency
- 43% ▼ -1.00%
- Median HH income
- $38,134
- Composite
- 29.57/100
- National rank
- #6485
- State rank
- #218 of 324 in MO
Livability — Seymour
- Score
- 62/100
- State rank
- #374
- US rank
- #16499
Category grades
Schools grade is shown separately in the Schools card above.
Census & demographics
- Population (ZIP)
- 8,302
Population outlook (Webster County) Hauer SSP2
- Today (2025)
- 39,400 people
- By 2030
- 40,125 · +1.8%
- By 2040
- 41,169 · +4.5%
- By 2050
- 41,286 · +4.8%
- By 2075
- 40,104 · +1.8%
- By 2100
- 33,683 · -14.5%
Race, ethnicity, and origin ACS 2023
- Neighborhood character
- Predominantly White (92%)
- Race & ethnicity
- White 92% Hispanic / Latino 3% Two or more races 2%
- Common ancestry
- Slovak 2% Portuguese 2% Iranian 2%
- Foreign-born
- 1% · Canada
- Languages at home
- 76% English-only · German/W. Germanic 23% Other Asian/Pacific 1% Spanish 1%
Political lean MEDSL · Webster
- 2024 margin
- Solid R (+62.2) · D 18.4% · R 80.7%
- 2008→2024 swing
- -33.2pp toward R · 2008: -29.0pp · 2024: -62.2pp
- All cycles
- 2024: R+62.2 2020: R+60.2 2016: R+57.9 2012: R+40.8 2008: R+29.0
Not yet ingested
- Civics
- —
Market trends
- HPI YoY
- ▲ 9.54%
- Current HPI
- 272.7643
- Rent YoY
- —
- Metro
- —
- State GDP YoY
- ▲ 1.84%
- F500 in state
- 20
Industry mix (Fortune 500 HQ in MO)
| Industry | F500 HQs | Revenue |
|---|---|---|
| Healthcare | 1 | $163B |
|
||
| Insurance | 1 | $21B |
|
||
| Industrial Technology | 1 | $17B |
|
||
| Retail | 1 | $16B |
|
||
| Industrial Distribution | 1 | $10B |
|
||
| Utilities | 1 | $9B |
|
||
Price history
1 event — show timeline
- 2026-05-11 Listed $150,000 SOMO
Property tax history
+0.9%/yrLatest (2025): $180 · -1.4% YoY. Source: county tax records.
Cash-flow waterfall
monthlySold comps — $/sqft
last 12 mo · ≤1 miLoading sold comps…