 🏷️ Likely Rental
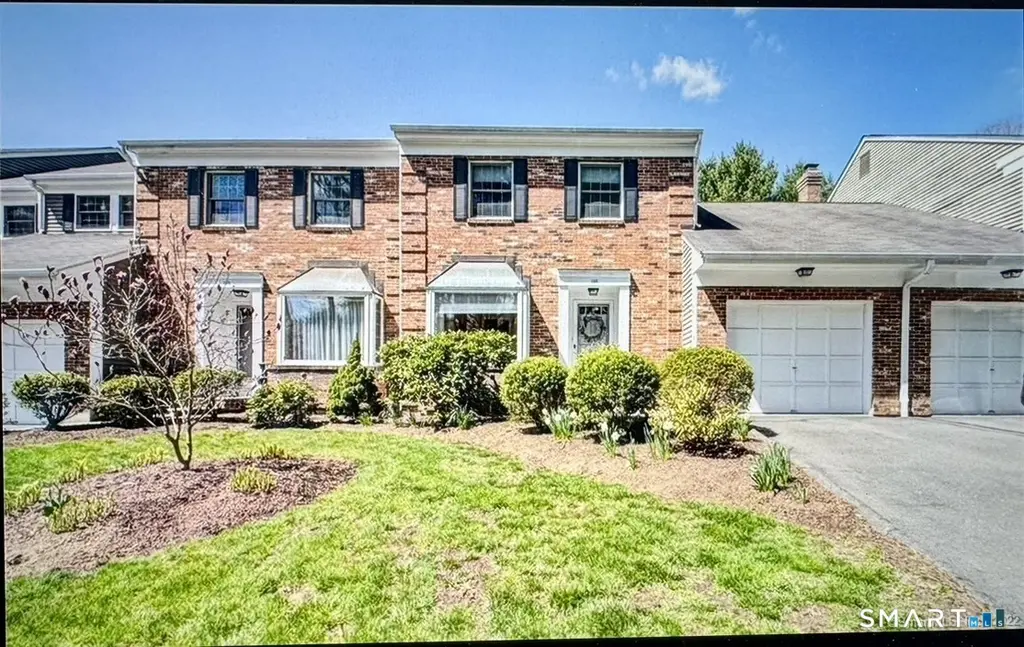
136 Tunxis Vlg · Farmington, CT
Flood risk 8/10 · Major
- FEMA flood zone
- X (shaded)
- Chance of flooding over 30 yrs
- 0.97%
- Est. flood insurance / yr
- $507 – $1,088
Fire risk 1/10 · Minimal
- Est. fire insurance / yr
- $829 – $1,539
Heat risk 5/10 · Moderate
- Hot days now (above 97°F)
- 7 days/yr
- Hot days in 30 yrs
- 17 days/yr
Wind risk 6/10 · Moderate
- Chance of severe wind over 30 yrs
- 27.0%
Air-quality risk 3/10 · Minor
- Unhealthy air days now
- 2 days/yr
- Unhealthy air days in 30 yrs
- 3 days/yr
Risk factors via First Street. Map © Google.
Why this score? — see what drove the D+ grade
The composite is a weighted blend of 9 inputs, each scored 0–100. Each bar is that input's sub-score; the figure is the points it added to the 100-point composite (weight × sub-score).
- Cash flow +15.0/30.0
- ARV discount +7.5/15.0
- Schools +6.4/10.0
- 1% rule +5.0/10.0
- DSCR +5.0/10.0
- Rent growth +2.7/5.0
- Livability +2.5/5.0
- Condition / age +2.5/5.0
- Appreciation +0.0/10.0
$3,000
🖨 Deal sheet (PDF) 📄 Offer letter ✓ Due diligence
Listing remarks
Relocate to this rarely available townhouse for rent in Tunxis Village. This townhouse boast an open floor plan, a kitchen equipped with granite counters, tile flooring, stainless appliances and backsplash. It also features spacious family room and living room with stunning fireplace, a formal dining room, two bedrooms, both bedrooms with full bathroom en suite. The first floor includes a powder room/half bath, gleaming hardwood floor at to private first floor, soft carpet at upper level, slider lead to private deck ideal for entertaining. The master suite offers a large walk-in closet, stand up shower with bathtub. The second floor includes laundry facilities and guest bedroom with second
Key facts
- Open floor plan
- Stainless appliances
- Tile flooring
Tags
Property features AI
Finance
- Other: Professionally managed on-site; Pets not allowed
- HOA & community: Homeowners association with monthly fee; HOA covers clubhouse, tennis, security service, grounds maintenance, trash pickup, snow removal, property management, road maintenance; Association amenities include basketball court, clubhouse, golf course, pool, and security services
Exterior
- Parking: Attached garage (1); Driveway; On-street parking; Total of 4 parking spaces
- Security: Community security services
- Utilities: Public water connected; Public sewer connected
- Home design: Condominium (Condo/Co-Op for sale); Unit occupies 1st floor number in a 3-level unit
- Construction: Brick construction
- Exterior features: Brick siding; Golf course view; Located on a cul-de-sac; In-ground concrete swimming pool with safety fence
Interior
- Kitchen: Gas cooktop; Gas range; Microwave; Range hood; Refrigerator; Dishwasher
- Bedrooms: 2 bedrooms (unit on 3 levels)
- Bathrooms: 2 full bathrooms; 1 half bathroom
- Heating & cooling: Central air; Baseboard heating; Zoned heating; Natural gas heat; 40-gallon natural gas hot water tank
- Interior features: Open floor plan; Cable available; Thermostat(s); One fireplace; Partially finished full basement
- Laundry & utility: Washer and dryer included; Laundry located on upper level next to bedrooms hallway
Neighborhood map
What this means for you Summary
Snapshot
- This is a 2-bed/2.5-bath condo listed at $3k.
Deal economics
- At list price, monthly cash flow is $2k ($18k/yr) — positive.
- The deal already cash-flows at list — no discount required.
- Meets the 1% rule at list price ($3k rent vs $3k).
Location & tenants
- Location reads: area grade D — affects rentability + tenant quality, not the cash-flow math above.
- Farmington School District (suburban): math 65% / reading 77% proficiency, ranked #18 of 153 in CT (top 12%) — strong family-tenant draw, lease renewals of 3-5y typical; only 8% free/reduced lunch — higher-income household profile.
- Zoned schools: East Farms School (math 77% / reading 77%, grade A, #28 of 553 statewide, top 7%, 468 students, 11% FRL); Farmington High School (math 55% / reading 78%, grade B, #32 of 194 statewide, top 16%, 1,263 students, 16% FRL).
- Market conditions: Rents flat; 65 active listings in the ZIP; 3 comparable units currently listed for rent nearby; rentals leasing fast (median 4d on market — plan ~1-2 weeks tenant-placement turnaround); high-income renter base; 1,867 units permitted in Capitol Planning Region in 2024 (1,399 in 5+ unit buildings).
Forward outlook
- Local home prices are declining (-3.0%/yr); year-one equity from $21 of loan paydown is wiped out by about $90 of value loss. Plan a longer hold.
- At projected returns (-3.0% appreciation + 0.7% rent growth), your $840 cash investment doubles in ~1 year — after that, you're playing with house money.
Negotiation context
- Only 1 days on market — expect competitive offers; lowballing is unlikely to land.
Risks & watch-outs
- Watch-outs: flood insurance adds $66/mo; HOA is 22% of rent.
- Climate carrying-cost: severe flood risk; major wind risk, 27% chance of damaging wind over 30y; extreme-heat days projected 7→17/yr by 2055 (HVAC capex compounding) — expect insurance premiums to compound above CPI over the hold.
Questions for the listing agent
- What's the actual annual flood-insurance premium (NFIP or private), and is the property in a SFHA with mandatory coverage?
- What does the HOA fee cover, when was the last increase, and are there any pending special assessments or reserve-fund shortfalls?
- Any open or pending special assessments — roof, HVAC, plumbing, elevator, façade? What's the per-unit balance and payoff schedule, and is the seller paying it off at close or rolling it to the buyer?
- Is there a deadline driving the sale (1031 exchange, divorce, estate, relocation)? That informs how much negotiation room exists.
- The area grade is low — what's the realistic commute time and amenity access for the typical tenant pool here? Any planned neighborhood developments (good or bad) we should know about?
- What's the average days-on-market for RENTAL listings here right now (not sales)? A rising rental-DOM trend means longer vacancies and softer asking-rent achievability than the comps imply.
- What's the recent tenant-quality profile in this submarket — average credit score on applications, eviction rate, late-payment / NSF rate, and stable-employment percentage? A property-management company in the area should have these aggregated.
- How much new apartment / multifamily construction is in the pipeline within 1–3 miles? Heavy new supply (>2% of stock underway) typically softens rents 12–24 months out; light construction supports rent growth.
Investment metrics
- 1% rule
- 93.04% ✓
- Cap rate
- 637.99%
- Cash-on-cash
- 2256.07%
- DSCR
- 101.38
- GRM
- 0.1
CMA / ARV
No comps found within radius.
Projected returns pro-forma
-3.0% appreciation · 0.72% rent growth · sell at horizon
- IRR
- —
- Equity multiple
- 108.21×
- Total profit
- $90,059
- Equity at exit
- $447
- IRR
- —
- Equity multiple
- 215.04×
- Total profit
- $179,793
- Equity at exit
- $259
Cash invested: $840 (down + closing). Projections, not guarantees.
Landlord ↔ Tenant lean methodology
- Overall (STATE)
- 27 Tenant-Leaning
- State Connecticut
- 27 Tenant-Leaning · D+7
- County
- — inherits STATE
- City
- — inherits STATE
ZIP-level market 06032
- Rents YoY
- 0.7%
- Active inventory
- 65
- Price-to-rent
- 0.1×
Monthly cashflow live
- Estimated rent
- $2,791 medium interval (Pro) →
- Mortgage (P&I)
- −$16
- Tax est. 1.5%
- −$4 /mo · $45/yr
- Insurance
- −$1
- Flood insurance flood zone
- −$66 /mo · $798/yr
- HOA
- −$605
- Vacancy / Maint / Mgmt
- −$586
- Net cashflow
- $1,513
Break-even live
Sensitivity live
| Price | -10% $1,515 | -5% $1,514 | +0% $1,513 | +5% $1,512 | +10% $1,511 |
|---|---|---|---|---|---|
| Rent | -10% $1,292 | -5% $1,403 | +0% $1,513 | +5% $1,623 | +10% $1,733 |
| Rate | -1.0pp $1,514 | -0.5pp $1,514 | base $1,513 | +0.5pp $1,512 | +1.0pp $1,511 |
UW: 25.0% down · 7.5% · 30yr · 1.5% tax · 5.0% vac · 8.0% maint · 8.0% mgmt
Financing live
Cash to close
- Down payment
- $750
- Closing costs
- $90
- Reserves months
- —
- Total cash needed
- —
Loan-product check · same deal, 3 products live
Conventional
25% down · 7.5% · 30yr
- Down + closing
- —
- Monthly P&I
- —
- Monthly cashflow
- —
- DSCR
- —
- Eligible?
- —
Personal DTI + credit; lowest rate.
DSCR
20% down · 8.5% · 30yr
- Down + closing
- —
- Monthly P&I
- —
- Monthly cashflow
- —
- DSCR
- —
- Eligible?
- —
No personal income docs; deal must DSCR.
Hard money
10% down · 12.0% · 12mo
- Down + closing
- —
- Monthly P&I
- —
- Monthly cashflow
- —
- DSCR
- —
- Eligible?
- —
Short-term bridge; refi at stabilization.
Rent comps 3 comps
| Address | Beds | Baths | Sqft | Rent | $/sqft | DOM | Units | Dist |
|---|---|---|---|---|---|---|---|---|
| 136 Tunxis Vlg #136 Farmington, CT | 2.0 | 2.5 | 2030 | $3,000 | $1.48 | 2d | 1 | 0.03mi |
| 15 Garden St Unit C Farmington, CT | 1.0 | 3.5 | 2568 | $1,950 | $0.76 | 4d | 1 | 1.25mi |
| 44 Garden St #7 Farmington, CT | 2.0 | 1.5 | 1260 | $2,500 | $1.98 | 44d | 1 | 1.29mi |
HOA detail condo
- Monthly dues
- $605 · $7,260/yr
- Assessments
- None detected in remarks — confirm with the listing agent.
Listing history 2 events
-
2026-06-01remarks 699-char remark
-
2026-06-01$3,000 Active 1 DOM
ⓘ Source: listings_history table (triggers on properties + properties_extension) + one-shot
backfill from property_details.listing_events for pre-trigger history.
Climate risk First Street
- Flood 8/10 Severe FEMA zone X (shaded) · 97% chance over 30 yrs
- Wildfire 1/10 Low
- Heat 5/10 Major 7 d/yr ≥97°F today · 17 d/yr by 30 yrs out
- Wind 6/10 Major 27% chance of damaging wind over 30 yrs
- Air quality 3/10 Moderate 2 unhealthy d/yr today · 3 by 30 yrs out
Nearby sold comps map
Loading sold comps map…
Walkable amenities ~0.75 mi
Loading nearby amenities…
Taxation est. · year 1
- Rental income
- $33,493
- − Mortgage interest
- −$168
- − Property taxes
- −$45
- − Insurance
- −$812
- − Repairs & maintenance
- −$2,679
- − Management
- −$2,679
- − HOA
- −$7,260
- − Depreciation
- −$87
- Taxable income
- $19,762
- Est. tax owed @ 24.0%
- −$4,743
- After-tax cash flow
- $13,411/yr
For passive investors: Depreciation is non-cash, so a rental often shows a tax loss while cash-flowing — sheltering income. Rental losses are passive: they offset passive income freely, and up to $25,000/yr can offset ordinary (W-2) income if you actively participate and your MAGI is under $100k (phasing out to $0 by $150k); unused losses carry forward. On sale, claimed depreciation is recaptured at up to 25%, and gains may owe capital-gains tax (a 1031 exchange can defer both). Figures are a year-1 estimate at your 24.0% rate — not tax advice; consult a CPA.
Schools (NCES district)
- District
- Farmington School District
- NCES district ID
- 0901560
- Math proficiency
- 65% ▼ -8.00%
- Reading proficiency
- 77% ▼ -5.00%
- Median HH income
- $87,791
- Composite
- 63.76/100
- National rank
- #598
- State rank
- #18 of 153 in CT
Livability — Farmington
No livability data for this city. (Only ~50 U.S. cities are tracked.)
Census & demographics
- County
- Hartford County · 754,208 people
- City population
- 19,135
- Metro
- Hartford-East Hartford-Middletown, CT
- Population (ZIP)
- 19,135
- Household income
- $140,912
- Rent vs Own
- Severe rent burden
- 533.0
Population outlook (Capitol County) Hauer SSP2
- By 2040
- 1,063,519
Race, ethnicity, and origin ACS 2023
- Neighborhood character
- Predominantly White (70%)
- Race & ethnicity
- White 70% Asian 16% Hispanic / Latino 7% Two or more races 5% Black 3%
- Hispanic origin (detail)
- Mexican 1% Puerto Rican 3%
- Common ancestry
- Romanian 10% Lithuanian 4% Slovak 3%
- Foreign-born
- 21% · Canada, China, South Korea
- Languages at home
- 77% English-only · Other Indo-European 4% Chinese 4% Spanish 4%
Political lean MEDSL · Capitol
- 2024 margin
- Strong D (+21.9) · D 60.1% · R 38.2% · Other 1.7%
- All cycles
- 2024: D+21.9
Not yet ingested
- Civics
- —
Market trends
- HPI YoY
- ▼ -145.88%
- Current HPI
- 178.158
- Rent YoY
- ▲ 0.72%
- Metro
- Hartford-East Hartford-Middletown, CT
- State GDP YoY
- ▲ 1.06%
- F500 in state
- 38
Industry mix (Fortune 500 HQ in CT)
| Industry | F500 HQs | Revenue |
|---|---|---|
| Industrial Machinery | 4 | $38B |
|
||
| Insurance | 3 | $71B |
|
||
| Financial Services | 2 | $25B |
|
||
| Transportation / Logistics | 2 | $18B |
|
||
| Healthcare | 1 | $247B |
|
||
| Telecommunications | 1 | $55B |
|
||
Price history
1 event — show timeline
- 2026-05-31 Listed $3,000 Smart MLS
Property tax history
+2.4%/yrLatest (2025): $5,436 · +4.6% YoY. Source: county tax records.
Cash-flow waterfall
monthlySold comps — $/sqft
last 12 mo · ≤1 miLoading sold comps…