1213 Colt Dr · Guthrie, OK
Flood risk No data
- FEMA flood zone
- —
- Chance of flooding over 30 yrs
- —
- Est. flood insurance / yr
- —
Fire risk No data
- Est. fire insurance / yr
- —
Heat risk No data
- Hot days now (above threshold)
- —
- Hot days in 30 yrs
- —
Wind risk No data
- Chance of severe wind over 30 yrs
- —
Air-quality risk No data
- Unhealthy air days now
- —
- Unhealthy air days in 30 yrs
- —
Risk factors via First Street. Map © Google.
Why this score? — see what drove the D+ grade
The composite is a weighted blend of 9 inputs, each scored 0–100. Each bar is that input's sub-score; the figure is the points it added to the 100-point composite (weight × sub-score).
- ARV discount +15.0/15.0
- Cash flow +11.4/30.0
- Rent growth +5.0/5.0
- Livability +3.7/5.0
- 1% rule +3.5/10.0
- DSCR +3.3/10.0
- Condition / age +2.5/5.0
- Schools +2.1/10.0
- Appreciation +0.0/10.0
$249,391
🖨 Deal sheet 📄 Offer letter ✓ Due diligence
Listing remarks
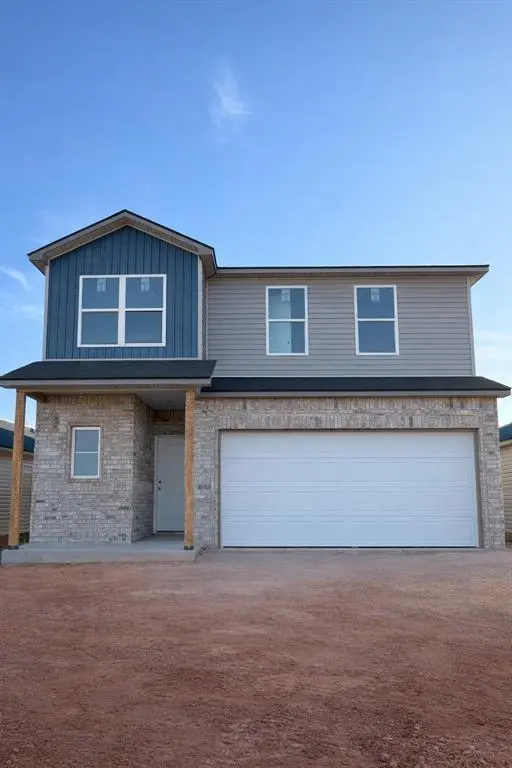
The CHELSEY floor plan is rich with curb appeal with its cozy covered porch and front yard landscaping. This two-story home features 4 bedrooms, 2.5 bathrooms, a loft, and a large family room. The kitchen is fully equipped with generous counterspace, pantry, and island. All bedrooms are located upstairs, including the master suite, which includes a walk-in closet.
Key facts
- Covered porch
- Walk-in closet
- 4,905 sq ft lot
Tags
Property features AI
Finance
- Other: Located in Guthrie Farms addition
- Financial info: Loan qualification available; Not assumable
- HOA & community: Mandatory association dues; Association fee $330 (includes common area maintenance)
Exterior
- Parking: 2-car garage
- Utilities: Homestead eligible
- Home design: Single-family residence; Two-story; New construction; Residential property
- Construction: Brick and frame construction; Shingle roof; Built by Lennar; Post Tension foundation
- Exterior features: Patio - Open; Interior lot
Interior
- Bedrooms: 4 bedrooms
- Bathrooms: 2 full bathrooms
- Heating & cooling: Post-tension foundation (structural detail)
- Interior features: Open patio access
Neighborhood map
What this means for you Summary
Snapshot
- This is a 4-bed/2.0-bath single-family listed at $249k.
Deal economics
- At list price, monthly cash flow is $-86 ($-1k/yr) — negative.
- To cash-flow at today's rent, offer at most $237k (5.0% below list).
- To meet the 1% rule (rent ≥ 1% of price), the offer needs to be $211k (15.4% below list).
- Recommended offer: $211k (15.4% below list) — sets the bar for 1% rule.
- Cap rate 5.9% vs local median 3.0% in Guthrie — top-decile yield for the area; either an underpriced asset or a hidden risk that comps aren't pricing in. Stress-test before assuming the spread holds.
Location & tenants
- Location reads 74/100 on livability (#15 in OK, #4,696 nationally) — a middle-class / working-renter tenant base. Strengths: cost of living A+, housing A+, health & safety A+; Watch: amenities F, commute F.
- Guthrie (town): math 24% / reading 24% proficiency, ranked #119 of 270 in OK (top 44%) — low school quality limits family demand, transient renter base, plan for 1-2y turnover.
- Zoned schools: Central Es (math 12% / reading 8%, grade F, #711 of 845 statewide, top 87%, 278 students, 0% FRL); Guthrie Hs (math 22% / reading 32%, grade F, #125 of 447 statewide, top 31%, 1,025 students, 0% FRL) — zoned schools average 0% FRL vs 55% district-wide (55 pts lower); this property's tenant base skews higher-income than the district average.
- Market conditions: Rents rising fast (+12.2%/yr); 843 active listings in the ZIP; 2 comparable units currently listed for rent nearby; 102 units permitted in Logan County in 2024 (0 in 5+ unit buildings).
- This rent runs 35% of the median local income ($72k/yr) — at the standard rent-burdened threshold; future hikes will face affordability resistance.
Forward outlook
- Local home prices are declining (-3.0%/yr); year-one equity from $2k of loan paydown is wiped out by about $7k of value loss. Plan a longer hold.
- Logan County population projected at +36% by 2050 — long-run rental-demand tailwind backs the buy-and-hold thesis.
Negotiation context
- It's been on market 28 days — a 2% lower offer ($246k) is reasonable based on typical stale-listing flexibility.
- 2 sale attempts with the ask held roughly flat each time — persistent listings suggest the price (not the market) is what's stuck; bring a comps-based counter.
Questions for the listing agent
- What do current leases actually rent for vs. the listed asking? Can we see a recent rent roll and the last 12 months of T-12 income?
- What does the HOA fee cover, when was the last increase, and are there any pending special assessments or reserve-fund shortfalls?
- Is there a deadline driving the sale (1031 exchange, divorce, estate, relocation)? That informs how much negotiation room exists.
- Schools are F-rated, which usually means shorter tenancies and higher turnover. Who's the typical renter profile here, and what's been the actual vacancy rate?
- The area grade is low — what's the realistic commute time and amenity access for the typical tenant pool here? Any planned neighborhood developments (good or bad) we should know about?
- What's the average days-on-market for RENTAL listings here right now (not sales)? A rising rental-DOM trend means longer vacancies and softer asking-rent achievability than the comps imply.
- What's the recent tenant-quality profile in this submarket — average credit score on applications, eviction rate, late-payment / NSF rate, and stable-employment percentage? A property-management company in the area should have these aggregated.
- How much new for-sale + rental construction is in the pipeline within 1–3 miles? Heavy new supply typically softens prices + rents 12–24 months out; constrained supply supports both.
Investment metrics
- 1% rule
- 0.85% ✗
- Cap rate
- 5.88%
- Cash-on-cash
- -1.47%
- DSCR
- 0.93
- GRM
- 9.9
CMA / ARV
- ARV (on-the-fly)
- $386,155
- Comps found
- 12
Show comp detail 12 sales within ~0.75 mi
| Address | Dist | Beds/Ba | Sqft | Sold | Price | $/sf | Match |
|---|---|---|---|---|---|---|---|
| 1213 Colt Dr | 0.00mi | 4/2.0 | 2,065 (0%) | 1mo | $249,391 | $121 | 100 |
| 1223 Colt Dr | 0.00mi | 4/2.5 | 2,065 (0%) | 8mo | $265,750 | $129 | 92 |
| 1205 Colt Dr | 0.00mi | 4/2.0 | 2,239 (+8%) | 4mo | $275,250 | $123 | 83 |
| 1412 Guthrie Farms Blvd | 0.14mi | 4/2.5 | 2,065 (0%) | 11mo | $263,587 | $128 | 82 |
| 1827 S Blackberry Bnd | 0.43mi | 4/2.5 | 2,075 (+0%) | 3mo | $392,900 | $189 | 75 |
| 1926 Cattle Dr | 0.52mi | 4/2.5 | 2,075 (+0%) | 2mo | $397,900 | $192 | 71 |
| 1852 Cattle Dr | 0.47mi | 4/2.5 | 2,100 (+2%) | 3mo | $396,900 | $189 | 71 |
| 1913 Kyle Dr | 0.61mi | 4/2.0 | 2,139 (+4%) | 4mo | $325,000 | $152 | 62 |
| 1927 S Blackberry Bnd | 0.50mi | 4/2.5 | 2,217 (+7%) | 3mo | $415,000 | $187 | 60 |
| 1916 E Industrial Rd | 0.73mi | 4/2.5 | 2,125 (+3%) | 6mo | $430,000 | $202 | 55 |
| 1923 E Perkins Ave | 0.70mi | 3/2.0 (-1) | 2,318 (+12%) | 3mo | $500,000 | $216 | 40 |
| 1001 E Vilas Ave | 0.73mi | 4/3.0 | 2,252 (+9%) | 13mo | $245,000 | $109 | 36 |
Match score weights: distance 35% · size 25% · config 20% · recency 20%. Top-matched comps best support the ARV.
Projected returns pro-forma
-3.0% appreciation · 8.0% rent growth · sell at horizon
- IRR
- -13.2%
- Equity multiple
- 0.50×
- Total profit
- $-34,668
- Equity at exit
- $37,185
- IRR
- 2.2%
- Equity multiple
- 1.20×
- Total profit
- $13,716
- Equity at exit
- $21,563
Cash invested: $69,829 (down + closing). Projections, not guarantees.
Landlord ↔ Tenant lean methodology
- Overall (STATE)
- 83 Strongly Landlord-Friendly
- State Oklahoma
- 83 Strongly Landlord-Friendly · R+20
- County
- — inherits STATE
- City
- — inherits STATE
ZIP-level market 73044
- Home prices YoY
- -25.9%
- Rents YoY
- 12.2%
- Active inventory
- 843
- Price-to-rent
- 9.9×
Monthly cashflow live
- Estimated rent
- $2,109 medium interval (Pro) →
- Mortgage (P&I)
- −$1,308
- Tax est. 1.5%
- −$312 /mo · $3,741/yr
- Insurance
- −$104
- HOA
- −$28
- Vacancy / Maint / Mgmt
- −$443
- Net cashflow
- $-86
Break-even live
UW: 25.0% down · 7.5% · 30yr · 1.5% tax · 5.0% vac · 8.0% maint · 8.0% mgmt
Financing live
Cash to close
- Down payment
- $62,348
- Closing costs
- $7,482
- Reserves months
- —
- Total cash needed
- —
Loan-product check · same deal, 3 products live
Conventional
25% down · 7.5% · 30yr
- Down + closing
- —
- Monthly P&I
- —
- Monthly cashflow
- —
- DSCR
- —
- Eligible?
- —
Personal DTI + credit; lowest rate.
DSCR
20% down · 8.5% · 30yr
- Down + closing
- —
- Monthly P&I
- —
- Monthly cashflow
- —
- DSCR
- —
- Eligible?
- —
No personal income docs; deal must DSCR.
Hard money
10% down · 12.0% · 12mo
- Down + closing
- —
- Monthly P&I
- —
- Monthly cashflow
- —
- DSCR
- —
- Eligible?
- —
Short-term bridge; refi at stabilization.
Rent comps 2 comps
| Address | Beds | Baths | Sqft | Rent | $/sqft | DOM | Units | Dist |
|---|---|---|---|---|---|---|---|---|
| 1201 Stallion Dr Guthrie, OK | 4.0 | 2.0 | 1459 | $2,000 | $1.37 | 12d | 1 | 0.04mi |
| 2715 S Division St Guthrie, OK | 4.0 | 3.0 | 3000 | $2,500 | $0.83 | 2d | 1 | 1.44mi |
HOA detail
- Monthly dues
- $28 · $336/yr
- Likely covers
- landscaping
Listing history 10 events
-
2026-04-29status Pending
-
2026-04-24price $249,391
-
2026-04-22price $254,884
-
2026-04-01$257,250 Active
-
2026-03-31price $257,250
-
2026-03-31historical
-
2026-03-27price $258,450
-
2025-12-08price $259,500
-
2025-09-29price $265,500
-
2025-09-16$271,050 Active
ⓘ Source: listings_history table (triggers on properties + properties_extension) + one-shot
backfill from property_details.listing_events for pre-trigger history.
Nearby sold comps map
Loading sold comps map…
Walkable amenities ~0.75 mi
Loading nearby amenities…
Taxation est. · year 1
- Rental income
- $25,305
- − Mortgage interest
- −$13,970
- − Property taxes
- −$3,741
- − Insurance
- −$1,247
- − Repairs & maintenance
- −$2,024
- − Management
- −$2,024
- − HOA
- −$336
- − Depreciation
- −$7,255
- Taxable loss
- −$5,292
- Est. tax savings @ 24.0%
- +$1,270
- After-tax cash flow
- $243/yr
For passive investors: Depreciation is non-cash, so a rental often shows a tax loss while cash-flowing — sheltering income. Rental losses are passive: they offset passive income freely, and up to $25,000/yr can offset ordinary (W-2) income if you actively participate and your MAGI is under $100k (phasing out to $0 by $150k); unused losses carry forward. On sale, claimed depreciation is recaptured at up to 25%, and gains may owe capital-gains tax (a 1031 exchange can defer both). Figures are a year-1 estimate at your 24.0% rate — not tax advice; consult a CPA.
Schools (NCES district)
- District
- Guthrie
- NCES district ID
- 4013560
- Math proficiency
- 24% ▼ -7.00%
- Reading proficiency
- 24% ▼ -2.00%
- Median HH income
- $45,370
- Composite
- 20.79/100
- National rank
- #8513
- State rank
- #119 of 270 in OK
Livability — Guthrie
- Score
- 74/100
- State rank
- #15
- US rank
- #4696
Category grades
Schools grade is shown separately in the Schools card above.
Census & demographics
- Census place
- Guthrie, OK
- County
- Logan County · 25,398 people
- City population
- 25,398
- Metro
- Oklahoma City, OK
- Population (ZIP)
- 25,398
- Household income
- $72,288
- Rent vs Own
- Severe rent burden
- 397.0
Population outlook (Logan County) Hauer SSP2
- Today (2025)
- 55,683 people
- By 2030
- 60,011 · +7.8%
- By 2040
- 68,071 · +22.2%
- By 2050
- 75,815 · +36.2%
- By 2075
- 94,749 · +70.2%
- By 2100
- 108,057 · +94.1%
Race, ethnicity, and origin ACS 2023
- Neighborhood character
- Predominantly White (77%)
- Race & ethnicity
- White 77% Two or more races 10% Hispanic / Latino 8% Black 6% Native American 3%
- Hispanic origin (detail)
- Mexican 7%
- Common ancestry
- Slovak 3% Lithuanian 3% Italian 2%
- Foreign-born
- 3% · Canada
- Languages at home
- 94% English-only · Spanish 6%
Political lean MEDSL · Logan
- 2024 margin
- Solid R (+49.0) · D 24.4% · R 73.5% · Other 2.1%
- 2008→2024 swing
- -11.6pp toward R · 2008: -37.4pp · 2024: -49.0pp
- All cycles
- 2024: R+49.0 2020: R+47.1 2016: R+49.5 2012: R+44.8 2008: R+37.4
Not yet ingested
- Civics
- —
Market trends
- HPI YoY
- ▼ -86.90%
- Current HPI
- 247.9481
- Rent YoY
- ▲ 12.22%
- Metro
- Oklahoma City, OK
- State GDP YoY
- ▲ 1.55%
- F500 in state
- 6
Industry mix (Fortune 500 HQ in OK)
| Industry | F500 HQs | Revenue |
|---|---|---|
| Energy | 3 | $48B |
|
||
Price history
-8.0% since first listed10 events — show timeline
- 2026-04-29 Pending — MLSOK
- 2026-04-24 Price Changed $249,391 MLSOK
- 2026-04-22 Price Changed $254,884 MLSOK
- 2026-04-01 Listed $257,250 MLSOK
- 2026-03-31 Price Changed $257,250 MLSOK
- 2026-03-31 Listing Removed — MLSOK
- 2026-03-27 Price Changed $258,450 MLSOK
- 2025-12-08 Price Changed $259,500 MLSOK
- 2025-09-29 Price Changed $265,500 MLSOK
- 2025-09-16 Listed $271,050 MLSOK
Cash-flow waterfall
monthlySold comps — $/sqft
last 12 mo · ≤1 miLoading sold comps…