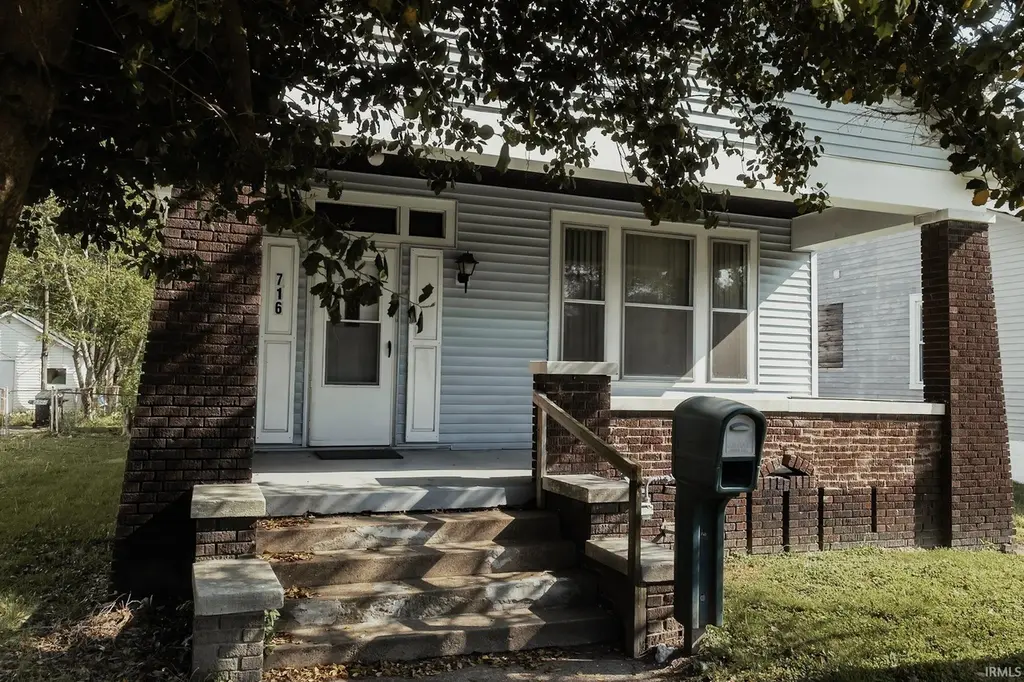
716 Waggoner Ave · Evansville, IN
Flood risk 4/10 · Minor
- FEMA flood zone
- X
- Chance of flooding over 30 yrs
- 0.22%
- Est. flood insurance / yr
- $473 – $860
Fire risk 1/10 · Minimal
- Est. fire insurance / yr
- $717 – $1,331
Heat risk 5/10 · Moderate
- Hot days now (above 107°F)
- 7 days/yr
- Hot days in 30 yrs
- 19 days/yr
Wind risk 2/10 · Minimal
- Chance of severe wind over 30 yrs
- 3.0%
Air-quality risk 4/10 · Minor
- Unhealthy air days now
- 3 days/yr
- Unhealthy air days in 30 yrs
- 5 days/yr
Risk factors via First Street. Map © Google.
Why this score? — see what drove the B- grade
The composite is a weighted blend of 9 inputs, each scored 0–100. Each bar is that input's sub-score; the figure is the points it added to the 100-point composite (weight × sub-score).
- Cash flow +24.0/30.0
- ARV discount +15.0/15.0
- DSCR +7.7/10.0
- 1% rule +6.1/10.0
- Rent growth +5.0/5.0
- Schools +3.3/10.0
- Livability +3.2/5.0
- Condition / age +2.5/5.0
- Appreciation +0.0/10.0
$94,900
🖨 Deal sheet 📄 Offer letter ✓ Due diligence
Listing remarks
This great two bedroom, one bath home offers plenty of space and comfort. Enjoy a large living room and a dedicated dining area, perfect for entertaining. The laundry is conveniently located on the main level, and the home features an unfinished basement for extra storage or potential expansion. Relax on the inviting front porch-ideal for enjoying summer and fall evenings. Off-street parking is available with a private driveway. Don't miss this well-maintained home full of character and convenience. Hardwood floors under the carpet.
Key facts
- Inviting front porch
- Private driveway
- Unfinished basement
Tags
Property features AI
Finance
- Other: 48 x 144 lot dimensions; About 1,152 above-grade finished area
Exterior
- Parking: Gravel driveway
- Utilities: Public water; Public sewer
- Home design: Single-family residence (site-built); One story
- Construction: Vinyl siding
- Exterior features: Level lot; No fencing
Interior
- Kitchen: No kitchen appliance details provided
- Bedrooms: Total of 5 rooms (bedrooms and other rooms included)
- Flooring: Hardwood; Carpet; Vinyl
- Bathrooms: 1 full bathroom
- Heating & cooling: Central air; Ceiling fan(s); Natural gas forced-air heating
- Interior features: Natural woodwork; Partial basement
- Laundry & utility: Laundry on the main level
Neighborhood map
What this means for you Summary
Snapshot
- This is a 2-bed/1.0-bath single-family listed at $95k.
Deal economics
- At list price, monthly cash flow is $186 ($2k/yr) — positive.
- The deal already cash-flows at list — no discount required.
- Meets the 1% rule at list price ($1k rent vs $95k).
- Recommended offer: $89k (6.0% below list) — sets the bar for market timing.
- Cap rate 8.6% vs local median 4.6% in Evansville — top-decile yield for the area; either an underpriced asset or a hidden risk that comps aren't pricing in. Stress-test before assuming the spread holds.
Location & tenants
- Location reads 63/100 on livability (#416 in IN) — a middle-class / working-renter tenant base. Strengths: cost of living A+, housing A+, health & safety A+; Watch: crime F, commute F, employment D-.
- Evansville Vanderburgh School Corporation (urban): math 36% / reading 43% proficiency, ranked #153 of 301 in IN (top 51%) — families likely to look elsewhere, expect single-tenant / working-renter base with shorter leases.
- Zoned schools: Lincoln School (math 12% / reading 17%, grade F, #862 of 994 statewide, top 88%, 236 students, 88% FRL); Thompkins Middle School (math 39% / reading 46%, grade D-, #98 of 330 statewide, top 30%, 618 students, 53% FRL); Central High School (math 38% / reading 74%, grade C, #73 of 369 statewide, top 20%, 1,090 students, 52% FRL).
- Market conditions: Rents rising fast (+9.9%/yr); 118 active listings in the ZIP; 27 comparable units currently listed for rent nearby; rentals at typical pace (median 21d on market — plan ~3-4 weeks tenant-placement turnaround); lower-income renter base — watch delinquency; 508 units permitted in Vanderburgh County in 2024 (32 in 5+ unit buildings).
- This rent runs 31% of the median local income ($41k/yr) — at the standard rent-burdened threshold; future hikes will face affordability resistance.
Forward outlook
- Local home prices are declining (-3.0%/yr); year-one equity from $656 of loan paydown is wiped out by about $3k of value loss. Plan a longer hold.
- At projected returns (-3.0% appreciation + 8.0% rent growth), your $27k cash investment doubles in ~8 years — after that, you're playing with house money.
Negotiation context
- It's been on market 64 days — a 6% lower offer ($89k) is reasonable based on typical stale-listing flexibility.
- 5 sale attempts since 3y ago; this cycle's ask has dropped $5k (5%) from the opening price — seller is motivated, your offer sets the floor, not the list.
Risks & watch-outs
- Watch-outs: built in 1925 — expect roof / HVAC / electrical / plumbing capex.
- Climate carrying-cost: extreme-heat days projected 7→19/yr by 2055 (HVAC capex compounding) — expect insurance premiums to compound above CPI over the hold.
Questions for the listing agent
- It's been on market 64 days. Have you received any prior offers? Is the seller open to a 6% concession, seller financing, or rate buy-down credit?
- Built in 1925 — when were the roof, HVAC, electrical panel, plumbing, and water heater last replaced?
- Why hasn't it sold? Are there any deal-killer items the seller is aware of (foundation, flood, title, zoning, code violations)?
- Is there a deadline driving the sale (1031 exchange, divorce, estate, relocation)? That informs how much negotiation room exists.
- Schools are D-rated, which usually means shorter tenancies and higher turnover. Who's the typical renter profile here, and what's been the actual vacancy rate?
- Crime grade is F in this area — have there been break-ins, vandalism, or insurance claims at this property in the last 3 years? What carrier currently insures it and at what premium?
- What's the average days-on-market for RENTAL listings here right now (not sales)? A rising rental-DOM trend means longer vacancies and softer asking-rent achievability than the comps imply.
- What's the recent tenant-quality profile in this submarket — average credit score on applications, eviction rate, late-payment / NSF rate, and stable-employment percentage? A property-management company in the area should have these aggregated.
- How much new for-sale + rental construction is in the pipeline within 1–3 miles? Heavy new supply typically softens prices + rents 12–24 months out; constrained supply supports both.
Investment metrics
- 1% rule
- 1.11% ✓
- Cap rate
- 8.65%
- Cash-on-cash
- 8.41%
- DSCR
- 1.37
- GRM
- 7.5
CMA / ARV
- ARV (on-the-fly)
- $125,568
- Comps found
- 12
Show comp detail 12 sales within ~0.75 mi
| Address | Dist | Beds/Ba | Sqft | Sold | Price | $/sf | Match |
|---|---|---|---|---|---|---|---|
| 1059 Waggoner Ave | 0.39mi | 2/2.0 | 1,150 (-0%) | 1mo | $125,000 | $109 | 76 |
| 711 Waggoner Ave | 0.03mi | 2/1.0 | 991 (-14%) | 1mo | $45,000 | $45 | 74 |
| 1107 S Evans Ave | 0.47mi | 2/1.0 | 1,096 (-5%) | 0mo | $100,000 | $91 | 70 |
| 613 Madison Ave | 0.40mi | 3/1.0 (+1) | 1,176 (+2%) | 4mo | $165,000 | $140 | 69 |
| 1320 S Governor St | 0.41mi | 2/1.0 | 1,048 (-9%) | 3mo | $32,500 | $31 | 64 |
| 1101 Ravenswood Dr | 0.43mi | 2/1.0 | 1,269 (+10%) | 1mo | $155,000 | $122 | 62 |
| 1921 Shadewood Ave | 0.35mi | 3/1.0 (+1) | 1,037 (-10%) | 3mo | $135,000 | $130 | 59 |
| 329 Taylor Ave | 0.40mi | 2/1.0 | 1,021 (-11%) | 6mo | $46,000 | $45 | 58 |
| 807 Prosperity Ave | 0.64mi | 2/1.5 | 1,232 (+7%) | 0mo | $70,000 | $57 | 56 |
| 1903 S Kerth Ave | 0.50mi | 3/2.0 (+1) | 1,214 (+5%) | 5mo | $150,000 | $124 | 55 |
| 110 Jefferson Ave | 0.70mi | 3/1.0 (+1) | 1,064 (-8%) | 3mo | $166,000 | $156 | 47 |
| 717 E Blackford Ave | 0.61mi | 3/1.0 (+1) | 1,303 (+13%) | 5mo | $29,250 | $22 | 40 |
Match score weights: distance 35% · size 25% · config 20% · recency 20%. Top-matched comps best support the ARV.
Projected returns pro-forma
-3.0% appreciation · 8.0% rent growth · sell at horizon
- IRR
- 1.9%
- Equity multiple
- 1.08×
- Total profit
- $2,039
- Equity at exit
- $14,150
- IRR
- 15.9%
- Equity multiple
- 2.59×
- Total profit
- $42,326
- Equity at exit
- $8,205
Cash invested: $26,572 (down + closing). Projections, not guarantees.
Landlord ↔ Tenant lean methodology
- Overall (STATE)
- 90 Strongly Landlord-Friendly
- State Indiana
- 90 Strongly Landlord-Friendly · R+11
- County
- — inherits STATE
- City
- — inherits STATE
ZIP-level market 47713
- Home prices YoY
- -34.1%
- Rents YoY
- 9.9%
- Active inventory
- 118
- Price-to-rent
- 7.5×
Monthly cashflow live
- Estimated rent
- $1,049 high interval (Pro) →
- Mortgage (P&I)
- −$498
- Tax from tax record
- −$106 /mo · $1,267/yr
- Insurance
- −$40
- HOA
- −$0
- Vacancy / Maint / Mgmt
- −$220
- Net cashflow
- $186
Break-even live
UW: 25.0% down · 7.5% · 30yr · 1.5% tax · 5.0% vac · 8.0% maint · 8.0% mgmt
Financing live
Cash to close
- Down payment
- $23,725
- Closing costs
- $2,847
- Reserves months
- —
- Total cash needed
- —
Loan-product check · same deal, 3 products live
Conventional
25% down · 7.5% · 30yr
- Down + closing
- —
- Monthly P&I
- —
- Monthly cashflow
- —
- DSCR
- —
- Eligible?
- —
Personal DTI + credit; lowest rate.
DSCR
20% down · 8.5% · 30yr
- Down + closing
- —
- Monthly P&I
- —
- Monthly cashflow
- —
- DSCR
- —
- Eligible?
- —
No personal income docs; deal must DSCR.
Hard money
10% down · 12.0% · 12mo
- Down + closing
- —
- Monthly P&I
- —
- Monthly cashflow
- —
- DSCR
- —
- Eligible?
- —
Short-term bridge; refi at stabilization.
Rent comps 27 comps
| Address | Beds | Baths | Sqft | Rent | $/sqft | DOM | Units | Dist |
|---|---|---|---|---|---|---|---|---|
| 715 E Riverside Dr Evansville, IN | 2.0 | 1.0 | 806 | $895 | $1.11 | 21d | 1 | 0.11mi |
| 605 Madison Ave Evansville, IN | 2.0 | 1.0 | 1069 | $1,375 | $1.29 | 21d | 1 | 0.42mi |
| 1021 Jefferson Ave Evansville, IN | 1.0 | 1.0 | 798 | $795 | $1.00 | 13d | 1 | 0.54mi |
| 1421 SE 2nd St Unit A Evansville, IN | 1.0 | 1.0 | 800 | $695 | $0.87 | 13d | 1 | 0.57mi |
| 1500 S Harlan Ave Evansville, IN | 2.0 | 1.0 | 712 | $900 | $1.26 | 13d | 1 | 0.63mi |
| 734 Bayard Park Dr Evansville, IN | 3.0 | 2.0 | 1000 | $1,425 | $1.43 | 21d | 1 | 0.81mi |
| 827 Judson St Evansville, IN | 3.0 | 1.0 | 1008 | $1,295 | $1.28 | 13d | 1 | 0.83mi |
| 924 SE 6th St Unit A Evansville, IN | 1.0 | 1.0 | 800 | $875 | $1.09 | 21d | 1 | 0.84mi |
| 17 Washington Ave Evansville, IN | 2.0 | 1.0 | 882 | $1,455 | $1.65 | 21d | 1 | 0.86mi |
| 1505 Jackson Ave Evansville, IN | 2.0 | 1.0 | 780 | $995 | $1.28 | 21d | 1 | 0.92mi |
| 1133 Bayard Park Dr Unit B Evansville, IN | 2.0 | 1.0 | 990 | $800 | $0.81 | 21d | 1 | 0.92mi |
| 8 E Blackford Ave Evansville, IN | 1.0 | 1.0 | 750 | $825 | $1.10 | 21d | 1 | 0.92mi |
| 615 SE 3rd St Unit D Evansville, IN | 1.0 | 1.0 | 1122 | $895 | $0.80 | 21d | 1 | 1.09mi |
| 507 S Evans Ave Evansville, IN | 2.0 | 1.0 | 750 | $795 | $1.06 | 21d | 1 | 1.14mi |
| 2340 Sunburst Blvd Unit 2270-318 Evansville, IN | 2.0 | 1.0 | 815 | $900 | $1.10 | 21d | 1 | 1.22mi |
| 2340 Sunburst Blvd Unit 2200-202 Evansville, IN | 3.0 | 1.0 | 973 | $1,050 | $1.08 | 21d | 1 | 1.22mi |
| 1909 Taylor Ave Evansville, IN | 2.0 | 1.0 | 700 | $1,200 | $1.71 | 13d | 1 | 1.23mi |
| 1909 Plantation Ct Evansville, IN | 2.0 | 1.0 | 780 | $700 | $0.90 | 21d | 2 | 1.27mi |
| 322 SE 1st St Evansville, IN | 1.0–2.0 | 1.0 | 1100 | $1,700 | $1.55 | 21d | 6 | 1.30mi |
| 1952 Colts Ln Evansville, IN | 1.0–3.0 | 1.0 | 1146 | $1,035 | $0.90 | 21d | 8 | 1.31mi |
| 315 SE 1st St Evansville, IN | 1.0 | 1.0 | 1331 | $1,695 | $1.27 | 21d | 1 | 1.32mi |
| 304 S Grand Ave Evansville, IN | 2.0 | 1.0 | 967 | $955 | $0.99 | 21d | 1 | 1.35mi |
| 202 SE 1st St Evansville, IN | 1.0–2.0 | 1.0 | 926 | $2,449 | $2.64 | 21d | 4 | 1.40mi |
| 1762 Spring Ct Evansville, IN | 2.0 | 1.0 | 975 | $1,450 | $1.49 | 21d | 1 | 1.43mi |
| 100 SE 1st St Evansville, IN | 1.0–2.0 | 1.0–2.0 | 715 | $1,725 | $2.41 | 13d | 17 | 1.48mi |
| 1604 Marbo Ave Evansville, IN | 2.0 | 1.0 | 900 | $1,095 | $1.22 | 21d | 1 | 1.48mi |
| 329 Main St Evansville, IN | 1.0–2.0 | 1.0–2.0 | 717 | $1,505 | $2.10 | 13d | 1 | 1.49mi |
Listing history 22 events
-
2026-06-18days on market $94,900 Active 64 DOM
-
2026-06-17days on market $94,900 Active 63 DOM
-
2026-06-16days on market $94,900 Active 62 DOM
-
2026-06-15days on market $94,900 Active 61 DOM
-
2026-06-14days on market $94,900 Active 59 DOM
-
2026-06-13days on market $94,900 Active 58 DOM
-
2026-06-10days on market $94,900 Active 56 DOM
-
2026-06-09days on market $94,900 Active 55 DOM
-
2026-06-08days on market $94,900 Active 54 DOM
-
2026-06-07days on market $94,900 Active 53 DOM
-
2026-06-02days on market $94,900 Active 48 DOM
-
2026-06-01days on market $94,900 Active 47 DOM
-
2026-05-31days on market $94,900 Active 46 DOM
-
2026-05-30days on market $94,900 Active 45 DOM
-
2026-05-06price $94,900
-
2026-04-15$99,900 Active
-
2026-02-02status Active
-
2025-12-18price $114,900
-
2025-10-22price $119,900
-
2025-09-26status Active
-
2025-03-31$119,000 Active
-
2023-07-19$75,000 Active
ⓘ Source: listings_history table (triggers on properties + properties_extension) + one-shot
backfill from property_details.listing_events for pre-trigger history.
Tax reassessment forecast IN · Partial reset (capped growth)
- Current annual tax
- $1,267 · $106/mo
- Projected year-2 tax
- $1,267 · $106/mo
- Expected delta
- $0/yr ($0/mo · 0.0%)
ⓘ Screening estimate from a state-policy table — verify with the county assessor before closing.
Climate risk First Street
- Flood 4/10 Moderate FEMA zone X · 22% chance over 30 yrs
- Wildfire 1/10 Low
- Heat 5/10 Major 7 d/yr ≥107°F today · 19 d/yr by 30 yrs out
- Wind 2/10 Low 3% chance of damaging wind over 30 yrs
- Air quality 4/10 Moderate 3 unhealthy d/yr today · 5 by 30 yrs out
Nearby sold comps map
Loading sold comps map…
Walkable amenities ~0.75 mi
Loading nearby amenities…
Taxation est. · year 1
- Rental income
- $12,593
- − Mortgage interest
- −$5,316
- − Property taxes
- −$1,267
- − Insurance
- −$474
- − Repairs & maintenance
- −$1,007
- − Management
- −$1,007
- − Depreciation
- −$2,761
- Taxable income
- $760
- Est. tax owed @ 24.0%
- −$182
- After-tax cash flow
- $2,053/yr
For passive investors: Depreciation is non-cash, so a rental often shows a tax loss while cash-flowing — sheltering income. Rental losses are passive: they offset passive income freely, and up to $25,000/yr can offset ordinary (W-2) income if you actively participate and your MAGI is under $100k (phasing out to $0 by $150k); unused losses carry forward. On sale, claimed depreciation is recaptured at up to 25%, and gains may owe capital-gains tax (a 1031 exchange can defer both). Figures are a year-1 estimate at your 24.0% rate — not tax advice; consult a CPA.
Schools (NCES district)
- District
- Evansville Vanderburgh School Corporation
- NCES district ID
- 1803450
- Math proficiency
- 36% ▼ -7.00%
- Reading proficiency
- 43% ▼ -3.00%
- Median HH income
- $43,270
- Composite
- 33.41/100
- National rank
- #5471
- State rank
- #153 of 301 in IN
Livability — Evansville
- Score
- 63/100
- State rank
- #416
- US rank
- #15047
Category grades
Schools grade is shown separately in the Schools card above.
Census & demographics
- Census place
- Evansville, IN
- County
- Vanderburgh County · 146,793 people
- City population
- 146,793
- Metro
- Evansville, IN-KY
- Population (ZIP)
- 9,988
- Household income
- $40,873
- Rent vs Own
- Severe rent burden
- 735.0
Population outlook (Vanderburgh County) Hauer SSP2
- Today (2025)
- 187,038 people
- By 2030
- 188,907 · +1.0%
- By 2040
- 190,272 · +1.7%
- By 2050
- 188,871 · +1.0%
- By 2075
- 180,751 · -3.4%
- By 2100
- 163,015 · -12.8%
Race, ethnicity, and origin ACS 2023
- Neighborhood character
- Diverse neighborhood (Simpson 0.60)
- Race & ethnicity
- White 50% Black 39% Two or more races 7% Hispanic / Latino 3% Pacific Islander 1% Asian 1%
- Common ancestry
- Romanian 2% Lithuanian 1% Italian 1%
- Foreign-born
- 5% · Canada
- Languages at home
- 96% English-only · Spanish 2% Tagalog/Filipino 1% French/Haitian/Cajun 1%
Political lean MEDSL · Vanderburgh
- 2024 margin
- R (+12.7) · D 43.0% · R 55.6% · Other 1.4%
- 2008→2024 swing
- -15.1pp toward R · 2008: 2.5pp · 2024: -12.7pp
- All cycles
- 2024: R+12.7 2020: R+9.6 2016: R+16.9 2012: R+10.8 2008: D+2.5
Not yet ingested
- Civics
- —
Market trends
- HPI YoY
- ▼ -119.22%
- Current HPI
- 229.9312
- Rent YoY
- ▲ 9.87%
- Metro
- Evansville, IN-KY
- State GDP YoY
- ▲ 2.90%
- F500 in state
- 18
Industry mix (Fortune 500 HQ in IN)
| Industry | F500 HQs | Revenue |
|---|---|---|
| Industrial Machinery | 2 | $37B |
|
||
| Healthcare | 1 | $177B |
|
||
| Pharmaceuticals | 1 | $45B |
|
||
| Metals / Steel | 1 | $18B |
|
||
| Agriculture | 1 | $17B |
|
||
| Packaging | 1 | $12B |
|
||
Price history
+26.5% since first listed8 events — show timeline
- 2026-05-06 Price Changed $94,900 IRMLS
- 2026-04-15 Listed $99,900 IRMLS
- 2026-02-02 Relisted — IRMLS
- 2025-12-18 Price Changed $114,900 IRMLS
- 2025-10-22 Price Changed $119,900 IRMLS
- 2025-09-26 Relisted — IRMLS
- 2025-03-31 Listed $119,000 IRMLS
- 2023-07-19 Listed $75,000 IRMLS
Property tax history
+2.5%/yrLatest (2024): $1,267 · +2.2% YoY. Source: county tax records.
Cash-flow waterfall
monthlySold comps — $/sqft
last 12 mo · ≤1 miLoading sold comps…