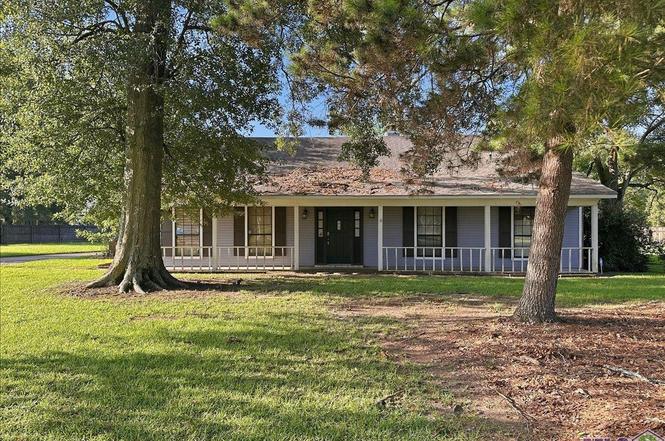
12556 White Chapel Ave · Oak Hills Place, LA
Flood risk 1/10 · Minimal
- FEMA flood zone
- X
- Chance of flooding over 30 yrs
- 0.0%
- Est. flood insurance / yr
- $507 – $1,088
Fire risk 1/10 · Minimal
- Est. fire insurance / yr
- $1,269 – $2,357
Heat risk 8/10 · Major
- Hot days now (above 108°F)
- 7 days/yr
- Hot days in 30 yrs
- 21 days/yr
Wind risk 9/10 · Severe
- Chance of severe wind over 30 yrs
- 99.0%
Air-quality risk 3/10 · Minor
- Unhealthy air days now
- 3 days/yr
- Unhealthy air days in 30 yrs
- 3 days/yr
Risk factors via First Street. Map © Google.
Why this score? — see what drove the B+ grade
The composite is a weighted blend of 9 inputs, each scored 0–100. Each bar is that input's sub-score; the figure is the points it added to the 100-point composite (weight × sub-score).
- Cash flow +30.0/30.0
- ARV discount +15.0/15.0
- DSCR +10.0/10.0
- 1% rule +9.2/10.0
- Livability +3.9/5.0
- Rent growth +2.7/5.0
- Condition / age +2.5/5.0
- Schools +2.4/10.0
- Appreciation +0.0/10.0
$150,000
🖨 Deal sheet 📄 Offer letter ✓ Due diligence
Listing remarks MLS
Property went pending prior to completing mls listing submittal. Home needs repairs along with some TLC. Show Anytime, but please request/log all showings thru ShowingTime prior to walking the property. **Photos are edited by a professional photo editor for marketing purposes. Some photos may have Ai Generated Furniture in the homes for visualization purposes.**
Key facts
- 0.76 acre lot
- Garage
- Built 1983
Neighborhood map
What this means for you Summary
Snapshot
- This is a 3-bed/2.0-bath single-family listed at $150k.
Deal economics
- At list price, monthly cash flow is $626 ($8k/yr) — positive.
- The deal already cash-flows at list — no discount required.
- Meets the 1% rule at list price ($2k rent vs $150k).
- Cap rate 11.3% vs local median 2.8% in Oak Hills Place — top-decile yield for the area; either an underpriced asset or a hidden risk that comps aren't pricing in. Stress-test before assuming the spread holds.
Location & tenants
- Location reads 78/100 on livability (#7 in LA, #2,600 nationally) — a middle-class / working-renter tenant base. Strengths: employment A+, housing A+, health & safety A+; Watch: cost of living D, commute F.
- East Baton Rouge Parish (urban): math 22% / reading 34% proficiency, ranked #47 of 98 in LA (top 48%) — low school quality limits family demand, transient renter base, plan for 1-2y turnover; 77% free/reduced lunch — lower-income household profile, screen leases tightly.
- Market conditions: Rents flat; 625 active listings in the ZIP; 22 comparable units currently listed for rent nearby; rentals at typical pace (median 24d on market — plan ~3-4 weeks tenant-placement turnaround); solid renter incomes; 2,252 units permitted in East Baton Rouge Parish in 2024 (440 in 5+ unit buildings).
Forward outlook
- Local home prices are declining (-3.0%/yr); year-one equity from $1k of loan paydown is wiped out by about $4k of value loss. Plan a longer hold.
- East Baton Rouge County population projected at +4% by 2050 — modest demand growth; plan on rents tracking national, not racing it.
- At projected returns (-3.0% appreciation + 0.7% rent growth), your $42k cash investment doubles in ~9 years — after that, you're playing with house money.
Negotiation context
- Only 0 days on market — expect competitive offers; lowballing is unlikely to land.
- 2 sale attempts with the ask held roughly flat each time — persistent listings suggest the price (not the market) is what's stuck; bring a comps-based counter.
Risks & watch-outs
- Climate carrying-cost: severe wind risk, 99% chance of damaging wind over 30y; extreme-heat days projected 7→21/yr by 2055 (HVAC capex compounding) — expect insurance premiums to compound above CPI over the hold.
Questions for the listing agent
- Is there a deadline driving the sale (1031 exchange, divorce, estate, relocation)? That informs how much negotiation room exists.
- Schools are B-rated — typically a magnet for longer-tenancy family renters. What's the average tenant stay here, and is there a school-zone premium baked into asking?
- What's the average days-on-market for RENTAL listings here right now (not sales)? A rising rental-DOM trend means longer vacancies and softer asking-rent achievability than the comps imply.
- What's the recent tenant-quality profile in this submarket — average credit score on applications, eviction rate, late-payment / NSF rate, and stable-employment percentage? A property-management company in the area should have these aggregated.
- How much new for-sale + rental construction is in the pipeline within 1–3 miles? Heavy new supply typically softens prices + rents 12–24 months out; constrained supply supports both.
Investment metrics
- 1% rule
- 1.42% ✓
- Cap rate
- 11.30%
- Cash-on-cash
- 17.88%
- DSCR
- 1.80
- GRM
- 5.9
CMA / ARV
- ARV (on-the-fly)
- $285,405
- Comps found
- 12
Show comp detail 12 sales within ~0.75 mi
| Address | Dist | Beds/Ba | Sqft | Sold | Price | $/sf | Match |
|---|---|---|---|---|---|---|---|
| 1451 White Cross Dr | 0.13mi | 3/2.0 | 1,949 (+9%) | 0mo | $255,000 | $131 | 79 |
| 12842 Magnolia Chase Dr | 0.18mi | 3/2.0 | 1,605 (-11%) | 1mo | $265,000 | $165 | 73 |
| 1342 Barkley Dr | 0.26mi | 4/2.0 (+1) | 1,900 (+6%) | 2mo | $289,900 | $153 | 72 |
| 945 Tanglebriar Dr | 0.47mi | 3/2.0 | 1,827 (+2%) | 6mo | $299,000 | $164 | 70 |
| 1552 S Peck Dr | 0.63mi | 3/2.0 | 1,760 (-2%) | 2mo | $245,000 | $139 | 66 |
| 902 Woodhue Dr | 0.48mi | 3/2.0 | 1,657 (-8%) | 1mo | $285,000 | $172 | 64 |
| 1206 Cornerstone Dr | 0.23mi | 3/3.0 | 2,014 (+12%) | 5mo | $367,000 | $182 | 60 |
| 13105 Briargrove Ave | 0.27mi | 4/2.0 (+1) | 1,537 (-14%) | 1mo | $244,000 | $159 | 58 |
| 13233 Briar Hollow Ave | 0.39mi | 4/2.0 (+1) | 1,576 (-12%) | 4mo | $248,500 | $158 | 53 |
| 1103 Rue Desiree | 0.69mi | 3/2.5 | 1,650 (-8%) | 1mo | $290,000 | $176 | 52 |
| 13678 E Jolissaint Dr | 0.67mi | 4/2.0 (+1) | 1,582 (-12%) | 1mo | $235,000 | $149 | 43 |
| 1522 Bullrush Dr | 0.73mi | 3/2.0 | 1,573 (-12%) | 4mo | $245,000 | $156 | 42 |
Match score weights: distance 35% · size 25% · config 20% · recency 20%. Top-matched comps best support the ARV.
Projected returns pro-forma
-3.0% appreciation · 0.68% rent growth · sell at horizon
- IRR
- 6.7%
- Equity multiple
- 1.26×
- Total profit
- $10,736
- Equity at exit
- $22,365
- IRR
- 13.9%
- Equity multiple
- 2.00×
- Total profit
- $41,819
- Equity at exit
- $12,969
Cash invested: $42,000 (down + closing). Projections, not guarantees.
Landlord ↔ Tenant lean methodology
- Overall (STATE)
- 90 Strongly Landlord-Friendly
- State Louisiana
- 90 Strongly Landlord-Friendly · R+12
- County
- — inherits STATE
- City
- — inherits STATE
ZIP-level market 70810
- Rents YoY
- 0.7%
- Active inventory
- 625
- Price-to-rent
- 5.9×
Monthly cashflow live
- Estimated rent
- $2,129 high interval (Pro) →
- Mortgage (P&I)
- −$787
- Tax from tax record
- −$207 /mo · $2,489/yr
- Insurance
- −$62
- HOA
- −$0
- Vacancy / Maint / Mgmt
- −$447
- Net cashflow
- $626
Break-even live
UW: 25.0% down · 7.5% · 30yr · 1.5% tax · 5.0% vac · 8.0% maint · 8.0% mgmt
Financing live
Cash to close
- Down payment
- $37,500
- Closing costs
- $4,500
- Reserves months
- —
- Total cash needed
- —
Loan-product check · same deal, 3 products live
Conventional
25% down · 7.5% · 30yr
- Down + closing
- —
- Monthly P&I
- —
- Monthly cashflow
- —
- DSCR
- —
- Eligible?
- —
Personal DTI + credit; lowest rate.
DSCR
20% down · 8.5% · 30yr
- Down + closing
- —
- Monthly P&I
- —
- Monthly cashflow
- —
- DSCR
- —
- Eligible?
- —
No personal income docs; deal must DSCR.
Hard money
10% down · 12.0% · 12mo
- Down + closing
- —
- Monthly P&I
- —
- Monthly cashflow
- —
- DSCR
- —
- Eligible?
- —
Short-term bridge; refi at stabilization.
Rent comps 22 comps
| Address | Beds | Baths | Sqft | Rent | $/sqft | DOM | Units | Dist |
|---|---|---|---|---|---|---|---|---|
| 9843 Siegen Ln Baton Rouge, LA | 2.0 | 2.5 | 1225 | $1,500 | $1.22 | 43d | 1 | 0.30mi |
| 9849 Siegen Ln Baton Rouge, LA | 2.0 | 2.5 | 1260 | $1,575 | $1.25 | 14d | 1 | 0.31mi |
| 1741 Twisted Oak Ln Baton Rouge, LA | 3.0 | 2.0 | 1508 | $1,825 | $1.21 | 23d | 1 | 0.39mi |
| 1741 Twisted Oak Ln Baton Rouge, LA | 3.0 | 2.0 | 1368 | $1,825 | $1.33 | 43d | 1 | 0.39mi |
| 13344 Natchez Ct Baton Rouge, LA | 3.0 | 2.0 | 1521 | $2,500 | $1.64 | 23d | 1 | 0.40mi |
| 12336 Perkins Rd Unit 1519872P Baton Rouge, LA | 3.0 | 2.0 | 1894 | $3,138 | $1.66 | 14d | 1 | 0.48mi |
| 13431 Briargrove Ave Baton Rouge, LA | 4.0 | 2.0 | 1551 | $1,900 | $1.23 | 23d | 1 | 0.52mi |
| 1345 Bullrush Dr Baton Rouge, LA | 3.0 | 2.0 | 1294 | $1,800 | $1.39 | 14d | 1 | 0.73mi |
| 7317 Meadow Park Ave Baton Rouge, LA | 3.0 | 2.0 | 1251 | $1,600 | $1.28 | 43d | 1 | 0.82mi |
| 11432 Cotton Ln Baton Rouge, LA | 3.0 | 2.5 | 1771 | $3,400 | $1.92 | 43d | 1 | 0.87mi |
| 11430 Cotton Ln Baton Rouge, LA | 3.0 | 2.5 | 1771 | $3,400 | $1.92 | 43d | 1 | 0.87mi |
| 10440 Cotton Ln Baton Rouge, LA | 3.0 | 2.5 | 1771 | $3,600 | $2.03 | 21d | 1 | 0.90mi |
| 10734 Erin Vale Ave Baton Rouge, LA | 3.0 | 2.0 | 1614 | $2,000 | $1.24 | 44d | 1 | 0.93mi |
| 10642 Molly Ave Baton Rouge, LA | 3.0 | 2.0 | 1950 | $2,300 | $1.18 | 23d | 1 | 0.99mi |
| 13023 Great Tern Ave Baton Rouge, LA | 3.0 | 2.0 | 2014 | $2,300 | $1.14 | 23d | 1 | 1.08mi |
| 8500 Bluebonnet Blvd #24 Baton Rouge, LA | 3.0 | 2.0 | 1430 | $1,600 | $1.12 | 19d | 1 | 1.28mi |
| 10201 Park Rowe Ave Baton Rouge, LA | 1.0–3.0 | 1.0–2.0 | 1036 | $2,428 | $2.34 | 14d | 18 | 1.30mi |
| 10156 Perkins Rowe Baton Rouge, LA | 1.0–4.0 | 1.0–4.0 | 1433 | $2,745 | $1.92 | 14d | 23 | 1.31mi |
| 9219 Baronne Dr Baton Rouge, LA | 4.0 | 2.0 | 1602 | $2,100 | $1.31 | 14d | 1 | 1.35mi |
| 14145 Gravier Ave Baton Rouge, LA | 4.0 | 2.0 | 1442 | $2,200 | $1.53 | 23d | 1 | 1.40mi |
| 9955 Buttercup Dr Baton Rouge, LA | 3.0 | 2.0 | 1570 | $1,950 | $1.24 | 43d | 1 | 1.40mi |
| 8933 Baronne Dr Baton Rouge, LA | 3.0 | 2.0 | 1386 | $1,450 | $1.05 | 43d | 1 | 1.44mi |
Listing history 2 events
-
2026-06-14remarks 370-char remark
-
2026-06-14$150,000 Pending
ⓘ Source: listings_history table (triggers on properties + properties_extension) + one-shot
backfill from property_details.listing_events for pre-trigger history.
Tax reassessment forecast LA · Resets to sale price
- Current annual tax
- $2,489 · $207/mo
- Projected year-2 tax
- $2,489 · $207/mo
- Expected delta
- $0/yr ($0/mo · 0.0%)
ⓘ Screening estimate from a state-policy table — verify with the county assessor before closing.
Climate risk First Street
- Flood 1/10 Low FEMA zone X · 0% chance over 30 yrs
- Wildfire 1/10 Low
- Heat 8/10 Severe 7 d/yr ≥108°F today · 21 d/yr by 30 yrs out
- Wind 9/10 Extreme 99% chance of damaging wind over 30 yrs
- Air quality 3/10 Moderate 3 unhealthy d/yr today · 3 by 30 yrs out
Nearby sold comps map
Loading sold comps map…
Walkable amenities ~0.75 mi
Loading nearby amenities…
Taxation est. · year 1
- Rental income
- $25,554
- − Mortgage interest
- −$8,402
- − Property taxes
- −$2,489
- − Insurance
- −$750
- − Repairs & maintenance
- −$2,044
- − Management
- −$2,044
- − Depreciation
- −$4,364
- Taxable income
- $5,460
- Est. tax owed @ 24.0%
- −$1,311
- After-tax cash flow
- $6,199/yr
For passive investors: Depreciation is non-cash, so a rental often shows a tax loss while cash-flowing — sheltering income. Rental losses are passive: they offset passive income freely, and up to $25,000/yr can offset ordinary (W-2) income if you actively participate and your MAGI is under $100k (phasing out to $0 by $150k); unused losses carry forward. On sale, claimed depreciation is recaptured at up to 25%, and gains may owe capital-gains tax (a 1031 exchange can defer both). Figures are a year-1 estimate at your 24.0% rate — not tax advice; consult a CPA.
Schools (NCES district)
- District
- East Baton Rouge Parish
- NCES district ID
- 2200540
- Math proficiency
- 22% ▼ -36.00%
- Reading proficiency
- 34% ▼ -31.00%
- Median HH income
- $46,263
- Composite
- 24.14/100
- National rank
- #7745
- State rank
- #47 of 98 in LA
Livability — Oak Hills Place
- Score
- 78/100
- State rank
- #7
- US rank
- #2600
Category grades
Schools grade is shown separately in the Schools card above.
Census & demographics
- Census place
- Oak Hills Place, LA
- County
- East Baton Rouge Parish · 399,686 people
- Metro
- Baton Rouge, LA
- Population (ZIP)
- 42,659
- Household income
- $92,098
- Rent vs Own
- Severe rent burden
- 1106.0
Population outlook (East Baton Rouge County) Hauer SSP2
- Today (2025)
- 464,810 people
- By 2030
- 472,137 · +1.6%
- By 2040
- 480,243 · +3.3%
- By 2050
- 484,422 · +4.2%
- By 2075
- 492,069 · +5.9%
- By 2100
- 476,347 · +2.5%
Race, ethnicity, and origin ACS 2023
- Neighborhood character
- Diverse neighborhood (Simpson 0.60)
- Race & ethnicity
- White 55% Black 29% Hispanic / Latino 7% Two or more races 6% Asian 6%
- Hispanic origin (detail)
- Mexican 1%
- Common ancestry
- Lithuanian 11% Slovak 2% Scottish 1%
- Foreign-born
- 9% · Canada, China, South Korea
- Languages at home
- 89% English-only · Spanish 4% Other Indo-European 2% Chinese 1%
Political lean MEDSL · East Baton Rouge
- 2024 margin
- D (+11.1) · D 54.5% · R 43.4% · Other 2.1%
- 2008→2024 swing
- +8.9pp toward D · 2008: 2.2pp · 2024: 11.1pp
- All cycles
- 2024: D+11.1 2020: D+13.1 2016: D+9.2 2012: D+5.2 2008: D+2.2
Not yet ingested
- Civics
- —
Market trends
- HPI YoY
- ▼ -117.55%
- Current HPI
- 172.7593
- Rent YoY
- ▲ 0.68%
- Metro
- Baton Rouge, LA
- State GDP YoY
- ▲ 3.29%
- F500 in state
- 10
Industry mix (Fortune 500 HQ in LA)
| Industry | F500 HQs | Revenue |
|---|---|---|
| Telecommunications | 2 | $23B |
|
||
| Utilities | 1 | $12B |
|
||
| Wholesale / Distribution | 1 | $5B |
|
||
| Advertising | 1 | $2B |
|
||
Price history
+0.0% since first listed4 events — show timeline
- 2026-06-03 Delisted — GBRMLS
- 2026-05-26 Listed $150,000 AcadianaMLS
- 2026-05-26 Listed $150,000 GBRMLS
- 1983-12-01 Sold (Public Records) — Public Records
Property tax history
+5.0%/yrLatest (2025): $2,489 · -0.5% YoY. Source: county tax records.
Cash-flow waterfall
monthlySold comps — $/sqft
last 12 mo · ≤1 miLoading sold comps…