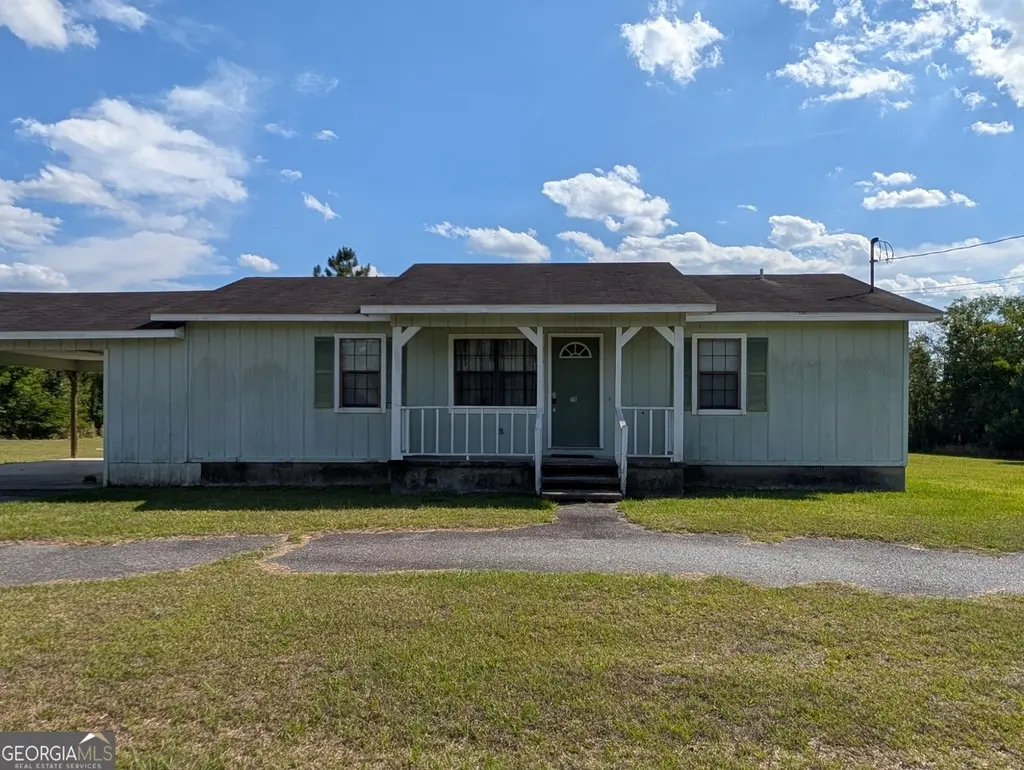
715 Charles St · Ailey, GA
Flood risk 1/10 · Minimal
- FEMA flood zone
- X (unshaded)
- Chance of flooding over 30 yrs
- 0.0%
- Est. flood insurance / yr
- $507 – $1,088
Fire risk 5/10 · Moderate
- Est. fire insurance / yr
- $963 – $1,789
Heat risk 7/10 · Major
- Hot days now (above 108°F)
- 7 days/yr
- Hot days in 30 yrs
- 18 days/yr
Wind risk 8/10 · Major
- Chance of severe wind over 30 yrs
- 80.0%
Air-quality risk 2/10 · Minimal
- Unhealthy air days now
- 1 days/yr
- Unhealthy air days in 30 yrs
- 1 days/yr
Risk factors via First Street. Map © Google.
Why this score? — see what drove the C- grade
The composite is a weighted blend of 9 inputs, each scored 0–100. Each bar is that input's sub-score; the figure is the points it added to the 100-point composite (weight × sub-score).
- Cash flow +15.0/30.0
- ARV discount +12.3/15.0
- Appreciation +5.0/10.0
- DSCR +4.6/10.0
- 1% rule +4.1/10.0
- Livability +3.1/5.0
- Rent growth +2.5/5.0
- Schools +2.4/10.0
- Condition / age +2.2/5.0
$122,000
🖨 Deal sheet 📄 Offer letter ✓ Due diligence
Listing remarks
This home is priced to sale. Recently used as an office. Seller has not occupied the premises. 3 bedrooms, 2 full baths, living/dining combo, galley style kitchen w/ out appliances and a laundry area off kitchen. Lots of closet space, vinyl flooring, attached carport with storage area. Home is being sold as is.
Key facts
- 0.74 acre lot
- Built 1988
- Listed 29 days
Property features AI
Finance
- Other: Approximately 0.74-acre lot (public records)
- Financial info: Listing available for cash or conventional financing; Special conditions: Government owned, no disclosure
- HOA & community: No homeowners association
Exterior
- Parking: Attached carport
- Utilities: Public water; Public sewer; Electricity available; Cable available; High-speed internet available
- Home design: Single-family residence; House structure type; Resale property; Built in 1988
- Construction: Brick construction; Composition roof; Crawl space foundation
- Exterior features: City lot
Interior
- Kitchen: No appliances listed; Kitchen includes laundry area
- Bedrooms: 3 bedrooms on the main level
- Flooring: Vinyl flooring
- Bathrooms: 2 full bathrooms on the main level
- Heating & cooling: Electric heating with heat pump; Central electric air conditioning
- Interior features: Split-bedroom floor plan; Tile bathrooms; One level (single-story); Crawl space basement
- Laundry & utility: Laundry located in the kitchen
Neighborhood map
What this means for you Summary
Snapshot
- This is a 3-bed/2.0-bath single-family listed at $122k. Condition is rated fair.
Deal economics
- At list price, monthly cash flow is $38 ($460/yr) — positive.
- The deal already cash-flows at list — no discount required.
- To meet the 1% rule (rent ≥ 1% of price), the offer needs to be $112k (8.5% below list).
- Recommended offer: $112k (8.5% below list) — sets the bar for 1% rule.
Location & tenants
- Location reads 61/100 on livability (#331 in GA) — a middle-class / working-renter tenant base. Strengths: cost of living A+, housing A-; Watch: health & safety C-, employment D, crime D-.
- Montgomery County (rural): math 26% / reading 31% proficiency, ranked #105 of 174 in GA (top 60%) — low school quality limits family demand, transient renter base, plan for 1-2y turnover; 73% free/reduced lunch — lower-income household profile, screen leases tightly.
- Zoned schools: Montgomery County Elementary School (math 20% / reading 26%, grade F, #797 of 1,228 statewide, top 65%, 453 students, 95% FRL) — zoned schools average 95% FRL vs 73% district-wide (22 pts higher); higher-poverty schools than district average — tighter screening recommended.
- Market conditions: 5 active listings in the ZIP; 23 units permitted in Montgomery County in 2024 (0 in 5+ unit buildings).
Forward outlook
- In year one you build about $5k of equity ($843 loan paydown + $4k appreciation (3.0% local appreciation)).
- Montgomery County population projected at -18% by 2050 — secular population decline; favor cash flow + early exit over multi-decade hold.
- At projected returns (3.0% appreciation + 3.0% rent growth), your $34k cash investment doubles in ~6 years — after that, you're playing with house money.
- By year 8, paydown + projected appreciation supports a ~$33k cash-out refi (75% LTV) — recoverable capital for the next deal without selling this one.
Negotiation context
- It's been on market 29 days — a 2% lower offer ($120k) is reasonable based on typical stale-listing flexibility.
Risks & watch-outs
- Climate carrying-cost: severe wind risk, 80% chance of damaging wind over 30y; moderate wildfire risk; extreme-heat days projected 7→18/yr by 2055 (HVAC capex compounding) — expect insurance premiums to compound above CPI over the hold.
Questions for the listing agent
- Have any recent inspections been done? Can we get a copy of the seller's disclosures and any deferred-maintenance estimates?
- Is there a deadline driving the sale (1031 exchange, divorce, estate, relocation)? That informs how much negotiation room exists.
- Crime grade is D in this area — have there been break-ins, vandalism, or insurance claims at this property in the last 3 years? What carrier currently insures it and at what premium?
- What's the average days-on-market for RENTAL listings here right now (not sales)? A rising rental-DOM trend means longer vacancies and softer asking-rent achievability than the comps imply.
- What's the recent tenant-quality profile in this submarket — average credit score on applications, eviction rate, late-payment / NSF rate, and stable-employment percentage? A property-management company in the area should have these aggregated.
- How much new for-sale + rental construction is in the pipeline within 1–3 miles? Heavy new supply typically softens prices + rents 12–24 months out; constrained supply supports both.
Investment metrics
- 1% rule
- 0.91% ✗
- Cap rate
- 6.67%
- Cash-on-cash
- 1.35%
- DSCR
- 1.06
- GRM
- 9.1
CMA / ARV
- ARV (median comp)
- $136,576
- List price
- $122,000
- Delta
- -10.67%
- Verdict
- UNDERPRICED
- Comps
- 5 within 1.0 mi
Projected returns pro-forma
3.0% appreciation · 3.0% rent growth · sell at horizon
- IRR
- 8.8%
- Equity multiple
- 1.50×
- Total profit
- $17,155
- Equity at exit
- $54,856
- IRR
- 11.3%
- Equity multiple
- 2.69×
- Total profit
- $57,691
- Equity at exit
- $84,540
Cash invested: $34,160 (down + closing). Projections, not guarantees.
Landlord ↔ Tenant lean methodology
- Overall (STATE)
- 90 Strongly Landlord-Friendly
- State Georgia
- 90 Strongly Landlord-Friendly · R+3
- County
- — inherits STATE
- City
- — inherits STATE
ZIP-level market 30410
- Active inventory
- 5
- Price-to-rent
- 9.1×
Monthly cashflow live
- Estimated rent
- $1,116 medium interval (Pro) →
- Mortgage (P&I)
- −$640
- Tax est. 1.5%
- −$152 /mo · $1,830/yr
- Insurance
- −$51
- HOA
- −$0
- Vacancy / Maint / Mgmt
- −$234
- Net cashflow
- $38
Break-even live
UW: 25.0% down · 7.5% · 30yr · 1.5% tax · 5.0% vac · 8.0% maint · 8.0% mgmt
Financing live
Cash to close
- Down payment
- $30,500
- Closing costs
- $3,660
- Reserves months
- —
- Total cash needed
- —
Loan-product check · same deal, 3 products live
Conventional
25% down · 7.5% · 30yr
- Down + closing
- —
- Monthly P&I
- —
- Monthly cashflow
- —
- DSCR
- —
- Eligible?
- —
Personal DTI + credit; lowest rate.
DSCR
20% down · 8.5% · 30yr
- Down + closing
- —
- Monthly P&I
- —
- Monthly cashflow
- —
- DSCR
- —
- Eligible?
- —
No personal income docs; deal must DSCR.
Hard money
10% down · 12.0% · 12mo
- Down + closing
- —
- Monthly P&I
- —
- Monthly cashflow
- —
- DSCR
- —
- Eligible?
- —
Short-term bridge; refi at stabilization.
Listing history 7 events
-
2026-06-07statusdays on market $122,000 Under Contract 29 DOM
-
2026-06-04days on market $122,000 Active 28 DOM
-
2026-06-02days on market $122,000 Active 27 DOM
-
2026-06-01days on market $122,000 Active 26 DOM
-
2026-05-31days on market $122,000 Active 25 DOM
-
2026-05-31days on market $122,000 Active 24 DOM
-
2026-04-29$122,000 New 313-char remark
ⓘ Source: listings_history table (triggers on properties + properties_extension) + one-shot
backfill from property_details.listing_events for pre-trigger history.
Climate risk First Street
- Flood 1/10 Low FEMA zone X (unshaded) · 0% chance over 30 yrs
- Wildfire 5/10 Major
- Heat 7/10 Severe 7 d/yr ≥108°F today · 18 d/yr by 30 yrs out
- Wind 8/10 Severe 80% chance of damaging wind over 30 yrs
- Air quality 2/10 Low 1 unhealthy d/yr today · 1 by 30 yrs out
Nearby sold comps map
Loading sold comps map…
Walkable amenities ~0.75 mi
Loading nearby amenities…
Taxation est. · year 1
- Rental income
- $13,389
- − Mortgage interest
- −$6,834
- − Property taxes
- −$1,830
- − Insurance
- −$610
- − Repairs & maintenance
- −$1,071
- − Management
- −$1,071
- − Depreciation
- −$3,549
- Taxable loss
- −$1,576
- Est. tax savings @ 24.0%
- +$378
- After-tax cash flow
- $838/yr
For passive investors: Depreciation is non-cash, so a rental often shows a tax loss while cash-flowing — sheltering income. Rental losses are passive: they offset passive income freely, and up to $25,000/yr can offset ordinary (W-2) income if you actively participate and your MAGI is under $100k (phasing out to $0 by $150k); unused losses carry forward. On sale, claimed depreciation is recaptured at up to 25%, and gains may owe capital-gains tax (a 1031 exchange can defer both). Figures are a year-1 estimate at your 24.0% rate — not tax advice; consult a CPA.
Condition & rehab AI · 13 photos
The home requires moderate repairs to exterior siding and kitchen cabinets, but is otherwise in fair condition. Painting the exterior and replacing cabinets would significantly increase its value.
Repairs flagged
- Moderate Exterior siding — Weathered and needs repainting
- Minor Kitchen cabinets — No visible damage
Value-add opportunities
- Both Paint exterior siding — Enhances curb appeal and value
- Both Replace kitchen cabinets — Improves functionality and aesthetics
Renovation cost estimate screening
| Repair item | Severity | Est. cost |
|---|---|---|
| Exterior siding · Weathered and needs repainting | Moderate | $3,000–15,000 |
| Kitchen cabinets · No visible damage | Minor | $500–3,000 |
| Total estimated repair cost · 2 items | $3,500–18,000 |
Value-add ROI direction
- Both Paint exterior siding — Enhances curb appeal and value ↑
- Both Replace kitchen cabinets — Improves functionality and aesthetics ↑
ⓘ Cost ranges are severity-bucket heuristics (US national rule-of-thumb). Get contractor quotes + a written scope before underwriting a rehab budget.
Schools (NCES district)
- District
- Montgomery County
- NCES district ID
- 1303750
- Math proficiency
- 26% ▼ -3.00%
- Reading proficiency
- 31% ▼ -3.00%
- Median HH income
- $35,412
- Composite
- 23.55/100
- National rank
- #7859
- State rank
- #105 of 174 in GA
Livability — Ailey
- Score
- 61/100
- State rank
- #331
- US rank
- #17456
Category grades
Schools grade is shown separately in the Schools card above.
Census & demographics
- Census place
- Ailey, GA
- Population (ZIP)
- 1,699
Population outlook (Montgomery County) Hauer SSP2
- Today (2025)
- 8,589 people
- By 2030
- 8,293 · -3.4%
- By 2040
- 7,652 · -10.9%
- By 2050
- 7,066 · -17.7%
- By 2075
- 6,072 · -29.3%
- By 2100
- 5,522 · -35.7%
Race, ethnicity, and origin ACS 2023
- Neighborhood character
- Predominantly White (82%)
- Race & ethnicity
- White 82% Black 11% Hispanic / Latino 6%
- Hispanic origin (detail)
- Puerto Rican 5%
- Common ancestry
- Slovak 6% Serbian 2% Lithuanian 1%
- Foreign-born
- 1% · Canada
- Languages at home
- 99% English-only · Spanish 1% Other Indo-European 1%
Political lean MEDSL · Montgomery
- 2024 margin
- Solid R (+53.0) · D 23.3% · R 76.3%
- 2008→2024 swing
- -11.9pp toward R · 2008: -41.1pp · 2024: -53.0pp
- All cycles
- 2024: R+53.0 2020: R+49.9 2016: R+51.1 2012: R+39.9 2008: R+41.1
Not yet ingested
- Civics
- —
Market trends
- HPI YoY
- —
- Current HPI
- —
- Rent YoY
- —
- Metro
- —
- State GDP YoY
- ▲ 2.66%
- F500 in state
- 28
Industry mix (Fortune 500 HQ in GA)
| Industry | F500 HQs | Revenue |
|---|---|---|
| Paper / Packaging | 2 | $29B |
|
||
| Retail | 1 | $160B |
|
||
| Transportation / Logistics | 1 | $91B |
|
||
| Airlines | 1 | $62B |
|
||
| Consumer Goods | 1 | $47B |
|
||
| Utilities | 1 | $25B |
|
||
Price history
2 events — show timeline
- 2026-06-04 Pending — GAMLS
- 2026-04-29 Listed $122,000 GAMLS
Cash-flow waterfall
monthlySold comps — $/sqft
last 12 mo · ≤1 miLoading sold comps…