7721 Pontiac Dr · Myrtle Grove, FL
Flood risk 1/10 · Minimal
- FEMA flood zone
- X (unshaded)
- Chance of flooding over 30 yrs
- 0.0%
- Est. flood insurance / yr
- $507 – $1,088
Fire risk 3/10 · Minor
- Est. fire insurance / yr
- $947 – $1,759
Heat risk 10/10 · Severe
- Hot days now (above 105°F)
- 7 days/yr
- Hot days in 30 yrs
- 23 days/yr
Wind risk 9/10 · Severe
- Chance of severe wind over 30 yrs
- 99.0%
Air-quality risk 1/10 · Minimal
- Unhealthy air days now
- 0 days/yr
- Unhealthy air days in 30 yrs
- 0 days/yr
Risk factors via First Street. Map © Google.
Why this score? — see what drove the B+ grade
The composite is a weighted blend of 9 inputs, each scored 0–100. Each bar is that input's sub-score; the figure is the points it added to the 100-point composite (weight × sub-score).
- Cash flow +30.0/30.0
- ARV discount +15.0/15.0
- DSCR +10.0/10.0
- 1% rule +8.3/10.0
- Schools +3.6/10.0
- Rent growth +3.5/5.0
- Livability +3.2/5.0
- Condition / age +2.5/5.0
- Appreciation +0.0/10.0
$125,000
🖨 Deal sheet 📄 Offer letter ✓ Due diligence
Listing remarks
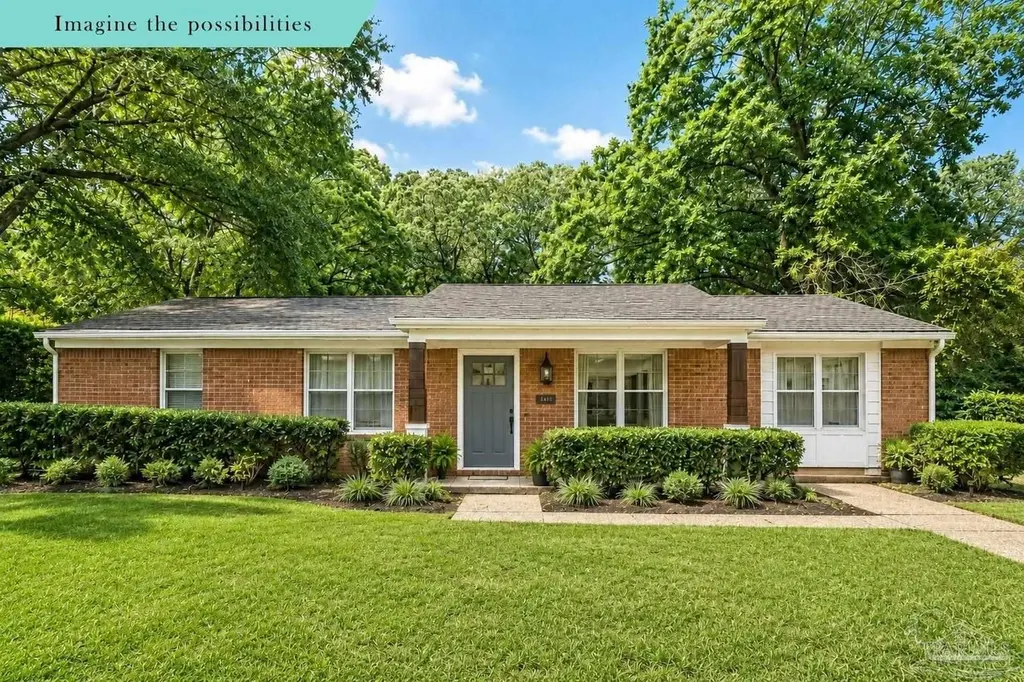
Bring your vision and unlock the potential in this classic brick ranch situated on a spacious 0.35-acre lot beneath mature trees! This 4-bedroom, 2-bath home offers 1,073 square feet, a 1-car garage, and endless opportunity for investors, flippers, or buyers ready to create something special. Owned by the same family since 1973, this property is ready for its next chapter. Inside, you'll find a functional layout with great natural light and the chance to completely transform the space into a warm, modern retreat. Reimagined design photos showcase just a glimpse of what this home could become. Step outside and imagine backyard BBQ nights, a cozy firepit gathering area, raised garden beds, an
Key facts
- Great natural light
- Classic brick ranch
- Spacious lot
Tags
Property features AI
Finance
- Other: Property listed as not new construction
- HOA & community: No homeowners association
Exterior
- Parking: Attached 1-car garage (1 covered parking space total)
- Utilities: Public water; Septic tank sewer; Aluminum electrical wiring
- Home design: One-story frame house; Slab foundation; Composition gable roof; Resale property; Not attached to another property; Homestead eligible
- Construction: Frame construction; Slab foundation; Composition gable roof; One level
- Exterior features: Chain link fence; Interior lot; Paved, county-maintained road access
Interior
- Kitchen: Original kitchen (1973); virtually renovated for inspiration; Electric water heater
- Bedrooms: Primary bedroom on the first floor (approx. 10 x 10); Additional bedroom on the first floor (approx. 10 x 10)
- Flooring: Vinyl
- Bathrooms: Two full bathrooms; Most bathroom fixtures original to 1973; virtually renovated for inspiration
- Heating & cooling: Central heating; Central air conditioning
- Interior features: Vinyl flooring; Eat-in kitchen
Neighborhood map
What this means for you Summary
Snapshot
- This is a 4-bed/2.0-bath single-family listed at $125k.
Deal economics
- At list price, monthly cash flow is $547 ($7k/yr) — positive.
- The deal already cash-flows at list — no discount required.
- Meets the 1% rule at list price ($2k rent vs $125k).
- Recommended offer: $123k (1.5% below list) — sets the bar for market timing.
- Cap rate 11.5% vs local median 5.1% in Myrtle Grove — top-decile yield for the area; either an underpriced asset or a hidden risk that comps aren't pricing in. Stress-test before assuming the spread holds.
Location & tenants
- Location reads 64/100 on livability (#701 in FL) — a middle-class / working-renter tenant base. Strengths: cost of living A+, housing A+, health & safety B+; Watch: schools D-, amenities F, commute F.
- Escambia (suburban): math 40% / reading 45% proficiency, ranked #56 of 73 in FL (top 77%) — families likely to look elsewhere, expect single-tenant / working-renter base with shorter leases.
- Market conditions: Rents rising (+3.9%/yr); 270 active listings in the ZIP; 3 comparable units currently listed for rent nearby; rentals at typical pace (median 24d on market — plan ~3-4 weeks tenant-placement turnaround); 1,479 units permitted in Escambia County in 2024 (0 in 5+ unit buildings).
- This rent runs 32% of the median local income ($62k/yr) — at the standard rent-burdened threshold; future hikes will face affordability resistance.
Forward outlook
- Local home prices are declining (-3.0%/yr); year-one equity from $864 of loan paydown is wiped out by about $4k of value loss. Plan a longer hold.
- Escambia County population projected at +13% by 2050 — modest demand growth; plan on rents tracking national, not racing it.
- At projected returns (-3.0% appreciation + 3.9% rent growth), your $35k cash investment doubles in ~7 years — after that, you're playing with house money.
Negotiation context
- It's been on market 26 days — a 2% lower offer ($123k) is reasonable based on typical stale-listing flexibility.
Risks & watch-outs
- Climate carrying-cost: severe wind risk, 99% chance of damaging wind over 30y; extreme-heat days projected 7→23/yr by 2055 (HVAC capex compounding) — expect insurance premiums to compound above CPI over the hold.
Questions for the listing agent
- Built in 1973 — when were the roof, HVAC, electrical panel, plumbing, and water heater last replaced?
- Is there a deadline driving the sale (1031 exchange, divorce, estate, relocation)? That informs how much negotiation room exists.
- Schools are D-rated, which usually means shorter tenancies and higher turnover. Who's the typical renter profile here, and what's been the actual vacancy rate?
- What's the average days-on-market for RENTAL listings here right now (not sales)? A rising rental-DOM trend means longer vacancies and softer asking-rent achievability than the comps imply.
- What's the recent tenant-quality profile in this submarket — average credit score on applications, eviction rate, late-payment / NSF rate, and stable-employment percentage? A property-management company in the area should have these aggregated.
- How much new for-sale + rental construction is in the pipeline within 1–3 miles? Heavy new supply typically softens prices + rents 12–24 months out; constrained supply supports both.
Investment metrics
- 1% rule
- 1.33% ✓
- Cap rate
- 11.54%
- Cash-on-cash
- 18.75%
- DSCR
- 1.83
- GRM
- 6.3
CMA / ARV
- ARV (on-the-fly)
- $173,628
- Comps found
- 12
Show comp detail 12 sales within ~0.75 mi
| Address | Dist | Beds/Ba | Sqft | Sold | Price | $/sf | Match |
|---|---|---|---|---|---|---|---|
| 7823 Montego Dr | 0.30mi | 3/2.0 (-1) | 1,062 (-3%) | 8mo | $180,000 | $169 | 70 |
| 7150 Heather Oaks Dr | 0.60mi | 3/2.0 (-1) | 1,152 (+6%) | 5mo | $182,680 | $159 | 53 |
| 6980 Weatherwood Dr | 0.63mi | 3/2.0 (-1) | 1,120 (+3%) | 11mo | $180,000 | $161 | 52 |
| 2853 Hidden Springs Dr | 0.34mi | 4/1.0 | 964 (-12%) | 10mo | $85,000 | $88 | 52 |
| 7866 Lenora Ct | 0.67mi | 3/1.5 (-1) | 1,101 (+1%) | 12mo | $187,000 | $170 | 50 |
| 720 N 79th Ave | 0.72mi | 3/1.0 (-1) | 1,104 (+1%) | 8mo | $105,000 | $95 | 49 |
| 7051 Heather Oaks Dr | 0.67mi | 3/2.0 (-1) | 1,170 (+7%) | 4mo | $160,000 | $137 | 49 |
| 7151 Heather Oaks Dr | 0.61mi | 3/2.0 (-1) | 1,191 (+9%) | 10mo | $177,000 | $149 | 43 |
| 7105 Windsor Oak Dr | 0.74mi | 3/2.0 (-1) | 1,002 (-8%) | 8mo | $160,000 | $160 | 40 |
| 7060 Heather Oaks Dr | 0.66mi | 3/2.0 (-1) | 1,248 (+14%) | 1mo | $200,000 | $160 | 39 |
| 7330 Sachem Rd | 0.59mi | 3/1.0 (-1) | 1,200 (+10%) | 10mo | $151,000 | $126 | 39 |
| 7100 Heather Oaks Dr | 0.64mi | 3/2.0 (-1) | 1,230 (+13%) | 8mo | $170,000 | $138 | 37 |
Match score weights: distance 35% · size 25% · config 20% · recency 20%. Top-matched comps best support the ARV.
Projected returns pro-forma
-3.0% appreciation · 3.85% rent growth · sell at horizon
- IRR
- 11.4%
- Equity multiple
- 1.46×
- Total profit
- $15,958
- Equity at exit
- $18,638
- IRR
- 21.0%
- Equity multiple
- 2.84×
- Total profit
- $64,547
- Equity at exit
- $10,808
Cash invested: $35,000 (down + closing). Projections, not guarantees.
Landlord ↔ Tenant lean methodology
- Overall (STATE)
- 87 Strongly Landlord-Friendly
- State Florida
- 87 Strongly Landlord-Friendly · R+3
- County
- — inherits STATE
- City
- — inherits STATE
ZIP-level market 32506
- Home prices YoY
- -22.5%
- Rents YoY
- 3.9%
- Active inventory
- 270
- Price-to-rent
- 6.3×
Monthly cashflow live
- Estimated rent
- $1,657 medium interval (Pro) →
- Mortgage (P&I)
- −$656
- Tax from tax record
- −$55 /mo · $654/yr
- Insurance
- −$52
- HOA
- −$0
- Vacancy / Maint / Mgmt
- −$348
- Net cashflow
- $547
Break-even live
UW: 25.0% down · 7.5% · 30yr · 1.5% tax · 5.0% vac · 8.0% maint · 8.0% mgmt
Financing live
Cash to close
- Down payment
- $31,250
- Closing costs
- $3,750
- Reserves months
- —
- Total cash needed
- —
Loan-product check · same deal, 3 products live
Conventional
25% down · 7.5% · 30yr
- Down + closing
- —
- Monthly P&I
- —
- Monthly cashflow
- —
- DSCR
- —
- Eligible?
- —
Personal DTI + credit; lowest rate.
DSCR
20% down · 8.5% · 30yr
- Down + closing
- —
- Monthly P&I
- —
- Monthly cashflow
- —
- DSCR
- —
- Eligible?
- —
No personal income docs; deal must DSCR.
Hard money
10% down · 12.0% · 12mo
- Down + closing
- —
- Monthly P&I
- —
- Monthly cashflow
- —
- DSCR
- —
- Eligible?
- —
Short-term bridge; refi at stabilization.
Rent comps 3 comps
| Address | Beds | Baths | Sqft | Rent | $/sqft | DOM | Units | Dist |
|---|---|---|---|---|---|---|---|---|
| 3219 Fresno Ave Pensacola, FL | 3.0 | 2.0 | 1192 | $1,375 | $1.15 | 23d | 1 | 0.97mi |
| 3230 Palmdale Ave Pensacola, FL | 3.0 | 2.0 | 1300 | $1,500 | $1.15 | 23d | 1 | 1.18mi |
| 4930 Laceiba Dr Pensacola, FL | 3.0 | 1.5 | 1020 | $1,300 | $1.27 | 21d | 1 | 1.33mi |
Listing history 14 events
-
2026-06-17status $125,000 Pending 26 DOM
-
2026-06-16days on market $125,000 Contingent 26 DOM
-
2026-06-15days on market $125,000 Contingent 25 DOM
-
2026-06-14days on market $125,000 Contingent 23 DOM
-
2026-06-10days on market $125,000 Contingent 20 DOM
-
2026-06-09days on market $125,000 Contingent 19 DOM
-
2026-06-08days on market $125,000 Contingent 18 DOM
-
2026-06-07statusdays on market $125,000 Contingent 17 DOM
-
2026-06-03days on market $125,000 Active 13 DOM
-
2026-06-02days on market $125,000 Active 12 DOM
-
2026-06-01days on market $125,000 Active 11 DOM
-
2026-05-31days on market $125,000 Active 10 DOM
-
2026-05-31days on market $125,000 Active 9 DOM
-
2026-05-21$125,000 Active
ⓘ Source: listings_history table (triggers on properties + properties_extension) + one-shot
backfill from property_details.listing_events for pre-trigger history.
Tax reassessment forecast FL · Resets to sale price
- Current annual tax
- $654 · $55/mo
- Projected year-2 tax
- $1,038 · $86/mo
- Expected delta
- +$383/yr (+$32/mo · 58.6%)
ⓘ Screening estimate from a state-policy table — verify with the county assessor before closing.
Climate risk First Street
- Flood 1/10 Low FEMA zone X (unshaded) · 0% chance over 30 yrs
- Wildfire 3/10 Moderate
- Heat 10/10 Extreme 7 d/yr ≥105°F today · 23 d/yr by 30 yrs out
- Wind 9/10 Extreme 99% chance of damaging wind over 30 yrs
- Air quality 1/10 Low 0 unhealthy d/yr today · 0 by 30 yrs out
Nearby sold comps map
Loading sold comps map…
Walkable amenities ~0.75 mi
Loading nearby amenities…
Taxation est. · year 1
- Rental income
- $19,881
- − Mortgage interest
- −$7,002
- − Property taxes
- −$654
- − Insurance
- −$625
- − Repairs & maintenance
- −$1,590
- − Management
- −$1,590
- − Depreciation
- −$3,636
- Taxable income
- $4,783
- Est. tax owed @ 24.0%
- −$1,148
- After-tax cash flow
- $5,413/yr
For passive investors: Depreciation is non-cash, so a rental often shows a tax loss while cash-flowing — sheltering income. Rental losses are passive: they offset passive income freely, and up to $25,000/yr can offset ordinary (W-2) income if you actively participate and your MAGI is under $100k (phasing out to $0 by $150k); unused losses carry forward. On sale, claimed depreciation is recaptured at up to 25%, and gains may owe capital-gains tax (a 1031 exchange can defer both). Figures are a year-1 estimate at your 24.0% rate — not tax advice; consult a CPA.
Schools (NCES district)
- District
- Escambia
- NCES district ID
- 1200510
- Math proficiency
- 40% ▼ -9.00%
- Reading proficiency
- 45% ▼ -4.00%
- Median HH income
- $44,649
- Composite
- 36.04/100
- National rank
- #4773
- State rank
- #56 of 73 in FL
Livability — Myrtle Grove
- Score
- 64/100
- State rank
- #701
- US rank
- #14805
Category grades
Schools grade is shown separately in the Schools card above.
Census & demographics
- Census place
- Myrtle Grove, FL
- County
- Escambia County · 301,722 people
- City population
- 1,170
- Metro
- Pensacola-Ferry Pass-Brent, FL
- Population (ZIP)
- 34,549
- Household income
- $62,486
- Rent vs Own
- Severe rent burden
- 1359.0
Population outlook (Escambia County) Hauer SSP2
- Today (2025)
- 334,637 people
- By 2030
- 345,779 · +3.3%
- By 2040
- 364,828 · +9.0%
- By 2050
- 378,514 · +13.1%
- By 2075
- 403,220 · +20.5%
- By 2100
- 386,125 · +15.4%
Race, ethnicity, and origin ACS 2023
- Neighborhood character
- Diverse neighborhood (Simpson 0.60)
- Race & ethnicity
- White 60% Black 18% Two or more races 11% Hispanic / Latino 6% Asian 6%
- Hispanic origin (detail)
- Mexican 3%
- Common ancestry
- Lithuanian 4% Slovak 2% Italian 2%
- Foreign-born
- 9% · Canada, China, Vietnam
- Languages at home
- 89% English-only · Spanish 4% Tagalog/Filipino 2% Other Indo-European 1%
Political lean MEDSL · Escambia
- 2024 margin
- R (+19.5) · D 39.7% · R 59.2% · Other 1.1%
- 2008→2024 swing
- -0.2pp no change · 2008: -19.3pp · 2024: -19.5pp
- All cycles
- 2024: R+19.5 2020: R+15.1 2016: R+20.6 2012: R+20.6 2008: R+19.3
Not yet ingested
- Civics
- —
Market trends
- HPI YoY
- ▼ -71.86%
- Current HPI
- 247.6085
- Rent YoY
- ▲ 3.85%
- Metro
- Pensacola-Ferry Pass-Brent, FL
- State GDP YoY
- ▲ 3.28%
- F500 in state
- 36
Industry mix (Fortune 500 HQ in FL)
| Industry | F500 HQs | Revenue |
|---|---|---|
| Industrial Technology | 2 | $29B |
|
||
| Insurance | 2 | $17B |
|
||
| Retail | 1 | $60B |
|
||
| Technology Distribution | 1 | $58B |
|
||
| Homebuilding | 1 | $35B |
|
||
| Technology Manufacturing | 1 | $35B |
|
||
Price history
1 event — show timeline
- 2026-05-21 Listed $125,000 PARMLS
Property tax history
+3.1%/yrLatest (2025): $654 · +25.1% YoY. Source: county tax records.
Cash-flow waterfall
monthlySold comps — $/sqft
last 12 mo · ≤1 miLoading sold comps…