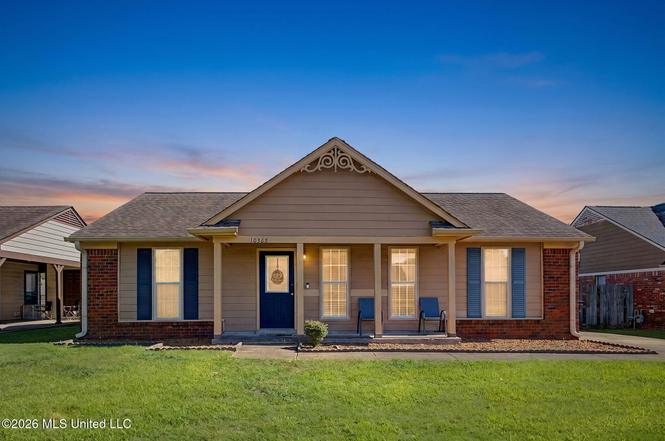
10365 Curtiss Dr · Olive Branch, MS
Flood risk 1/10 · Minimal
- FEMA flood zone
- X (unshaded)
- Chance of flooding over 30 yrs
- 0.0%
- Est. flood insurance / yr
- $507 – $1,088
Fire risk 2/10 · Minimal
- Est. fire insurance / yr
- $1,241 – $2,305
Heat risk 7/10 · Major
- Hot days now (above 109°F)
- 7 days/yr
- Hot days in 30 yrs
- 21 days/yr
Wind risk 4/10 · Minor
- Chance of severe wind over 30 yrs
- 19.0%
Air-quality risk 2/10 · Minimal
- Unhealthy air days now
- 2 days/yr
- Unhealthy air days in 30 yrs
- 2 days/yr
Risk factors via First Street. Map © Google.
Why this score? — see what drove the C- grade
The composite is a weighted blend of 9 inputs, each scored 0–100. Each bar is that input's sub-score; the figure is the points it added to the 100-point composite (weight × sub-score).
- Cash flow +20.9/30.0
- ARV discount +8.9/15.0
- DSCR +6.6/10.0
- 1% rule +4.3/10.0
- Schools +4.0/10.0
- Livability +3.6/5.0
- Condition / age +2.5/5.0
- Rent growth +2.4/5.0
- Appreciation +0.0/10.0
$199,000
🖨 Deal sheet 📄 Offer letter ✓ Due diligence
Listing remarks MLS
Home is Sold '' as is''. Owner is not knowledgeable in the repair and remodeling trades. House is sold as is>Partial wood fence. storage building brick exterior with wood trim. Ideal for small family.
Key facts
- Covered front porch
- Double vanity
- Split bedroom plan
Tags
Property features AI
Finance
- Other: Lot is level city lot (approximately 60 x 109); Living area recorded by assessor
Exterior
- Parking: Driveway; Parking pad; No garage; Concrete parking surfaces
- Utilities: Public water; Public sewer; Electricity connected; Natural gas connected; Cable connected; Fiber to the house; Sewer connected; Water connected
- Home design: Single-family house; One story; Move-in ready
- Construction: Board & batten siding and brick exterior; Asphalt shingle roof; Slab foundation; Built according to assessor records
- Exterior features: Private yard; Patio; Porch; Wood privacy fencing in back yard; Outbuilding / shed(s)
Interior
- Kitchen: Electric range; Free-standing electric range; Microwave; Stainless steel appliances
- Bedrooms: Primary bedroom on main level; Additional bedrooms on main level
- Flooring: Laminate flooring
- Bathrooms: 2 full bathrooms on main level
- Heating & cooling: Central heating (forced air, natural gas); Central air conditioning (electric); Ceiling fans
- Interior features: Ceiling fans; Double vanity; Eat-in kitchen; Pantry; Vaulted ceilings; Walk-in closet(s); Aluminum window frames with double-pane windows and window treatments; Metal insulated doors
- Laundry & utility: Laundry closet; Gas water heater
Neighborhood map
What this means for you Summary
Snapshot
- This is a 3-bed/2.0-bath single-family listed at $199k.
Deal economics
- At list price, monthly cash flow is $275 ($3k/yr) — positive.
- The deal already cash-flows at list — no discount required.
- To meet the 1% rule (rent ≥ 1% of price), the offer needs to be $185k (7.0% below list).
- Recommended offer: $185k (7.0% below list) — sets the bar for 1% rule.
- Cap rate 8.0% vs local median 4.3% in Olive Branch — top-decile yield for the area; either an underpriced asset or a hidden risk that comps aren't pricing in. Stress-test before assuming the spread holds.
Location & tenants
- Location reads 72/100 on livability (#29 in MS) — a middle-class / working-renter tenant base. Strengths: cost of living A+, housing A+, employment A; Watch: amenities F, commute F.
- Desoto County School District (suburban): math 48% / reading 42% proficiency, ranked #20 of 130 in MS (top 15%) — families likely to look elsewhere, expect single-tenant / working-renter base with shorter leases.
- Zoned schools: Olive Branch Elem (503 students, 99% FRL); Olive Branch Middle (math 48% / reading 32%, grade F, #68 of 179 statewide, top 38%, 726 students, 100% FRL); Olive Branch High School (math 54% / reading 48%, grade D+, #17 of 197 statewide, top 9%, 1,117 students, 100% FRL) — zoned schools average 100% FRL vs 43% district-wide (56 pts higher); higher-poverty schools than district average — tighter screening recommended.
- Market conditions: Rents soft (-0.3%/yr); 566 active listings in the ZIP; 25 comparable units currently listed for rent nearby; rentals at typical pace (median 24d on market — plan ~3-4 weeks tenant-placement turnaround); 44% of comp listings sitting > 30 days — soft ceiling on asking rent; solid renter incomes; 1,155 units permitted in DeSoto County in 2024 (0 in 5+ unit buildings).
Forward outlook
- Local home prices are declining (-3.0%/yr); year-one equity from $1k of loan paydown is wiped out by about $6k of value loss. Plan a longer hold.
- DeSoto County population projected at +33% by 2050 — long-run rental-demand tailwind backs the buy-and-hold thesis.
Negotiation context
- Only 1 days on market — expect competitive offers; lowballing is unlikely to land.
- 6 sale attempts since 24y ago with the ask held roughly flat each time — persistent listings suggest the price (not the market) is what's stuck; bring a comps-based counter.
Risks & watch-outs
- Climate carrying-cost: extreme-heat days projected 7→21/yr by 2055 (HVAC capex compounding) — expect insurance premiums to compound above CPI over the hold.
Questions for the listing agent
- Is there a deadline driving the sale (1031 exchange, divorce, estate, relocation)? That informs how much negotiation room exists.
- Schools are B-rated — typically a magnet for longer-tenancy family renters. What's the average tenant stay here, and is there a school-zone premium baked into asking?
- What's the average days-on-market for RENTAL listings here right now (not sales)? A rising rental-DOM trend means longer vacancies and softer asking-rent achievability than the comps imply.
- What's the recent tenant-quality profile in this submarket — average credit score on applications, eviction rate, late-payment / NSF rate, and stable-employment percentage? A property-management company in the area should have these aggregated.
- How much new for-sale + rental construction is in the pipeline within 1–3 miles? Heavy new supply typically softens prices + rents 12–24 months out; constrained supply supports both.
Investment metrics
- 1% rule
- 0.93% ✗
- Cap rate
- 7.95%
- Cash-on-cash
- 5.93%
- DSCR
- 1.26
- GRM
- 9.0
CMA / ARV
- ARV (on-the-fly)
- $205,254
- Comps found
- 12
Show comp detail 12 sales within ~0.75 mi
| Address | Dist | Beds/Ba | Sqft | Sold | Price | $/sf | Match |
|---|---|---|---|---|---|---|---|
| 6531 Kristen Dr | 0.26mi | 3/2.0 | 1,134 (0%) | 4mo | $225,000 | $198 | 85 |
| 10153 Stephenson Ln | 0.24mi | 3/2.0 | 1,200 (+6%) | 2mo | $239,900 | $200 | 78 |
| 10280 Yates Dr | 0.20mi | 3/2.0 | 1,237 (+9%) | 1mo | $210,000 | $170 | 75 |
| 6303 W Oak Run Dr | 0.52mi | 3/2.0 | 1,170 (+3%) | 2mo | $220,000 | $188 | 68 |
| 10155 Riggan Dr | 0.12mi | 3/2.0 | 1,293 (+14%) | 6mo | $210,000 | $162 | 66 |
| 10158 Oak Leaf Dr | 0.28mi | 3/2.0 | 1,298 (+14%) | 1mo | $225,000 | $173 | 62 |
| 6931 Magnolia Trail Cv | 0.31mi | 3/2.0 | 1,277 (+13%) | 6mo | $255,000 | $200 | 60 |
| 9678 Stuart Cv | 0.70mi | 3/2.0 | 1,265 (+12%) | 3mo | $244,900 | $194 | 46 |
| 9762 Riggan Dr | 0.60mi | 3/2.0 | 1,292 (+14%) | 5mo | $230,000 | $178 | 44 |
| 6290 E Oak Run Dr | 0.57mi | 3/2.0 | 1,298 (+14%) | 6mo | $235,000 | $181 | 44 |
| 6032 Robby Cv | 0.70mi | 3/2.0 | 1,278 (+13%) | 5mo | $214,900 | $168 | 42 |
| 9930 Sequoia Ln | 0.69mi | 3/2.0 | 1,304 (+15%) | 4mo | $234,900 | $180 | 40 |
Match score weights: distance 35% · size 25% · config 20% · recency 20%. Top-matched comps best support the ARV.
Projected returns pro-forma
-3.0% appreciation · 0.0% rent growth · sell at horizon
- IRR
- -10.2%
- Equity multiple
- 0.64×
- Total profit
- $-20,222
- Equity at exit
- $29,672
- IRR
- -5.1%
- Equity multiple
- 0.71×
- Total profit
- $-16,350
- Equity at exit
- $17,206
Cash invested: $55,720 (down + closing). Projections, not guarantees.
Landlord ↔ Tenant lean methodology
- Overall (STATE)
- 90 Strongly Landlord-Friendly
- State Mississippi
- 90 Strongly Landlord-Friendly · R+11
- County
- — inherits STATE
- City
- — inherits STATE
ZIP-level market 38654
- Home prices YoY
- -26.1%
- Rents YoY
- -0.3%
- Active inventory
- 566
- Price-to-rent
- 9.0×
Monthly cashflow live
- Estimated rent
- $1,851 high interval (Pro) →
- Mortgage (P&I)
- −$1,044
- Tax from tax record
- −$61 /mo · $728/yr
- Insurance
- −$83
- HOA
- −$0
- Vacancy / Maint / Mgmt
- −$389
- Net cashflow
- $275
Break-even live
UW: 25.0% down · 7.5% · 30yr · 1.5% tax · 5.0% vac · 8.0% maint · 8.0% mgmt
Financing live
Cash to close
- Down payment
- $49,750
- Closing costs
- $5,970
- Reserves months
- —
- Total cash needed
- —
Loan-product check · same deal, 3 products live
Conventional
25% down · 7.5% · 30yr
- Down + closing
- —
- Monthly P&I
- —
- Monthly cashflow
- —
- DSCR
- —
- Eligible?
- —
Personal DTI + credit; lowest rate.
DSCR
20% down · 8.5% · 30yr
- Down + closing
- —
- Monthly P&I
- —
- Monthly cashflow
- —
- DSCR
- —
- Eligible?
- —
No personal income docs; deal must DSCR.
Hard money
10% down · 12.0% · 12mo
- Down + closing
- —
- Monthly P&I
- —
- Monthly cashflow
- —
- DSCR
- —
- Eligible?
- —
Short-term bridge; refi at stabilization.
Rent comps 25 comps
| Address | Beds | Baths | Sqft | Rent | $/sqft | DOM | Units | Dist |
|---|---|---|---|---|---|---|---|---|
| 6649 Magnolia Dr Olive Branch, MS | 3.0 | 2.0 | 1085 | $1,800 | $1.66 | 43d | 1 | 0.11mi |
| 10233 Curtis Dr Olive Branch, MS | 3.0 | 2.0 | 1157 | $1,595 | $1.38 | 43d | 1 | 0.16mi |
| 10378 Yates Dr Olive Branch, MS | 3.0 | 2.0 | 1324 | $1,780 | $1.34 | 4d | 1 | 0.16mi |
| 10257 Palmer Dr Olive Branch, MS | 3.0 | 2.0 | 1134 | $1,495 | $1.32 | 23d | 1 | 0.18mi |
| 6571 Ashland Dr Olive Branch, MS | 3.0 | 2.0 | 1276 | $1,723 | $1.35 | 20d | 1 | 0.39mi |
| 10515 Oak Leaf Dr Olive Branch, MS | 3.0 | 2.0 | 1162 | $1,595 | $1.37 | 43d | 1 | 0.39mi |
| 6763 Ashland Dr Olive Branch, MS | 3.0 | 2.0 | 1200 | $1,590 | $1.32 | 11d | 1 | 0.39mi |
| 6534 Valerie Dr Olive Branch, MS | 4.0 | 2.0 | 1500 | $1,923 | $1.28 | 43d | 1 | 0.41mi |
| 6801 College Park Cv Olive Branch, MS | 3.0 | 2.0 | 1160 | $1,660 | $1.43 | 43d | 1 | 0.47mi |
| 9931 Adina Cv Olive Branch, MS | 3.0 | 2.0 | 1258 | $1,723 | $1.37 | 23d | 1 | 0.47mi |
| 6866 Valerie Dr Olive Branch, MS | 3.0 | 2.0 | 1500 | $1,795 | $1.20 | 43d | 1 | 0.47mi |
| 6813 Maury Dr Olive Branch, MS | 3.0 | 2.0 | 1086 | $1,395 | $1.28 | 43d | 1 | 0.57mi |
| 10453 Kristen Dr S Olive Branch, MS | 3.0 | 2.0 | 1264 | $1,803 | $1.43 | 3d | 1 | 0.62mi |
| 7117 Goodman Ridge Dr Olive Branch, MS | 3.0 | 2.0 | 1411 | $1,755 | $1.24 | 14d | 1 | 0.63mi |
| 6178 Morgan Manor Dr E Olive Branch, MS | 3.0 | 2.0 | 1411 | $1,860 | $1.32 | 11d | 1 | 0.64mi |
| 9763 Riggan Dr Olive Branch, MS | 3.0 | 2.0 | 1224 | $1,695 | $1.38 | 20d | 1 | 0.64mi |
| 6213 Magnolia Lakes Dr Olive Branch, MS | 3.0 | 2.0 | 1134 | $1,675 | $1.48 | 43d | 1 | 0.64mi |
| 7104 Olive Ridge Dr Olive Branch, MS | 3.0 | 2.0 | 1242 | $1,895 | $1.53 | 43d | 1 | 0.66mi |
| 5746 Oakley Dr Olive Branch, MS | 3.0 | 2.0 | 1358 | $1,835 | $1.35 | 4d | 1 | 0.92mi |
| 6795 Blocker St Olive Branch, MS | 2.0 | 1.0 | 750 | $1,095 | $1.46 | 23d | 1 | 0.99mi |
| 6795 Blocker St Unit 10 Olive Branch, MS | 2.0 | 1.0 | 750 | $1,095 | $1.46 | 43d | 1 | 0.99mi |
| 9455 Goodman Rd Unit b 3 Olive Branch, MS | 2.0 | 1.0 | 850 | $1,250 | $1.47 | 23d | 1 | 0.99mi |
| 7642 Fox Hunt Dr E Olive Branch, MS | 3.0 | 2.0 | 1286 | $1,675 | $1.30 | 23d | 1 | 1.05mi |
| 7665 Fox Hunt Dr E Olive Branch, MS | 3.0 | 2.0 | 1320 | $1,695 | $1.28 | 43d | 1 | 1.07mi |
| 9400 Goodman Rd Olive Branch, MS | 1.0–3.0 | 1.0–2.0 | 1163 | $2,005 | $1.72 | 1d | 17 | 1.22mi |
Listing history 2 events
-
2026-06-17remarks 486-char remark
-
2026-06-17$199,000 Active 1 DOM
ⓘ Source: listings_history table (triggers on properties + properties_extension) + one-shot
backfill from property_details.listing_events for pre-trigger history.
Tax reassessment forecast MS · Resets to sale price
- Current annual tax
- $728 · $61/mo
- Projected year-2 tax
- $1,572 · $131/mo
- Expected delta
- +$844/yr (+$70/mo · 115.9%)
ⓘ Screening estimate from a state-policy table — verify with the county assessor before closing.
Climate risk First Street
- Flood 1/10 Low FEMA zone X (unshaded) · 0% chance over 30 yrs
- Wildfire 2/10 Low
- Heat 7/10 Severe 7 d/yr ≥109°F today · 21 d/yr by 30 yrs out
- Wind 4/10 Moderate 19% chance of damaging wind over 30 yrs
- Air quality 2/10 Low 2 unhealthy d/yr today · 2 by 30 yrs out
Nearby sold comps map
Loading sold comps map…
Walkable amenities ~0.75 mi
Loading nearby amenities…
Taxation est. · year 1
- Rental income
- $22,216
- − Mortgage interest
- −$11,147
- − Property taxes
- −$728
- − Insurance
- −$995
- − Repairs & maintenance
- −$1,777
- − Management
- −$1,777
- − Depreciation
- −$5,789
- Taxable income
- $2
- Est. tax owed @ 24.0%
- −$0
- After-tax cash flow
- $3,304/yr
For passive investors: Depreciation is non-cash, so a rental often shows a tax loss while cash-flowing — sheltering income. Rental losses are passive: they offset passive income freely, and up to $25,000/yr can offset ordinary (W-2) income if you actively participate and your MAGI is under $100k (phasing out to $0 by $150k); unused losses carry forward. On sale, claimed depreciation is recaptured at up to 25%, and gains may owe capital-gains tax (a 1031 exchange can defer both). Figures are a year-1 estimate at your 24.0% rate — not tax advice; consult a CPA.
Schools (NCES district)
- District
- Desoto County School District
- NCES district ID
- 2801320
- Math proficiency
- 48% ▼ -13.00%
- Reading proficiency
- 42% ▼ -6.00%
- Median HH income
- $59,272
- Composite
- 39.56/100
- National rank
- #3933
- State rank
- #20 of 130 in MS
Livability — Olive Branch
- Score
- 72/100
- State rank
- #29
- US rank
- #6509
Category grades
Schools grade is shown separately in the Schools card above.
Census & demographics
- Census place
- Olive Branch, MS
- County
- DeSoto County · 176,513 people
- City population
- 57,898
- Metro
- Memphis, TN-MS-AR
- Population (ZIP)
- 57,898
- Household income
- $103,092
- Rent vs Own
- Severe rent burden
- 801.0
Population outlook (DeSoto County) Hauer SSP2
- Today (2025)
- 203,338 people
- By 2030
- 217,692 · +7.1%
- By 2040
- 245,320 · +20.6%
- By 2050
- 270,133 · +32.8%
- By 2075
- 323,341 · +59.0%
- By 2100
- 348,742 · +71.5%
Race, ethnicity, and origin ACS 2023
- Neighborhood character
- Diverse neighborhood (Simpson 0.57)
- Race & ethnicity
- White 57% Black 32% Hispanic / Latino 5% Two or more races 5% Asian 2%
- Hispanic origin (detail)
- Mexican 4%
- Common ancestry
- Slovak 2% Lithuanian 1% Romanian 1%
- Foreign-born
- 4% · Canada, Vietnam, China
- Languages at home
- 93% English-only · Spanish 4% Vietnamese 1% Arabic 1%
Political lean MEDSL · DeSoto
- 2024 margin
- Strong R (+24.1) · D 36.7% · R 60.8% · Other 2.5%
- 2008→2024 swing
- +14.2pp toward D · 2008: -38.2pp · 2024: -24.1pp
- All cycles
- 2024: R+24.1 2020: R+23.9 2016: R+34.8 2012: R+33.5 2008: R+38.2
Not yet ingested
- Civics
- —
Market trends
- HPI YoY
- ▼ -66.27%
- Current HPI
- 187.2114
- Rent YoY
- ▼ -0.34%
- Metro
- Memphis, TN-MS-AR
- State GDP YoY
- —
- F500 in state
- 0
Price history
+140.6% since first listed15 events — show timeline
- 2026-06-16 Listed $199,000 MLSU
- 2021-09-20 Sold (Public Records) — Public Records
- 2021-09-10 Sold (MLS) — MLSU
- 2021-07-31 Listed $145,000 MLSU
- 2020-10-07 Sold (Public Records) — Public Records
- 2020-10-05 Sold (MLS) — MLSU
- 2020-09-11 Listed $139,999 MLSU
- 2016-04-11 Sold (MLS) — MLSU
- 2016-04-01 Sold (Public Records) — Public Records
- 2015-11-30 Listed $95,000 MLSU
- 2007-11-01 Sold (Public Records) — Public Records
- 2007-10-31 Sold (MLS) — MLSU
- 2007-07-06 Listed $97,000 MLSU
- 2002-09-26 Sold (MLS) — MLSU
- 2002-06-26 Listed $82,700 MLSU
Property tax history
+2.0%/yrLatest (2025): $728 · +14.4% YoY. Source: county tax records.
Cash-flow waterfall
monthlySold comps — $/sqft
last 12 mo · ≤1 miLoading sold comps…