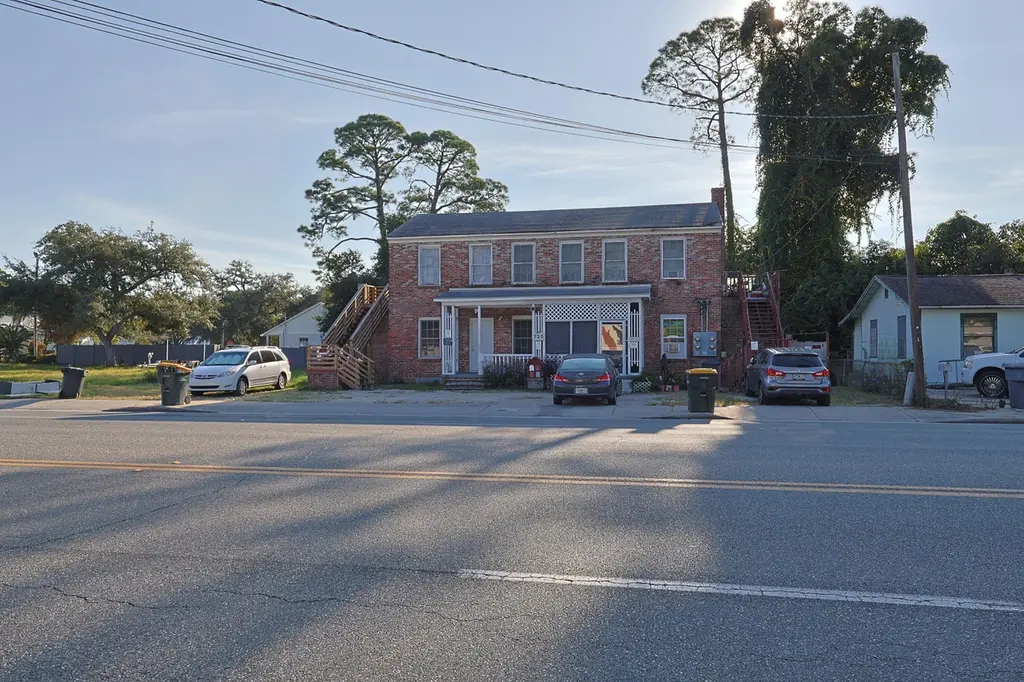
125 Beal Pkwy · Fort Walton Beach, FL
Flood risk 6/10 · Moderate
- FEMA flood zone
- X (unshaded)
- Chance of flooding over 30 yrs
- 0.67%
- Est. flood insurance / yr
- $507 – $1,088
Fire risk 1/10 · Minimal
- Est. fire insurance / yr
- $947 – $1,759
Heat risk 10/10 · Severe
- Hot days now (above 104°F)
- 7 days/yr
- Hot days in 30 yrs
- 22 days/yr
Wind risk 9/10 · Severe
- Chance of severe wind over 30 yrs
- 99.0%
Air-quality risk 2/10 · Minimal
- Unhealthy air days now
- 1 days/yr
- Unhealthy air days in 30 yrs
- 2 days/yr
Risk factors via First Street. Map © Google.
Why this score? — see what drove the C- grade
The composite is a weighted blend of 9 inputs, each scored 0–100. Each bar is that input's sub-score; the figure is the points it added to the 100-point composite (weight × sub-score).
- ARV discount +15.0/15.0
- Cash flow +14.2/30.0
- Schools +5.2/10.0
- DSCR +4.3/10.0
- Livability +4.0/5.0
- 1% rule +3.2/10.0
- Rent growth +2.8/5.0
- Condition / age +2.5/5.0
- Appreciation +0.0/10.0
$397,000
🖨 Deal sheet 📄 Offer letter ✓ Due diligence
Listing remarks MLS
Excellent opportunity with strong potential and excellent location! This property features four individual units totaling approximately 2,550 square feet. Each unit offers 1 bedroom, 1 bathroom, a living room, and an additional bonus room that could serve as a second bedroom or office. This four-plex is conveniently located on Beal and just minutes from downtown, the property is zoned commercial and offers flexibility for future use. To the seller's knowledge, the property will require a full renovation, but presents significant upside for the right buyer. Please do not disturb tenants. Be sure to schedule your appointment today. This property needs significant work and can also be purchased as a land only sale. Buyer to verify all measurements and pertinent data.
Key facts
- Full renovation
- Excellent location
- Zoned commercial
Tags
Neighborhood map
What this means for you Summary
Snapshot
- This is a 4-bed/4.0-bath townhouse listed at $397k.
Deal economics
- At list price, monthly cash flow is $69 ($827/yr) — positive.
- The deal already cash-flows at list — no discount required.
- To meet the 1% rule (rent ≥ 1% of price), the offer needs to be $326k (17.8% below list).
- Recommended offer: $326k (17.8% below list) — sets the bar for 1% rule.
- Cap rate 6.5% vs local median 0.9% in Fort Walton Beach — top-decile yield for the area; either an underpriced asset or a hidden risk that comps aren't pricing in. Stress-test before assuming the spread holds.
Location & tenants
- Location reads 80/100 on livability (#111 in FL, #1,628 nationally) — a professional / high-income tenant draw. Strengths: commute A+, housing A+, health & safety A+; Watch: schools C-, amenities F.
- Okaloosa (other): math 60% / reading 60% proficiency, ranked #12 of 73 in FL (top 16%) — acceptable for families but not a draw, mixed tenant base, ~2y average lease.
- Market conditions: Rents rising (+1.3%/yr); 341 active listings in the ZIP; 4 comparable units currently listed for rent nearby; rentals lingering (median 44d on market — plan ~5-8 weeks vacancy on turnover, expect pricing pressure); 50% of comp listings sitting > 30 days — soft ceiling on asking rent; 1,268 units permitted in Okaloosa County in 2024 (175 in 5+ unit buildings).
- At $3,263/mo this rent would consume 60% of the median local household income ($65k/yr) (locally 889% of renters already pay >50% of income on rent) — very limited rent-growth headroom before tenants either downsize or default.
Forward outlook
- Local home prices are declining (-3.0%/yr); year-one equity from $3k of loan paydown is wiped out by about $12k of value loss. Plan a longer hold.
- Okaloosa County population projected at +37% by 2050 — long-run rental-demand tailwind backs the buy-and-hold thesis.
Negotiation context
- It's been on market 280 days — a 12% lower offer ($349k) is reasonable based on typical stale-listing flexibility.
- 2 sale attempts with the ask held roughly flat each time — persistent listings suggest the price (not the market) is what's stuck; bring a comps-based counter.
- Current owner paid $114k; list at $397k implies a 248% gain — meaningful room to come down on a strong offer.
Risks & watch-outs
- Watch-outs: built in 1951 — expect roof / HVAC / electrical / plumbing capex.
- Climate carrying-cost: major flood risk; severe wind risk, 99% chance of damaging wind over 30y; extreme-heat days projected 7→22/yr by 2055 (HVAC capex compounding) — expect insurance premiums to compound above CPI over the hold.
Questions for the listing agent
- It's been on market 280 days. Have you received any prior offers? Is the seller open to a 18% concession, seller financing, or rate buy-down credit?
- Built in 1951 — when were the roof, HVAC, electrical panel, plumbing, and water heater last replaced?
- Why hasn't it sold? Are there any deal-killer items the seller is aware of (foundation, flood, title, zoning, code violations)?
- Is there a deadline driving the sale (1031 exchange, divorce, estate, relocation)? That informs how much negotiation room exists.
- What's the average days-on-market for RENTAL listings here right now (not sales)? A rising rental-DOM trend means longer vacancies and softer asking-rent achievability than the comps imply.
- What's the recent tenant-quality profile in this submarket — average credit score on applications, eviction rate, late-payment / NSF rate, and stable-employment percentage? A property-management company in the area should have these aggregated.
- How much new for-sale + rental construction is in the pipeline within 1–3 miles? Heavy new supply typically softens prices + rents 12–24 months out; constrained supply supports both.
Investment metrics
- 1% rule
- 0.82% ✗
- Cap rate
- 6.50%
- Cash-on-cash
- 0.74%
- DSCR
- 1.03
- GRM
- 10.1
CMA / ARV
- ARV (median comp)
- $693,913
- List price
- $397,000
- Delta
- -42.79%
- Verdict
- UNDERPRICED
- Comps
- 20 within 1.0 mi
Show comp detail 4 sales within ~0.75 mi
| Address | Dist | Beds/Ba | Sqft | Sold | Price | $/sf | Match |
|---|---|---|---|---|---|---|---|
| 124 SW Miracle Strip Pkwy Unit 1202 | 0.36mi | 3/3.0 (-1) | 2,503 (-2%) | 19mo | $1,075,000 | $429 | 55 |
| 187 SE Brooks St Unit B601 | 0.67mi | 5/5.0 (+1) | 2,711 (+6%) | 13mo | $972,500 | $359 | 38 |
| 124 SW Miracle Strip Pkwy Unit 1500 | 0.67mi | 3/3.0 (-1) | 2,168 (-15%) | 18mo | $850,000 | $392 | 20 |
| 124 SW Miracle Strip Pkwy Unit 1200 | 0.67mi | 3/3.0 (-1) | 2,168 (-15%) | 23mo | $870,000 | $401 | 16 |
Match score weights: distance 35% · size 25% · config 20% · recency 20%. Top-matched comps best support the ARV.
Projected returns pro-forma
-3.0% appreciation · 1.33% rent growth · sell at horizon
- IRR
- -16.9%
- Equity multiple
- 0.41×
- Total profit
- $-65,431
- Equity at exit
- $59,194
- IRR
- -11.9%
- Equity multiple
- 0.34×
- Total profit
- $-73,113
- Equity at exit
- $34,325
Cash invested: $111,160 (down + closing). Projections, not guarantees.
Landlord ↔ Tenant lean methodology
- Overall (STATE)
- 87 Strongly Landlord-Friendly
- State Florida
- 87 Strongly Landlord-Friendly · R+3
- County
- — inherits STATE
- City
- — inherits STATE
ZIP-level market 32548
- Home prices YoY
- -31.1%
- Rents YoY
- 1.3%
- Active inventory
- 341
- Price-to-rent
- 10.1×
Monthly cashflow live
- Estimated rent
- $3,263 medium interval (Pro) →
- Mortgage (P&I)
- −$2,082
- Tax from tax record
- −$262 /mo · $3,142/yr
- Insurance
- −$165
- HOA
- −$0
- Vacancy / Maint / Mgmt
- −$685
- Net cashflow
- $69
Break-even live
UW: 25.0% down · 7.5% · 30yr · 1.5% tax · 5.0% vac · 8.0% maint · 8.0% mgmt
Financing live
Cash to close
- Down payment
- $99,250
- Closing costs
- $11,910
- Reserves months
- —
- Total cash needed
- —
Loan-product check · same deal, 3 products live
Conventional
25% down · 7.5% · 30yr
- Down + closing
- —
- Monthly P&I
- —
- Monthly cashflow
- —
- DSCR
- —
- Eligible?
- —
Personal DTI + credit; lowest rate.
DSCR
20% down · 8.5% · 30yr
- Down + closing
- —
- Monthly P&I
- —
- Monthly cashflow
- —
- DSCR
- —
- Eligible?
- —
No personal income docs; deal must DSCR.
Hard money
10% down · 12.0% · 12mo
- Down + closing
- —
- Monthly P&I
- —
- Monthly cashflow
- —
- DSCR
- —
- Eligible?
- —
Short-term bridge; refi at stabilization.
Rent comps 4 comps
| Address | Beds | Baths | Sqft | Rent | $/sqft | DOM | Units | Dist |
|---|---|---|---|---|---|---|---|---|
| 113 Brooks St SE #206 Fort Walton Beach, FL | 3.0 | 3.0 | 2030 | $2,750 | $1.35 | 43d | 1 | 0.39mi |
| 723 Sailfish Dr Fort Walton Beach, FL | 4.0 | 3.0 | 2400 | $3,899 | $1.62 | 13d | 1 | 0.93mi |
| 910 Santa Rosa Blvd Fort Walton Beach, FL | 3.0 | 3.5 | 3414 | $6,500 | $1.90 | 21d | 1 | 1.28mi |
| 17 Choctawhatchee Rd SE Fort Walton Beach, FL | 3.0 | 2.0 | 1892 | $2,600 | $1.37 | 43d | 1 | 1.36mi |
Listing history 19 events
-
2026-06-18days on market $397,000 Active 280 DOM
-
2026-06-17days on market $397,000 Active 279 DOM
-
2026-06-16days on market $397,000 Active 278 DOM
-
2026-06-15days on market $397,000 Active 277 DOM
-
2026-06-14days on market $397,000 Active 275 DOM
-
2026-06-13days on market $397,000 Active 274 DOM
-
2026-06-10days on market $397,000 Active 272 DOM
-
2026-06-09days on market $397,000 Active 271 DOM
-
2026-06-08days on market $397,000 Active 270 DOM
-
2026-06-07days on market $397,000 Active 269 DOM
-
2026-06-05days on market $397,000 Active 266 DOM
-
2026-06-02days on market $397,000 Active 264 DOM
-
2026-06-01days on market $397,000 Active 263 DOM
-
2026-05-31days on market $397,000 Active 262 DOM
-
2026-05-30days on market $397,000 Active 261 DOM
-
2025-09-11$397,000 Active 774-char remark
Show marketing remark (774 chars)
Excellent opportunity with strong potential and excellent location! This property features four individual units totaling approximately 2,550 square feet. Each unit offers 1 bedroom, 1 bathroom, a living room, and an additional bonus room that could serve as a second bedroom or office. This four-plex is conveniently located on Beal and just minutes from downtown, the property is zoned commercial and offers flexibility for future use. To the seller's knowledge, the property will require a full renovation, but presents significant upside for the right buyer. Please do not disturb tenants. Be sure to schedule your appointment today. This property needs significant work and can also be purchased as a land only sale. Buyer to verify all measurements and pertinent data.
-
2025-07-31price $397,000
-
2025-06-24$497,900 Active
-
2003-02-04soldstatus $114,000
ⓘ Source: listings_history table (triggers on properties + properties_extension) + one-shot
backfill from property_details.listing_events for pre-trigger history.
Tax reassessment forecast FL · Resets to sale price
- Current annual tax
- $3,142 · $262/mo
- Projected year-2 tax
- $3,295 · $275/mo
- Expected delta
- +$153/yr (+$13/mo · 4.9%)
ⓘ Screening estimate from a state-policy table — verify with the county assessor before closing.
Climate risk First Street
- Flood 6/10 Major FEMA zone X (unshaded) · 67% chance over 30 yrs
- Wildfire 1/10 Low
- Heat 10/10 Extreme 7 d/yr ≥104°F today · 22 d/yr by 30 yrs out
- Wind 9/10 Extreme 99% chance of damaging wind over 30 yrs
- Air quality 2/10 Low 1 unhealthy d/yr today · 2 by 30 yrs out
Nearby sold comps map
Loading sold comps map…
Walkable amenities ~0.75 mi
Loading nearby amenities…
Taxation est. · year 1
- Rental income
- $39,161
- − Mortgage interest
- −$22,238
- − Property taxes
- −$3,142
- − Insurance
- −$1,985
- − Repairs & maintenance
- −$3,133
- − Management
- −$3,133
- − Depreciation
- −$11,549
- Taxable loss
- −$6,019
- Est. tax savings @ 24.0%
- +$1,445
- After-tax cash flow
- $2,272/yr
For passive investors: Depreciation is non-cash, so a rental often shows a tax loss while cash-flowing — sheltering income. Rental losses are passive: they offset passive income freely, and up to $25,000/yr can offset ordinary (W-2) income if you actively participate and your MAGI is under $100k (phasing out to $0 by $150k); unused losses carry forward. On sale, claimed depreciation is recaptured at up to 25%, and gains may owe capital-gains tax (a 1031 exchange can defer both). Figures are a year-1 estimate at your 24.0% rate — not tax advice; consult a CPA.
Schools (NCES district)
- District
- Okaloosa
- NCES district ID
- 1201380
- Math proficiency
- 60% ▼ -12.00%
- Reading proficiency
- 60% ▼ -4.00%
- Median HH income
- $55,601
- Composite
- 51.62/100
- National rank
- #1705
- State rank
- #12 of 73 in FL
Livability — Fort Walton Beach
- Score
- 80/100
- State rank
- #111
- US rank
- #1628
Category grades
Schools grade is shown separately in the Schools card above.
Census & demographics
- Census place
- Fort Walton Beach, FL
- County
- Okaloosa County · 194,352 people
- City population
- 59,301
- Metro
- Crestview-Fort Walton Beach-Destin, FL
- Population (ZIP)
- 23,774
- Household income
- $65,342
- Rent vs Own
- Severe rent burden
- 889.0
Population outlook (Okaloosa County) Hauer SSP2
- Today (2025)
- 235,133 people
- By 2030
- 253,483 · +7.8%
- By 2040
- 289,537 · +23.1%
- By 2050
- 322,954 · +37.3%
- By 2075
- 399,624 · +70.0%
- By 2100
- 425,311 · +80.9%
Race, ethnicity, and origin ACS 2023
- Neighborhood character
- Diverse neighborhood (Simpson 0.57)
- Race & ethnicity
- White 63% Hispanic / Latino 13% Black 12% Two or more races 9% Asian 6%
- Hispanic origin (detail)
- Mexican 4% Puerto Rican 2%
- Common ancestry
- Italian 4% Slovak 3% Romanian 2%
- Foreign-born
- 12% · Canada, Jamaica
- Languages at home
- 84% English-only · Spanish 9% Other Asian/Pacific 3% Other Indo-European 1%
Political lean MEDSL · Okaloosa
- 2024 margin
- Solid R (+42.4) · D 28.2% · R 70.7% · Other 1.1%
- 2008→2024 swing
- +2.5pp toward D · 2008: -44.9pp · 2024: -42.4pp
- All cycles
- 2024: R+42.4 2020: R+39.1 2016: R+47.8 2012: R+49.4 2008: R+44.9
Not yet ingested
- Civics
- —
Market trends
- HPI YoY
- ▼ -123.88%
- Current HPI
- 274.8418
- Rent YoY
- ▲ 1.33%
- Metro
- Crestview-Fort Walton Beach-Destin, FL
- State GDP YoY
- ▲ 3.28%
- F500 in state
- 36
Industry mix (Fortune 500 HQ in FL)
| Industry | F500 HQs | Revenue |
|---|---|---|
| Industrial Technology | 2 | $29B |
|
||
| Insurance | 2 | $17B |
|
||
| Retail | 1 | $60B |
|
||
| Technology Distribution | 1 | $58B |
|
||
| Homebuilding | 1 | $35B |
|
||
| Technology Manufacturing | 1 | $35B |
|
||
Price history
+248.2% since first listed4 events — show timeline
- 2025-09-11 Listed $397,000 ECAR
- 2025-07-31 Price Changed $397,000 ECAR
- 2025-06-24 Listed $497,900 ECAR
- 2003-02-04 Sold (Public Records) $114,000 Public Records
Property tax history
+3.8%/yrLatest (2025): $3,142 · +9.1% YoY. Source: county tax records.
Cash-flow waterfall
monthlySold comps — $/sqft
last 12 mo · ≤1 miLoading sold comps…